Litecoin continues to trade beneath the $100 level after another failed attempt to break above it this week. The resistance in this range is bolstered by the 100-day EMA, making it difficult for LTC/USD to break through, especially with Bitcoin hovering around $10,000. This month has been difficult for the entire crypto market including LTC, whose price has declined by approximately 30% throughout the past 30 days.
Litecoin has been in a peculiar position, as many had believed the cryptocurrency would be surging at this point considering that its block reward halving is only around 10 days away. However, considering the recent declines, many analysts have stated that the halving has already been priced into the market after Litecoin hit 0.017 BTC in mid-June.
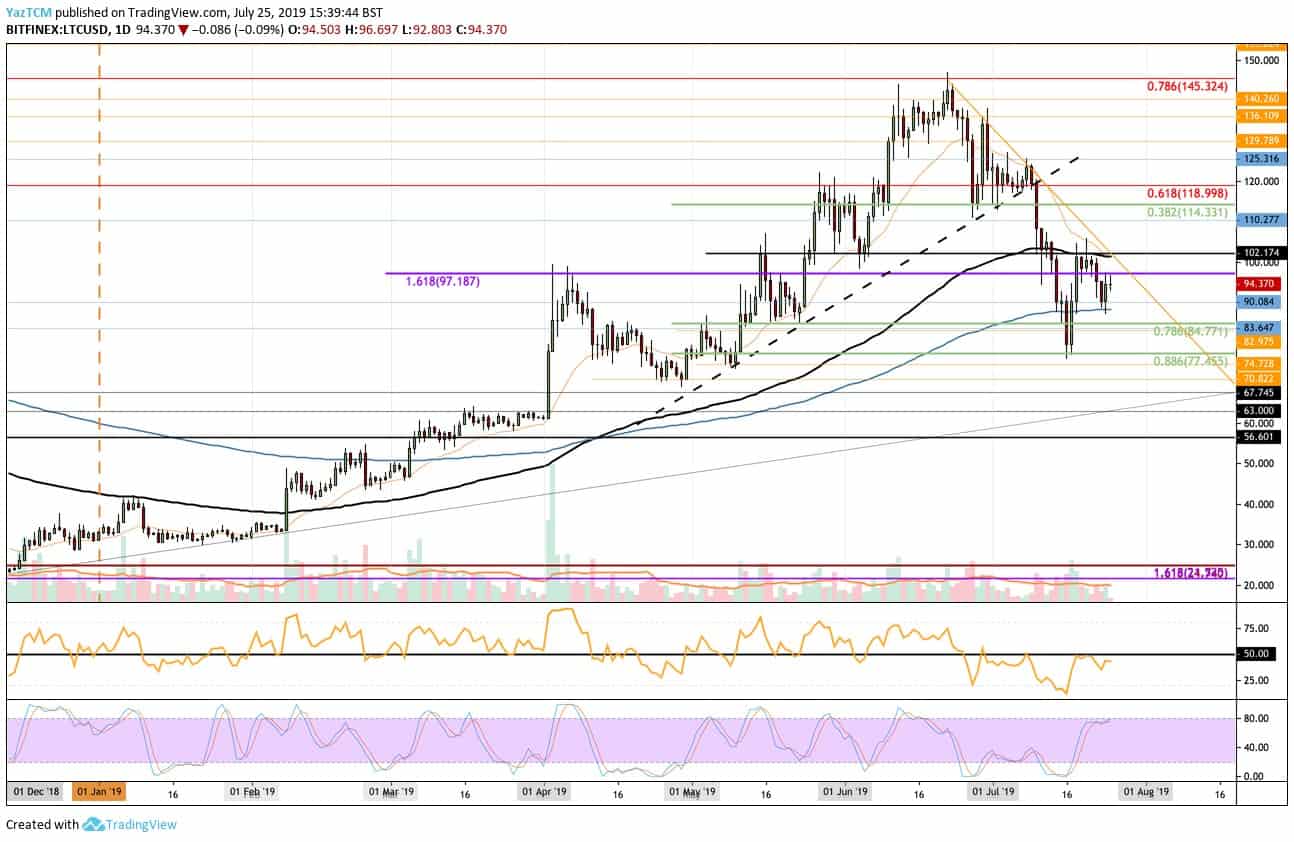
Looking at the LTC/USD 1-day chart:
- Since our previous Litecoin analysis, we have seen that the $100 resistance level was too much for the bulls. Litecoin has since rolled over and dropped toward the support at the 200-day EMA around $88 where it bounced back to $94.
- From above: The nearest levels of resistance lie at $97.18 and $100. If the bulls break above $100, higher resistance is found at $110, $114, $119, and $125.
- From below: The closest levels of support are $90 and $88. Beneath this, further support lies at $84.77, $77.45, $70.82, and $67.74.
- The trading volume has been decreasing as we have neared the end of the month.
- The RSI found resistance at 50, which indicates that the bears remain in control of the market. Furthermore, the Stochastic RSI is primed for a bearish crossover in overbought territory which is a troubling sign for Litecoin bulls in the short term.
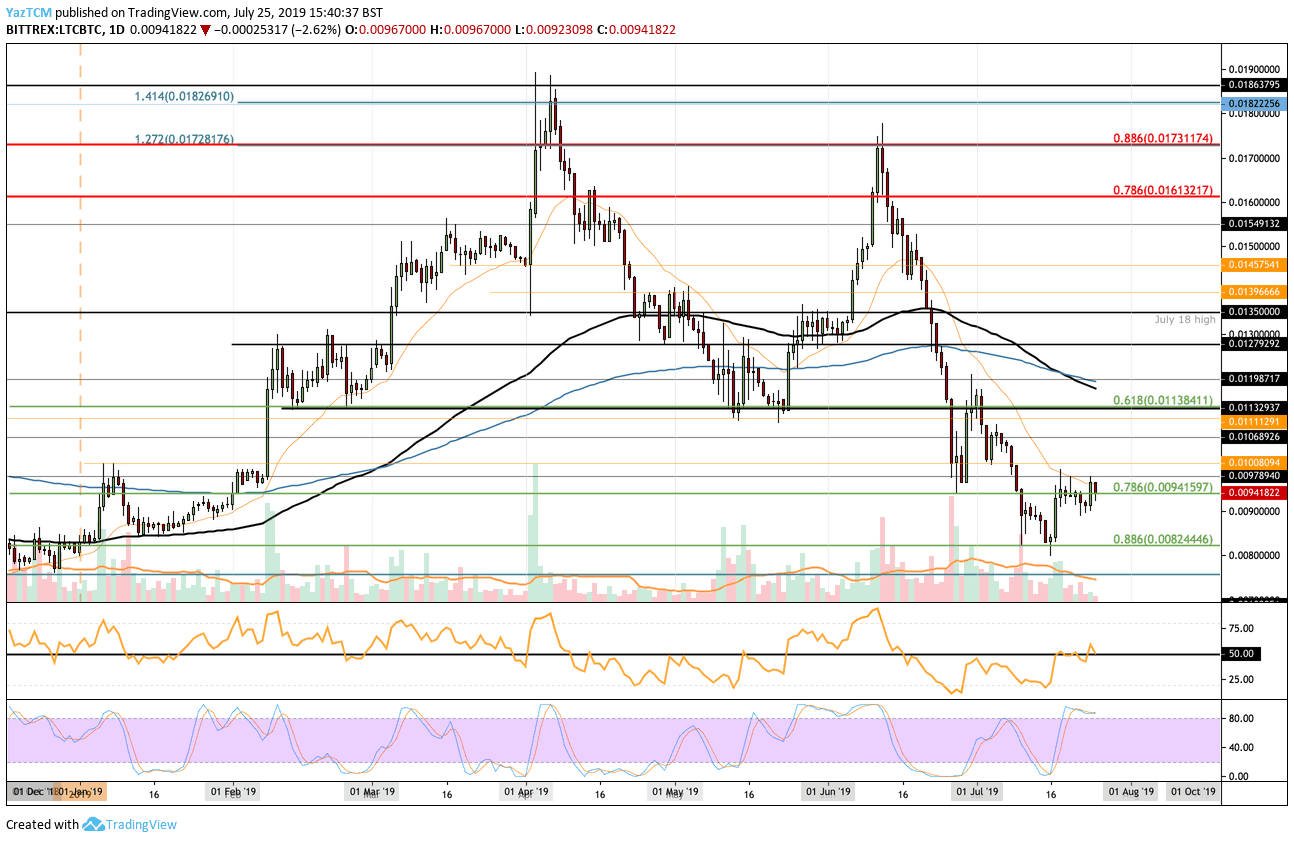
Looking at the LTC/BTC 1-day chart:
- Trading against Bitcoin, Litecoin has so far failed to break above the 0.01 BTC resistance level. However, the cryptocurrency is starting to show some promising signs that it could start to make higher highs if it can break above 0.01 BTC.
- From above: The nearest level of resistance is 0.01 BTC. Above this, higher resistance lies at 0.0106 BTC, 0.0111 BTC, 0.0113 BTC, and 0.012 BTC. If the bulls can break above here, the next levels of resistance are located at 0.0125 BTC and 0.013 BTC.
- The trading volume has been consistently diminishing as the month has progressed, which could suggest that the selling has finished.
- The RSI managed to break above 50 recently, which shows that the bulls are starting to wake up.
SPECIAL OFFER (Sponsored)
Binance Free $600 (CryptoPotato Exclusive): Use this link to register new account and receive $600 exclusive welcome offer on Binance (
full details).
LIMITED OFFER 2024 for CryptoPotato readers at Bybit: Use this link to register and open a $500 BTC-USDT position on Bybit Exchange for free!
Disclaimer: Information found on CryptoPotato is those of writers quoted. It does not represent the opinions of CryptoPotato on whether to buy, sell, or hold any investments. You are advised to conduct your own research before making any investment decisions. Use provided information at your own risk. See Disclaimer for more information.
Cryptocurrency charts by TradingView.