Litecoin has seen a decent price surge over the previous 24 hours, which totals over 15% – bringing the LTC price to rise back above the $115 resistance level, facing the $120. The cryptocurrency had experienced a sharp price fall at the start of June 2019 but has since recovered and is climbing back toward the 2019 high around $120.
The recent price increase has sent Litecoin to the 4th place in the top market cap rankings, as it currently holds a $7.12 billion market cap value.
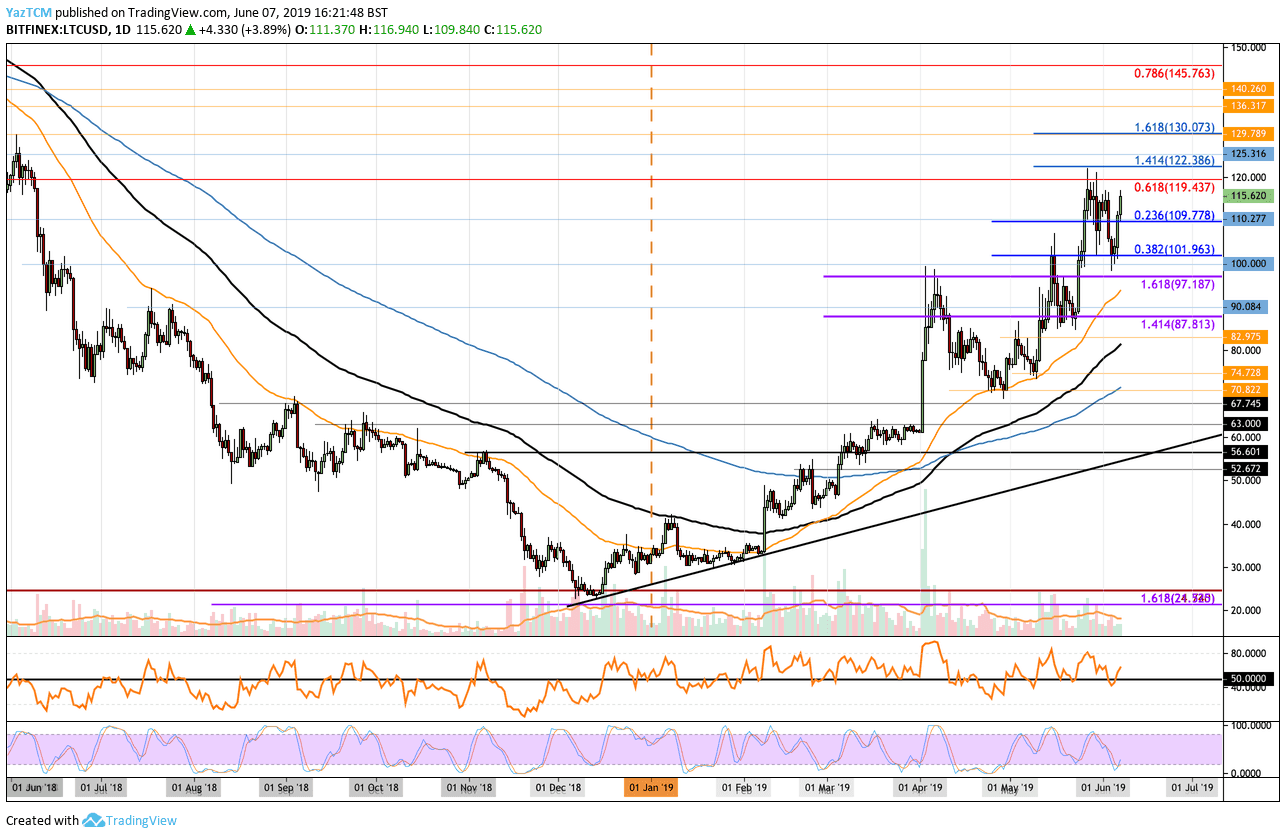
Looking at the LTC/USD 1-Day Chart:
- From above: The nearest level of resistance now lies at $120, which is resistance provided by the long term bearish .618 Fibonacci Retracement level. Further higher resistance lies at $122, $130, $136, $140, and $145.76 where lies the bearish .786 Fibonacci Retracement level.
- From below: The nearest level of support now lies at $109.77, $101.96 and $100. Beneath $100, further support lies at $97.18 and $87.81.
- The trading volume has started to increase over the past couple of days slowly.
- The Stochastic RSI oscillator is in oversold conditions as we wait for a bullish crossover signal to send the coin higher.
Looking at the LTC/BTC 1-Day Chart:
- Against Bitcoin, we can see that Litecoin had been struggling since dropping from the April 2019 high around 0.019 BTC. Litecoin fell through April and June until support was found at 0.01128 BTC where lies the .618 Fibonacci Retracement level. Litecoin has since rebounded and currently trades at resistance around 0.0145 BTC.
- From above: The nearest level of resistance above 0.0145 BTC lies at 0.015 BTC. Above 0.015 BTC, further resistance then lies at 0.01550 BTC and 0.016 BTC. The resistance 0.016 BTC is further bolstered by the long term .786 Fibonacci Retracement level at 0.01614 BTC.
- From below: The nearest level of support now lies at 0.014 BTC. Beneath this, further support lies at 0.0135 BTC, 0.013 BTC, and 0.01264 BTC.
- The trading volume has also been increasing as June 2019 continues to trade.
- The RSI and Stochastic RSI have both reached overbought conditions which suggest a potential pullback may occur soon.
SPECIAL OFFER (Sponsored)
LIMITED OFFER 2024 for CryptoPotato readers at Bybit: Use this link to register and open a $500 BTC-USDT position on Bybit Exchange for free!
Disclaimer: Information found on CryptoPotato is those of writers quoted. It does not represent the opinions of CryptoPotato on whether to buy, sell, or hold any investments. You are advised to conduct your own research before making any investment decisions. Use provided information at your own risk. See Disclaimer for more information.
Cryptocurrency charts by TradingView.