Litecoin decreased by around 26% over the past week, following the rest of the market and Bitcoin’s violent plunge. The cryptocurrency saw another 3% drop today which brought its price down to $55.
Although the situation may be looking pretty dire against the USD, LTC is holding pretty firm against BTC as it moved sideways during the latest period of instability. Litecoin is now the sixth-largest cryptocurrency with a market cap of $3.49 billion.
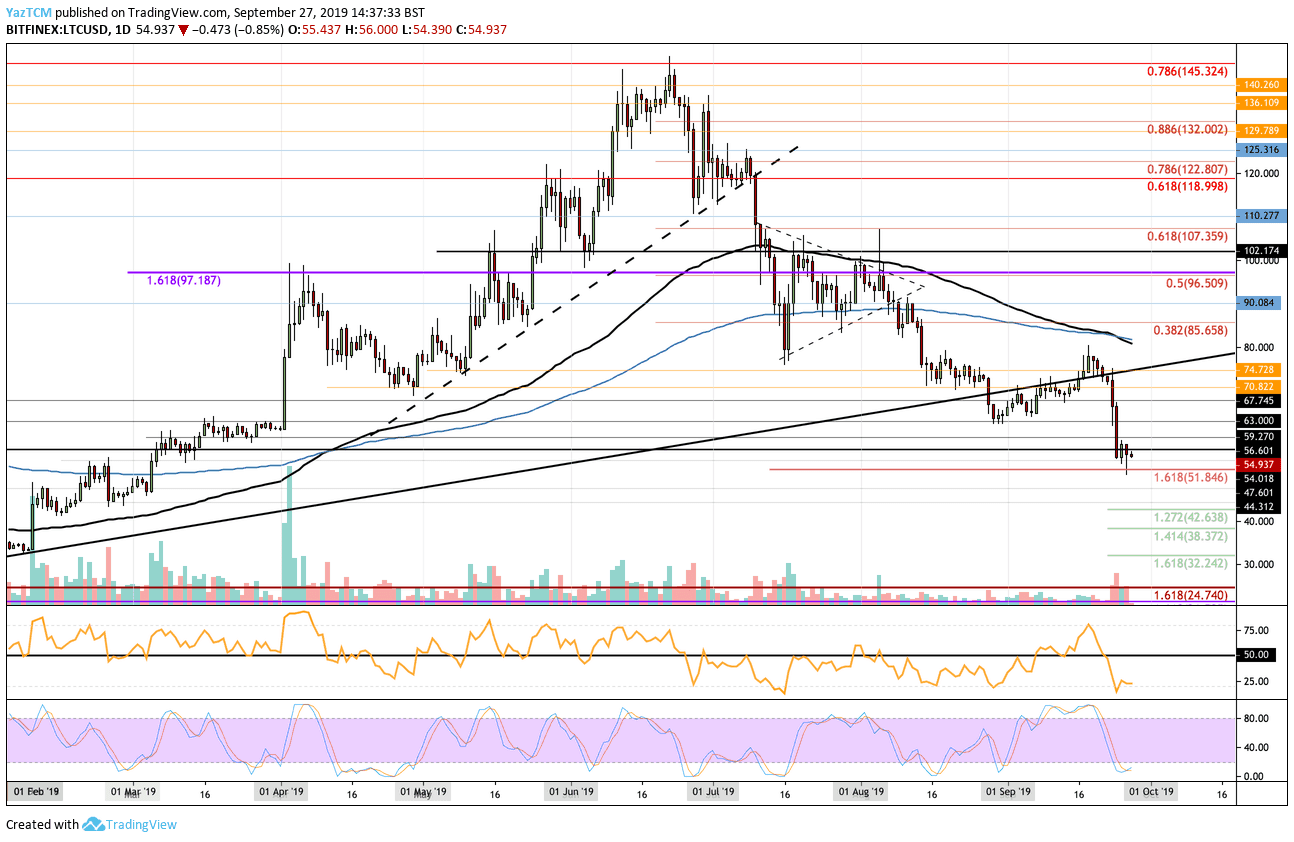
Looking at the LTC/USD 1-Day Chart:
- Since our previous Litecoin analysis, LTC has plummetted pretty aggressively against the USD. The cryptocurrency fell to as low as $50 before rebounding higher. Litecoin is now trading at support provided at the $55 level.
- From above: If the bulls break $55, resistance lies at $56.60, $59.27, $60, $63, and $70.82. Above $74.82, higher resistance lies at $80 (100-days EMA and 200-days EMA), $85.65 (bearish .382 FIbonacci Retracement), and $90.
- From below: The nearest level of support lies at $54. Beneath this, support is located at $51.84, $50, $47.60, and $45. If LTC drops beneath $45, we can expect support at $42.63 (downside 1.272 Fib Extension, $40, and $38.72 (downside 1.414 Fib Extension).
- The trading volume has increased during the last few days of aggressive selling.
- The RSI has plummetted to overbought conditions which shows the sellers are in complete control over the market momentum. However, the Stochastic RSI has produced a bullish crossover signal which shows a potential rebound higher might be on the table.
- An interesting bearish signal to notice is the 100-days EMA crossing below the 200-days EMA – known as a death cross. This could signal a longer-term bearish trend shift.
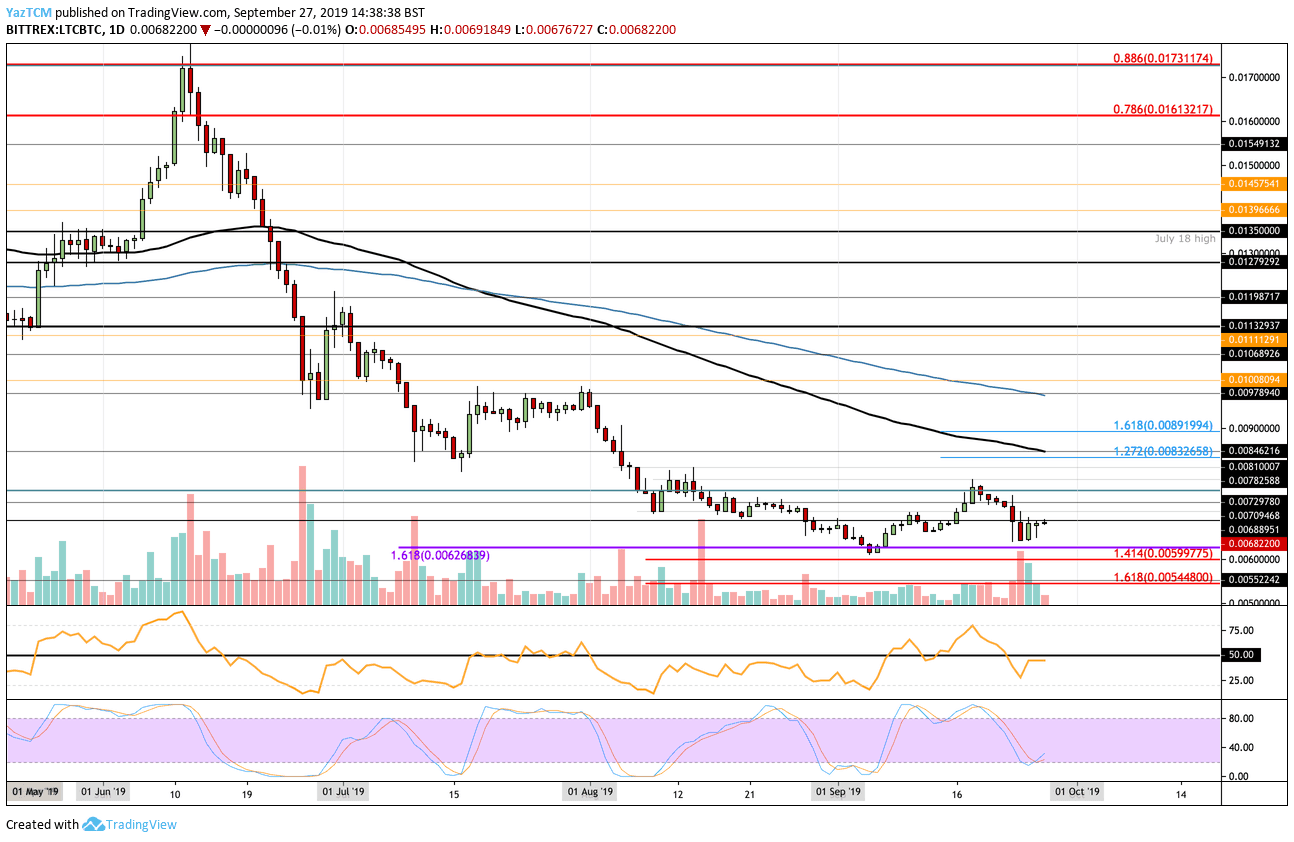
Looking at the LTC/BTC 1-Day Chart:
- Against Bitcoin, Litecoin has remained fairly stagnant as it continues to trade sideways through the turmoil. LTC is currently trading at resistance provided by 0.006889 BTC.
- From above: The nearest level of resistance lies at 0.007 BTC. above this, higher resistance is found at 0.007297 BTC, 0.0076 BTC, and 0.00782 BTC. A break above 0.00782 would turn the market bullish. Above this, resistance lies at 0.0080 BTC, 0.0081 BTC, and 0.008236 BTC.
- From below: The nearest level of support lies at 0.0065 BTC and 0.0063 BTC. Beneath this, support lies at 0.00625 BTC, 0.0060 BTC (downside 1.414 Fib Extension), and 0.00544 BTC (downside 1.618 Fib Extension).
- The trading volume remains low but has increased during the selling phase.
- The RSI is currently battling the 50 level which shows indecision within the market. For LTCBTC to rise, we will need to see the RSI breaking above 50 to show that the bulls have control over the market momentum.
SPECIAL OFFER (Sponsored)
LIMITED OFFER 2024 for CryptoPotato readers at Bybit: Use this link to register and open a $500 BTC-USDT position on Bybit Exchange for free!
Disclaimer: Information found on CryptoPotato is those of writers quoted. It does not represent the opinions of CryptoPotato on whether to buy, sell, or hold any investments. You are advised to conduct your own research before making any investment decisions. Use provided information at your own risk. See Disclaimer for more information.
Cryptocurrency charts by TradingView.