Litecoin has stalled slightly at the $140 level over the past couple of days marking a slight increase of 0.14% in the past 24 hours. The cryptocurrency surged 17% over the past week which brought it up to the $140 resistance level.
Litecion is currently the 4th largest cryptocurrency, sitting on a market cap of about $8.45 billion. Litecoin saw on an epic run as traders load up on the coin in anticipation for the scheduled block halving in about 50 days. The cryptocurrency increased by 122% over the past 3 months as people start to increase their holdings.
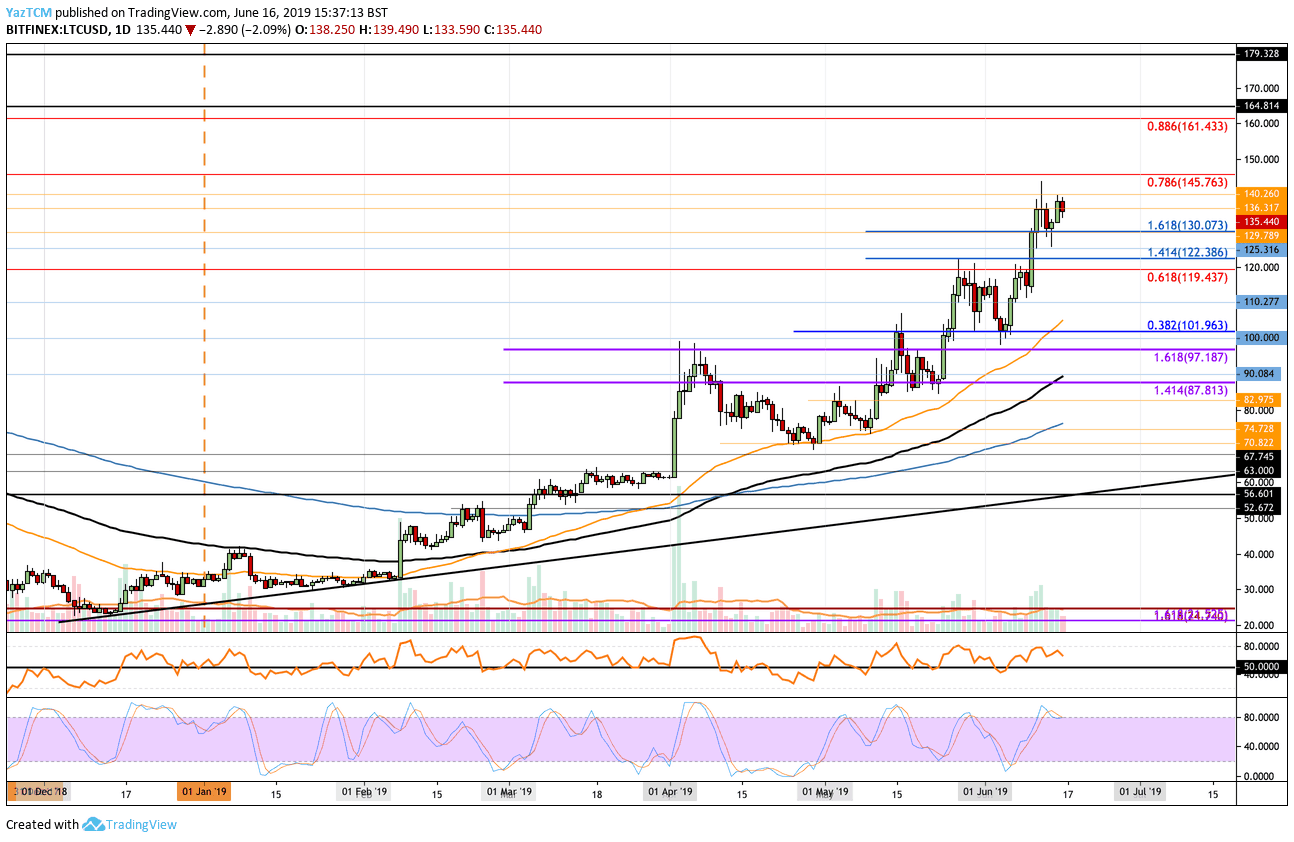
Looking at the LTC/USD 1-Day Chart:
- Since our previous Litecoin analysis, we can see that Litecoin couldn’t surge past the $140 level and had dropped into support at the $130 level. LTCUSD went on to rebound from here but has still struggled to make any movement above the $140 resistance.
- From above: The nearest level of resistance above $140 lies at $145.76 which contains a long term bearish .786 Fibonacci Retracement level. Above this, higher resistance lies at $150, $155 and $161 – where lies the bearish .886 Fib Retracement. Above this, resistance is found at $170, $180, and $185.
- From below: The nearest level of support now lies at $130. Beneath this, further support is located at $122, $119, $110 and $100. Beneath $100, support is found at $97.18, $90 and $87.81.
- The trading volume has continued to remain consistently high.
- The Stochastic RSI has recently reached overbought conditions and has produced a bearish crossover signal which suggests that the market may be ready to retrace briefly.
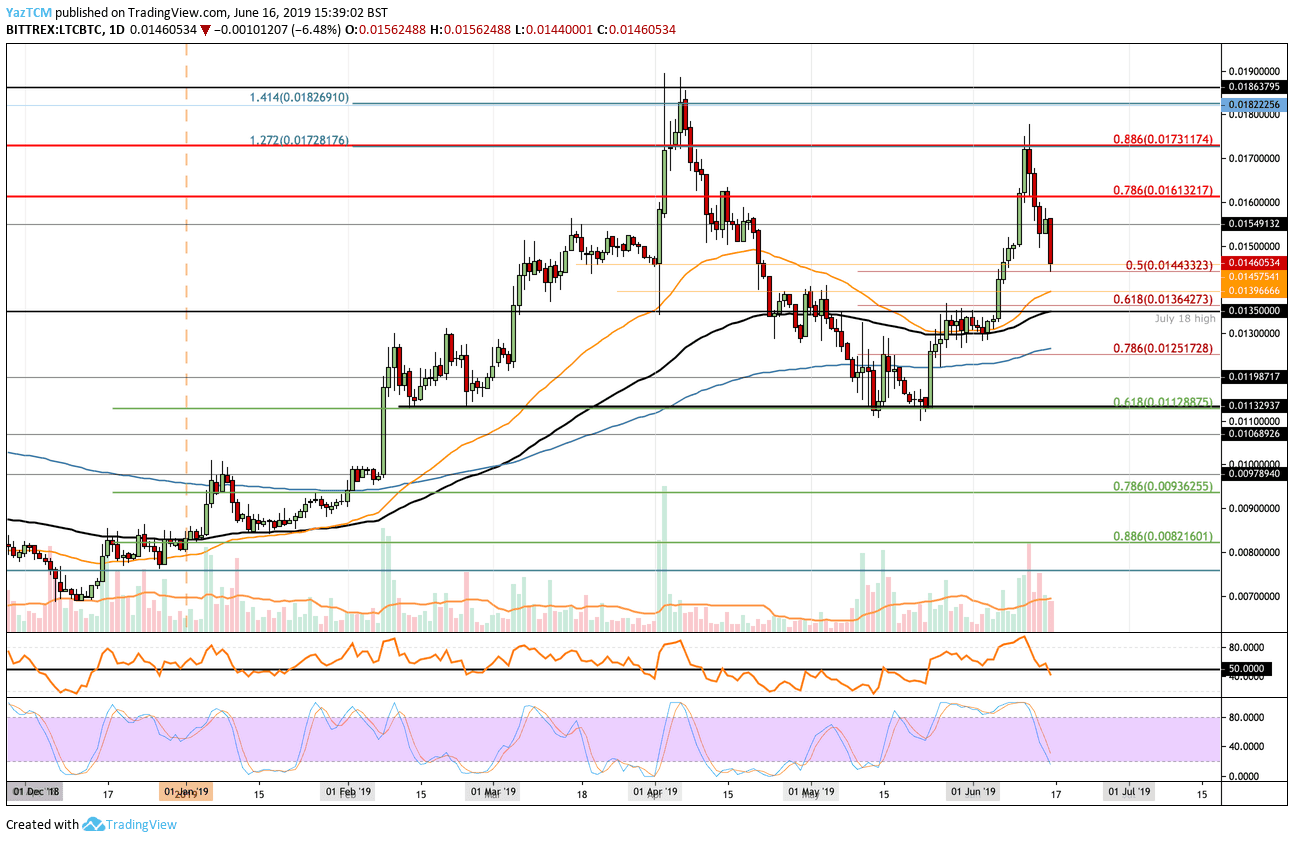
Looking at the LTC/BTC 1-Day Chart:
- Against Bitcoin, we can see that LTC has fallen from the 0.01731 BTC resistance level and has found support around the 0.01443 BTC level – where lies the short term .5 Fib Retracement.
- From above: The nearest level of resistance now lies at 0.015 BTC. Above this, higher resistance lies at 0.0155 BTC, 0.016 BTC, 0.0165 BTC, and 0.01730 BTC. If the bulls can break above 0.017 BTC, further resistance is found at 0.018 BTC, 0.01860 BTC, and 0.019 BTC.
- From below: The nearest level of support lies at 0.0144 BTC. Beneath this, further support lies at 0.014 BTC, 0.013643 BTC, and 0.0135 BTC. If the selling continues beneath 0.0135 BTC, further support lies at 0.013 BTC and 0.0125 BTC.
- The trading volume has been very high since reversing from the 0.017 BTC resistance level.
- The Stochastic RSI has recently dropped from overbought conditions and is now approaching oversold conditions which may suggest the recent pullback is ready to stop.
SPECIAL OFFER (Sponsored)
LIMITED OFFER 2024 for CryptoPotato readers at Bybit: Use this link to register and open a $500 BTC-USDT position on Bybit Exchange for free!
Disclaimer: Information found on CryptoPotato is those of writers quoted. It does not represent the opinions of CryptoPotato on whether to buy, sell, or hold any investments. You are advised to conduct your own research before making any investment decisions. Use provided information at your own risk. See Disclaimer for more information.
Cryptocurrency charts by TradingView.