Litecoin has seen a sharp decrease of 22% over the past 14 days. We saw it drop beneath a consolidation pattern and plummet much lower to its current price of $74.10.
LTC remains the fifth-largest cryptocurrency by market value with a market cap of $4.87 billion. However, this may change if Litecoin continues to fall, with Binance Coin sitting just $410 million behind in the sixth position.
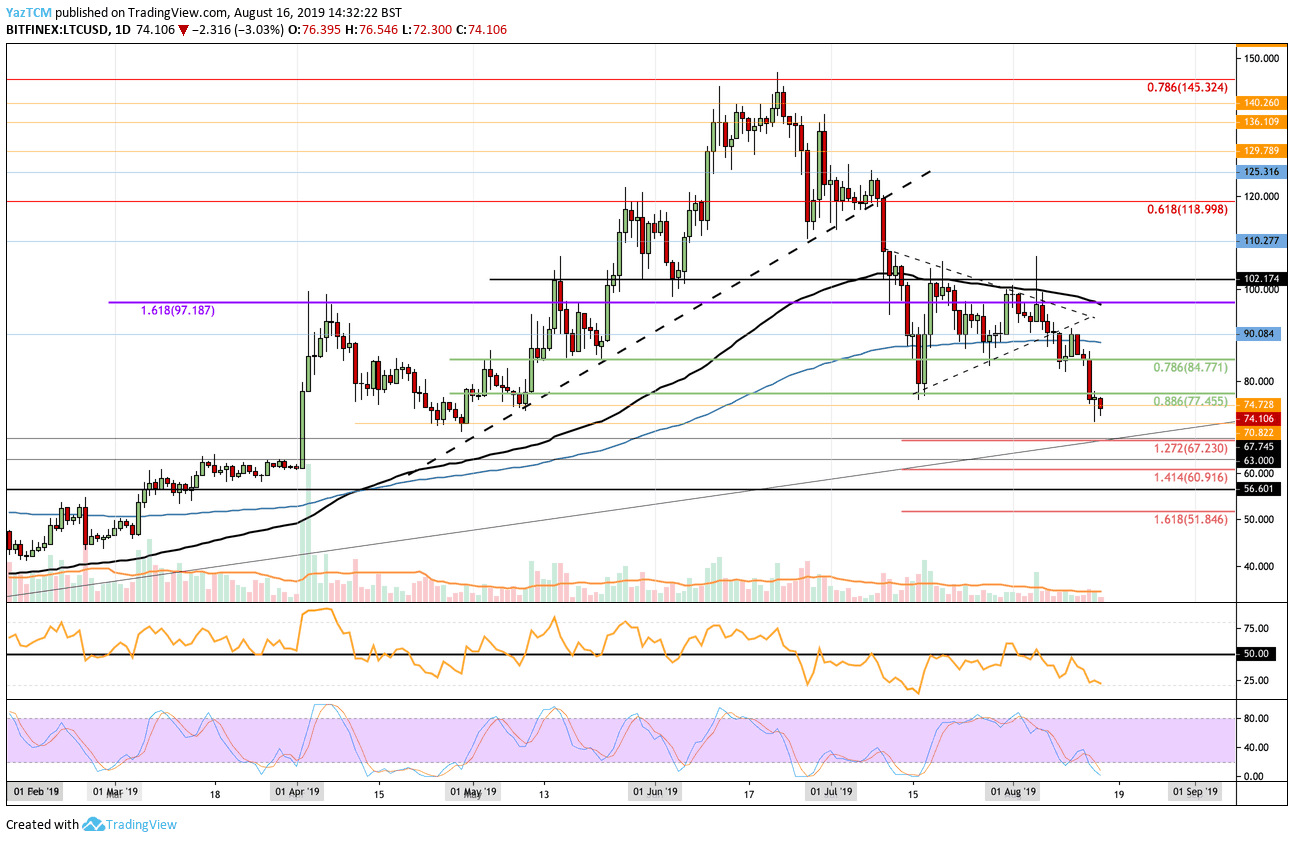
Looking at the LTC/USD 1-day chart:
- Since our previous Litecoin analysis, the cryptocurrency’s price has continued to fall after breaking beneath the short-term symmetrical triangle. It went on to fall below the support at $84 and $77 all the way to $70.82. Litecoin has since rebounded somewhat and currently trades around $74.10.
- From above: The nearest levels of resistance are $75 and $77.45. Above this, higher resistance can be found at $80, $84.77, and $90 (which contains the 200-day EMA). If the bulls continue above the 200-day EMA, they will meet resistance at $97 (the 100-day EMA) and $100.
- From below: The nearest level of support lies at $70.82. This is followed by further support at the long-term rising trend line around $67. This level is strengthened by the downside 1272 Fibonacci Extension and is therefore expected to hold. Beneath this, further support can be found at $65, $63 and $60.91.
- The trading volume remains quite low.
- The RSI and Stochastic RSI are both in oversold territory as the bears continue to dominate.
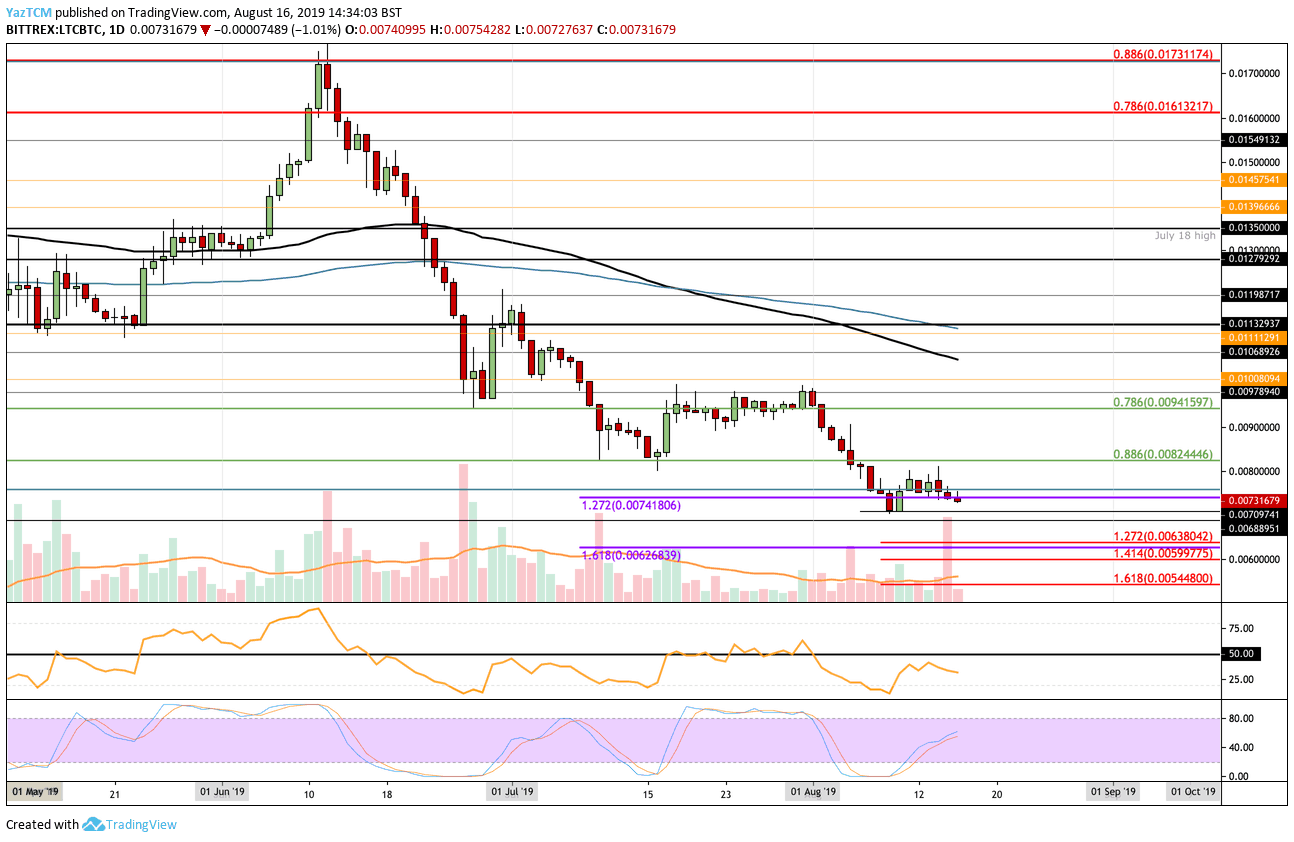
Looking at the LTC/BTC 1-day chart:
- The LTC/BTC market has stabilized somewhat. Litecoin found support at 0.00709 BTC before rebounding. However, the bulls were unable to overcome 0.008 BTC and LTC currently trades at 0.007316 BTC.
- From above: The nearest level of resistance lies at 0.008 BTC. Above this, there is resistance at 0.008244 BTC, 0.0085 BTC, 0.009 BTC, and 0.0094 BTC. If the bulls push the price higher, further resistance is found at 0.0097 BTC and 0.01 BTC.
- From below: The nearest level of support lies at 0.00707 BTC. If the price breaks beneath 0.007 BTC, we can expect further support at 0.00688 BTC, 0.0065 BTC, and 0.006380 BTC.
- The trading volume remains below average but has shown signs of increasing.
- The RSI remains below 50, which shows that the bears are still in control.
SPECIAL OFFER (Sponsored)
Binance Free $600 (CryptoPotato Exclusive): Use this link to register new account and receive $600 exclusive welcome offer on Binance (
full details).
LIMITED OFFER 2024 for CryptoPotato readers at Bybit: Use this link to register and open a $500 BTC-USDT position on Bybit Exchange for free!
Disclaimer: Information found on CryptoPotato is those of writers quoted. It does not represent the opinions of CryptoPotato on whether to buy, sell, or hold any investments. You are advised to conduct your own research before making any investment decisions. Use provided information at your own risk. See Disclaimer for more information.
Cryptocurrency charts by TradingView.