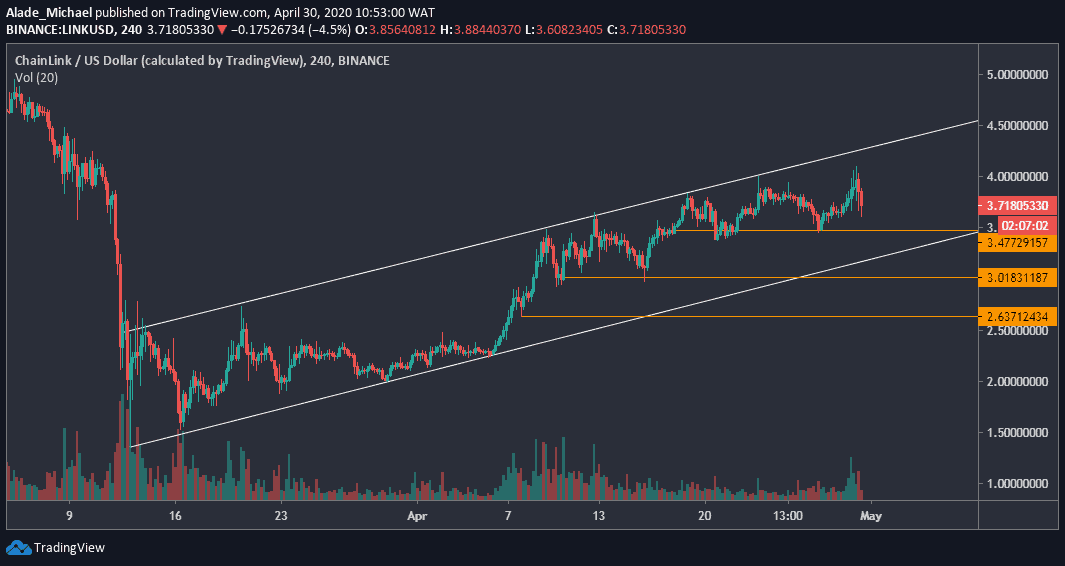
Key Resistance Levels: $4, $4.5, $4.98
Key Support Levels: $3.47, $3, $2.63
With a small 5% increase, Chainlink’s price hits $4.1 today following a massive 20% increase in Bitcoin’s price overnight. This latest decisive rally indicates that the bulls are back in the crypto space.
Chainlink’s bullish pattern – higher high and higher low – has been quite slow for a while. This is due to its low trading volume and volatility since April 9, revealing a weak bullish action.
Nonetheless, Link continued to respect the short-term ascending channel since March. A bearish case might be considered if Chainlink drops off this channel.
Link recently dropped from $4.1, and it’s now changing hands around $3.71 against the US Dollars. More gain is likely if the bulls continue to show interest in the market.
If Link pushes back to retake the $4 level, the price is likely to target $4.5 in the coming days. The bulls may even reclaim the current yearly high of $4.98 if buying volume increases.
As can be seen on the 4-hours chart, Link is trying to keep the bullish trend around the channel’s upper boundary. If the price drops, Chainlink is expected to find a rebound around the channel’s support at $3.47
It could fall straight to $3 and perhaps $2.63 support if the price drops off the 7-week channel.
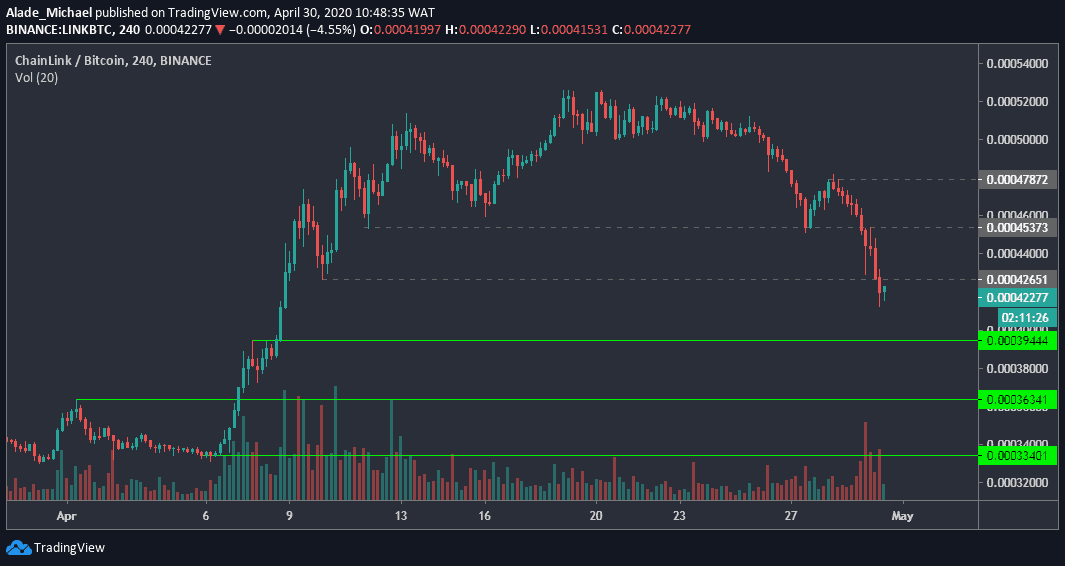
Key Resistance Levels: 42651 SAT, 45373 SAT, 47872 SAT
Key Support Levels: 39444 SAT, 36341 SAT, 33401 SAT
After rallying to a monthly high at 52500 SAT mark, Chainlink consolidated and changed the trend with a 22% drop in 10 days. The price is currently trading around 41900 SAT after breaking down 50000 SAT as predicted in our previous analysis.
Link is down by 10.9% today as bears continue to show commitment. After leaving many supports, Link is now charging towards a psychological level at 40000 SAT.
Once this level provides a rebound, Chainlink is expected to retrace back to previous support-turned-resistance levels – the dotted-grey lines on the 4-hours chart before resuming selling pressure.
If the 40000 SAT level stands well against the supply force, however, Chainlink could start another bullish cycle from this key point. If not, Link would keep dropping until it finds strong support.
From a technical standpoint, the major support to keep an eye on is the immediate green level of 39444 SAT. If the level fails to suppress bearish action, Chainlink could dip further to 36341 SAT level, followed by 33401 SAT – currently the last defense line for the bulls.
In case of a retracement, the first level here is 42651 SAT, which got broken a few hours ago. The second level to watch is 45373 SAT resistance along with 47872 SAT, marked grey in the above chart.
Chainlink could regain strength if the price recovers above this mentioned resistance levels. The appearance of the market structure currently suggests that the bears are taking over the LINK/BTC market.