Key Resistance Levels: $4.9, $5.5, $6
Key Support Levels: $4.3, $3.5, $3
After a full recovery from March collapse, Chainlink paused and consolidated for almost five weeks due to low trading volatility. But now, it is beginning to show strength again after rising by 7% over the past hours.
Owing to the fact that Bitcoin is struggling around $9500 for days now, Link just found a break above its key holding resistance level at $4.3. The breakout still appears shaky but more gains could be expected if the daily candle closes above this line.
Apart from the green-marked demand area, Chainlink has further built dynamic support around the lower boundary of the channel, which suggests that volatility may increase anytime from now. It is currently changing hands at around $4.4 against the US Dollar.
Following the current breakout, Chainlink’s next targets would be $4.9 and $5, marked orange on the price chart. Once the price surpasses these levels, a new yearly high may come around $5.5 and $6.
As of now, the recent break level of $4.3 is acting as temporary support for Link. If it breaks, the price may drop slightly to $4. A fall below the channel may initiate selloff to $3.5 – the green demand area. The next after that is $3.
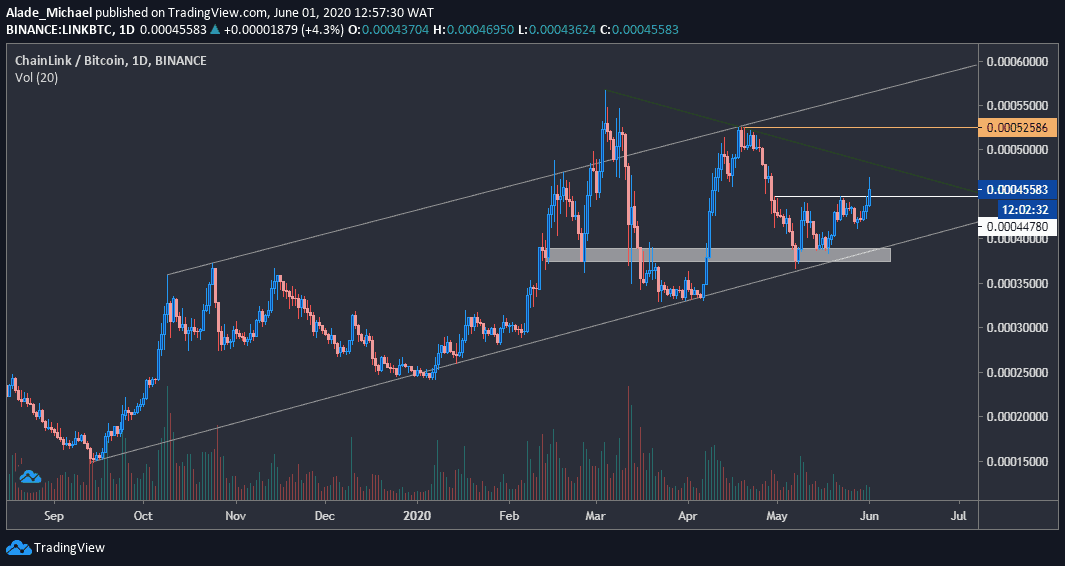
Key Resistance Levels: 48000 SAT, 52500 SAT, 56000 SAT
Key Support Levels: 44780 SAT, 41220 SAT, 37566 SAT
Chainlink finally surpassed the key 45000 SAT resistance-turned-support that capped bullish actions since it rebounded from a long-term channel’s support in early May. However, the recent increase was plotted from the 41220 SAT level – now holding as daily support.
While trading around 45583 SAT, Link is likely to encounter a small resistance at the green descending trend line mentioned in our previous analysis.
A successful climb above that would confirm a continuation to the upper boundary of the channel, where a retracement is likely to take place. But if this trend line rejects price again, Link may retrace earlier than expected.
There’s minor resistance around the green descending line – 48000 SAT, but the key level to watch here is the 52500 SAT level, followed by the current yearly high of 56000 SAT. 60000 SAT would be next if this mentioned high is breached.
The cryptocurrency is currently relying on the white horizontal line of 44780 SAT level. The major support to keep an eye on is 41220 SAT (last week’s support) in case of a drop. Below this support lies at the white demand zone of 37566 SAT, around the channel’s lower boundary.