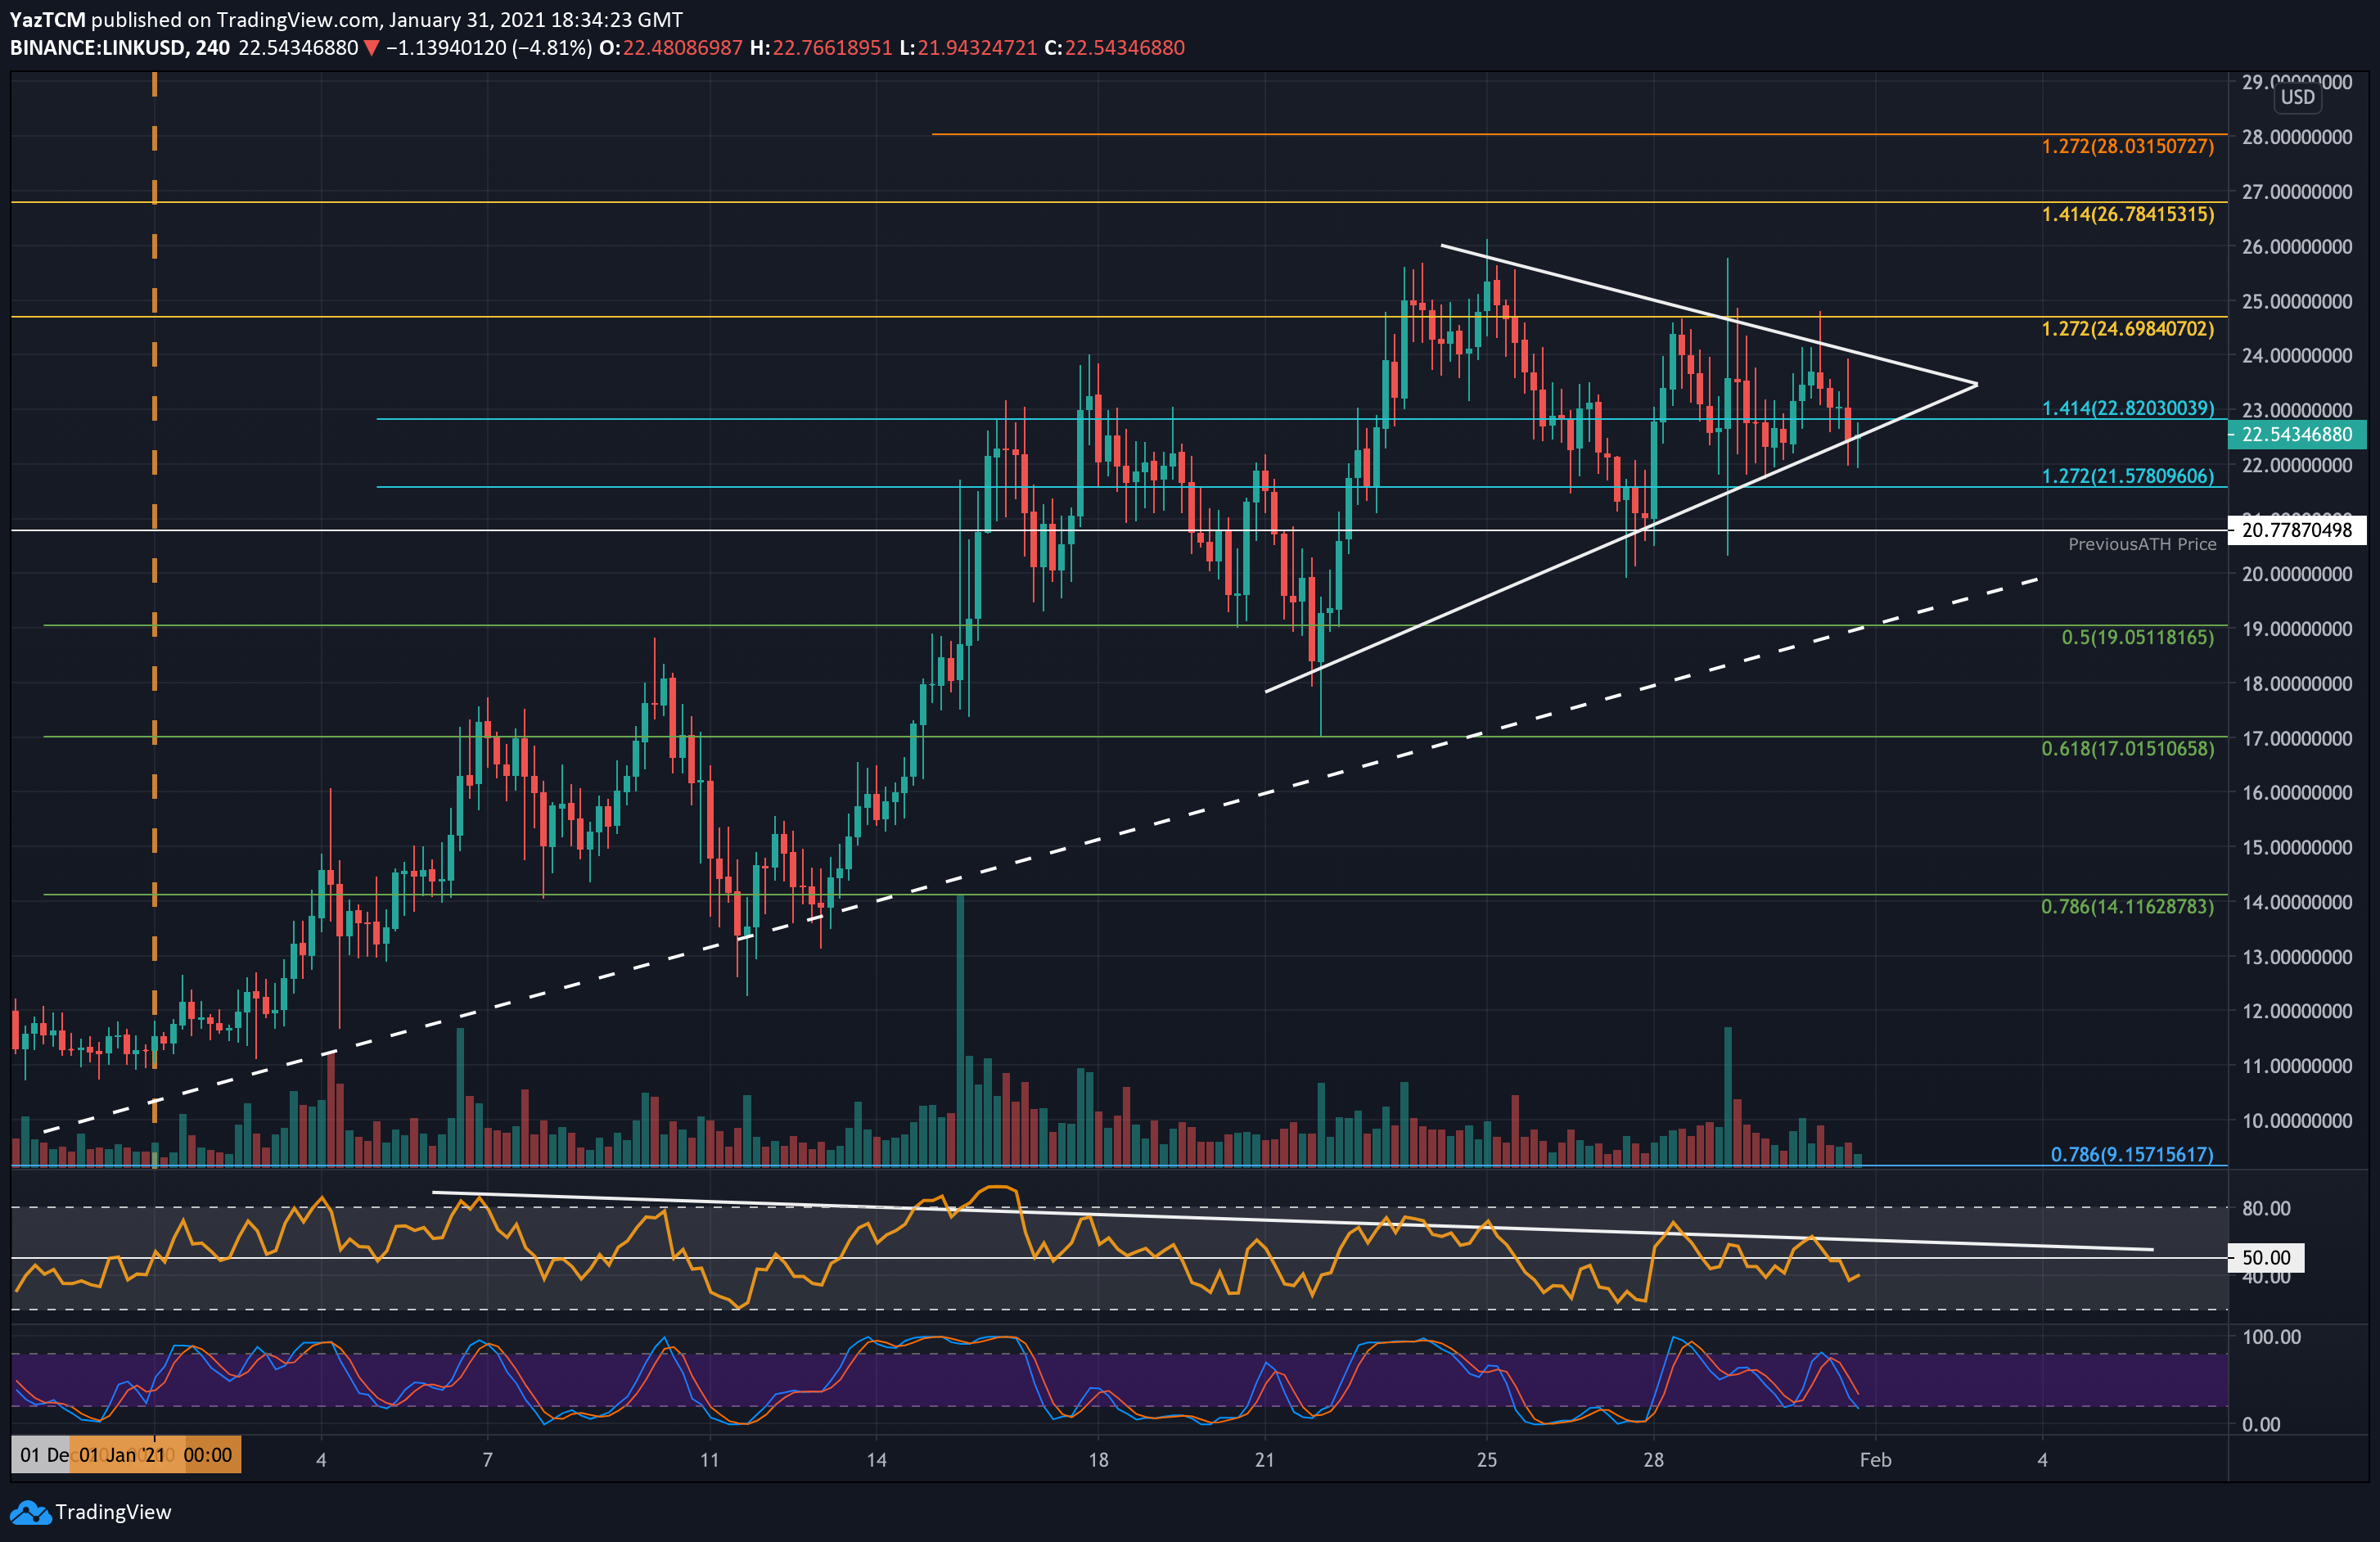
LINK/USD 4-Hour Chart. Source: TradingView
Key Support Levels: $22.4, $22, $20.77.
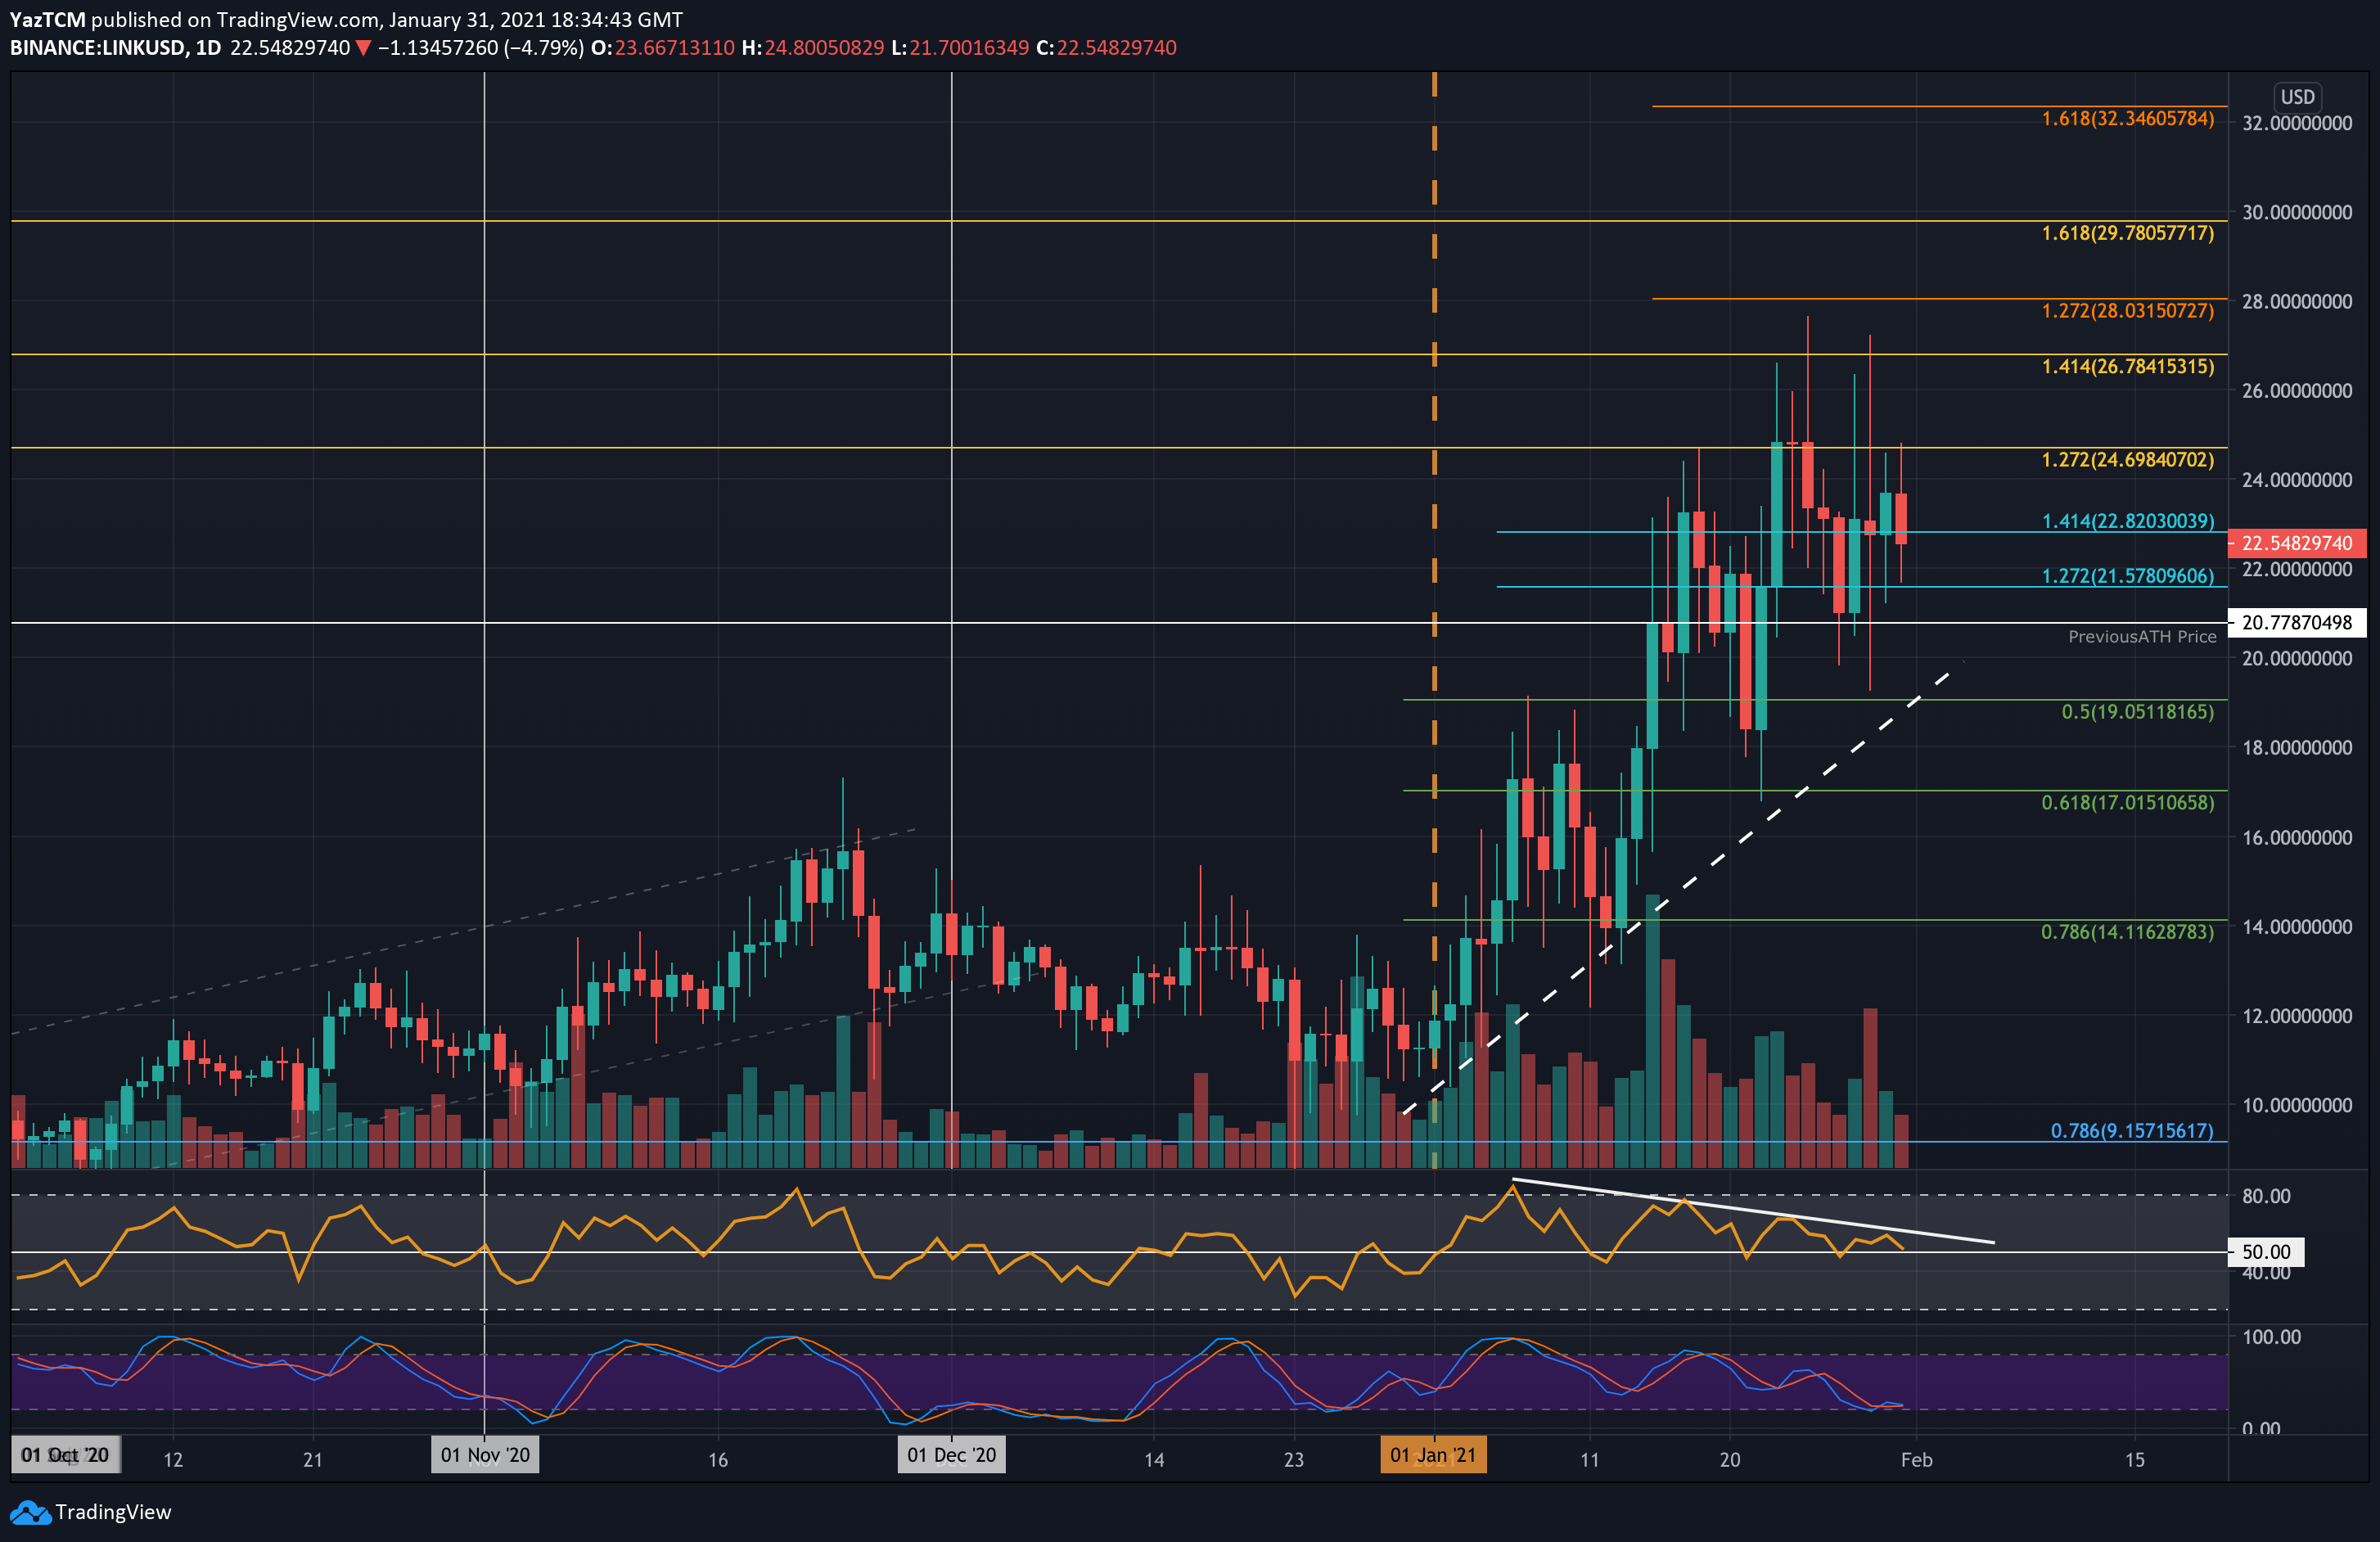
Key Resistance Levels: $24, $24.70, $25.65.
LINK started the past week following a strong bullish momentum as it surged to a new ATH price of $25.65 on Monday. However, it failed to close a daily candle above resistance at $24.85 and started to head lower from there.
By Wednesday, LINK had dropped into the support at $20.77, the previous ATH Price. It rebounded from there and spiked back above $26 but could not close a daily candle above $23.70 as of yesterday. It had since dropped slightly towards $22, where it trades as of writing these lines.
Looking at the 4-hour chart, LINK is trapped within a short term symmetrical triangle pattern. The next direction is likely to take place upon breakout. In case of a bullish breakout, the first target is likely to be the current ATH.
Looking ahead, the first level of resistance lies at the upper boundary of the short term symmetrical triangle, at around $24. This is followed by $24.70 (1.272 Fib Extension), $25.65 (ATH), $26, $26.67 (1.414 Fib Extension).
On the other side, the first support lies at the lower boundary of the triangle, around $22.40. This is followed by $22, $20.77 (previous ATH), $20, and $19.05 (.5 Fib).
The daily RSI revealed some signs of bearish divergence, which might be playing out right now. This would result in the breakout of the triangle toward the downside if true.
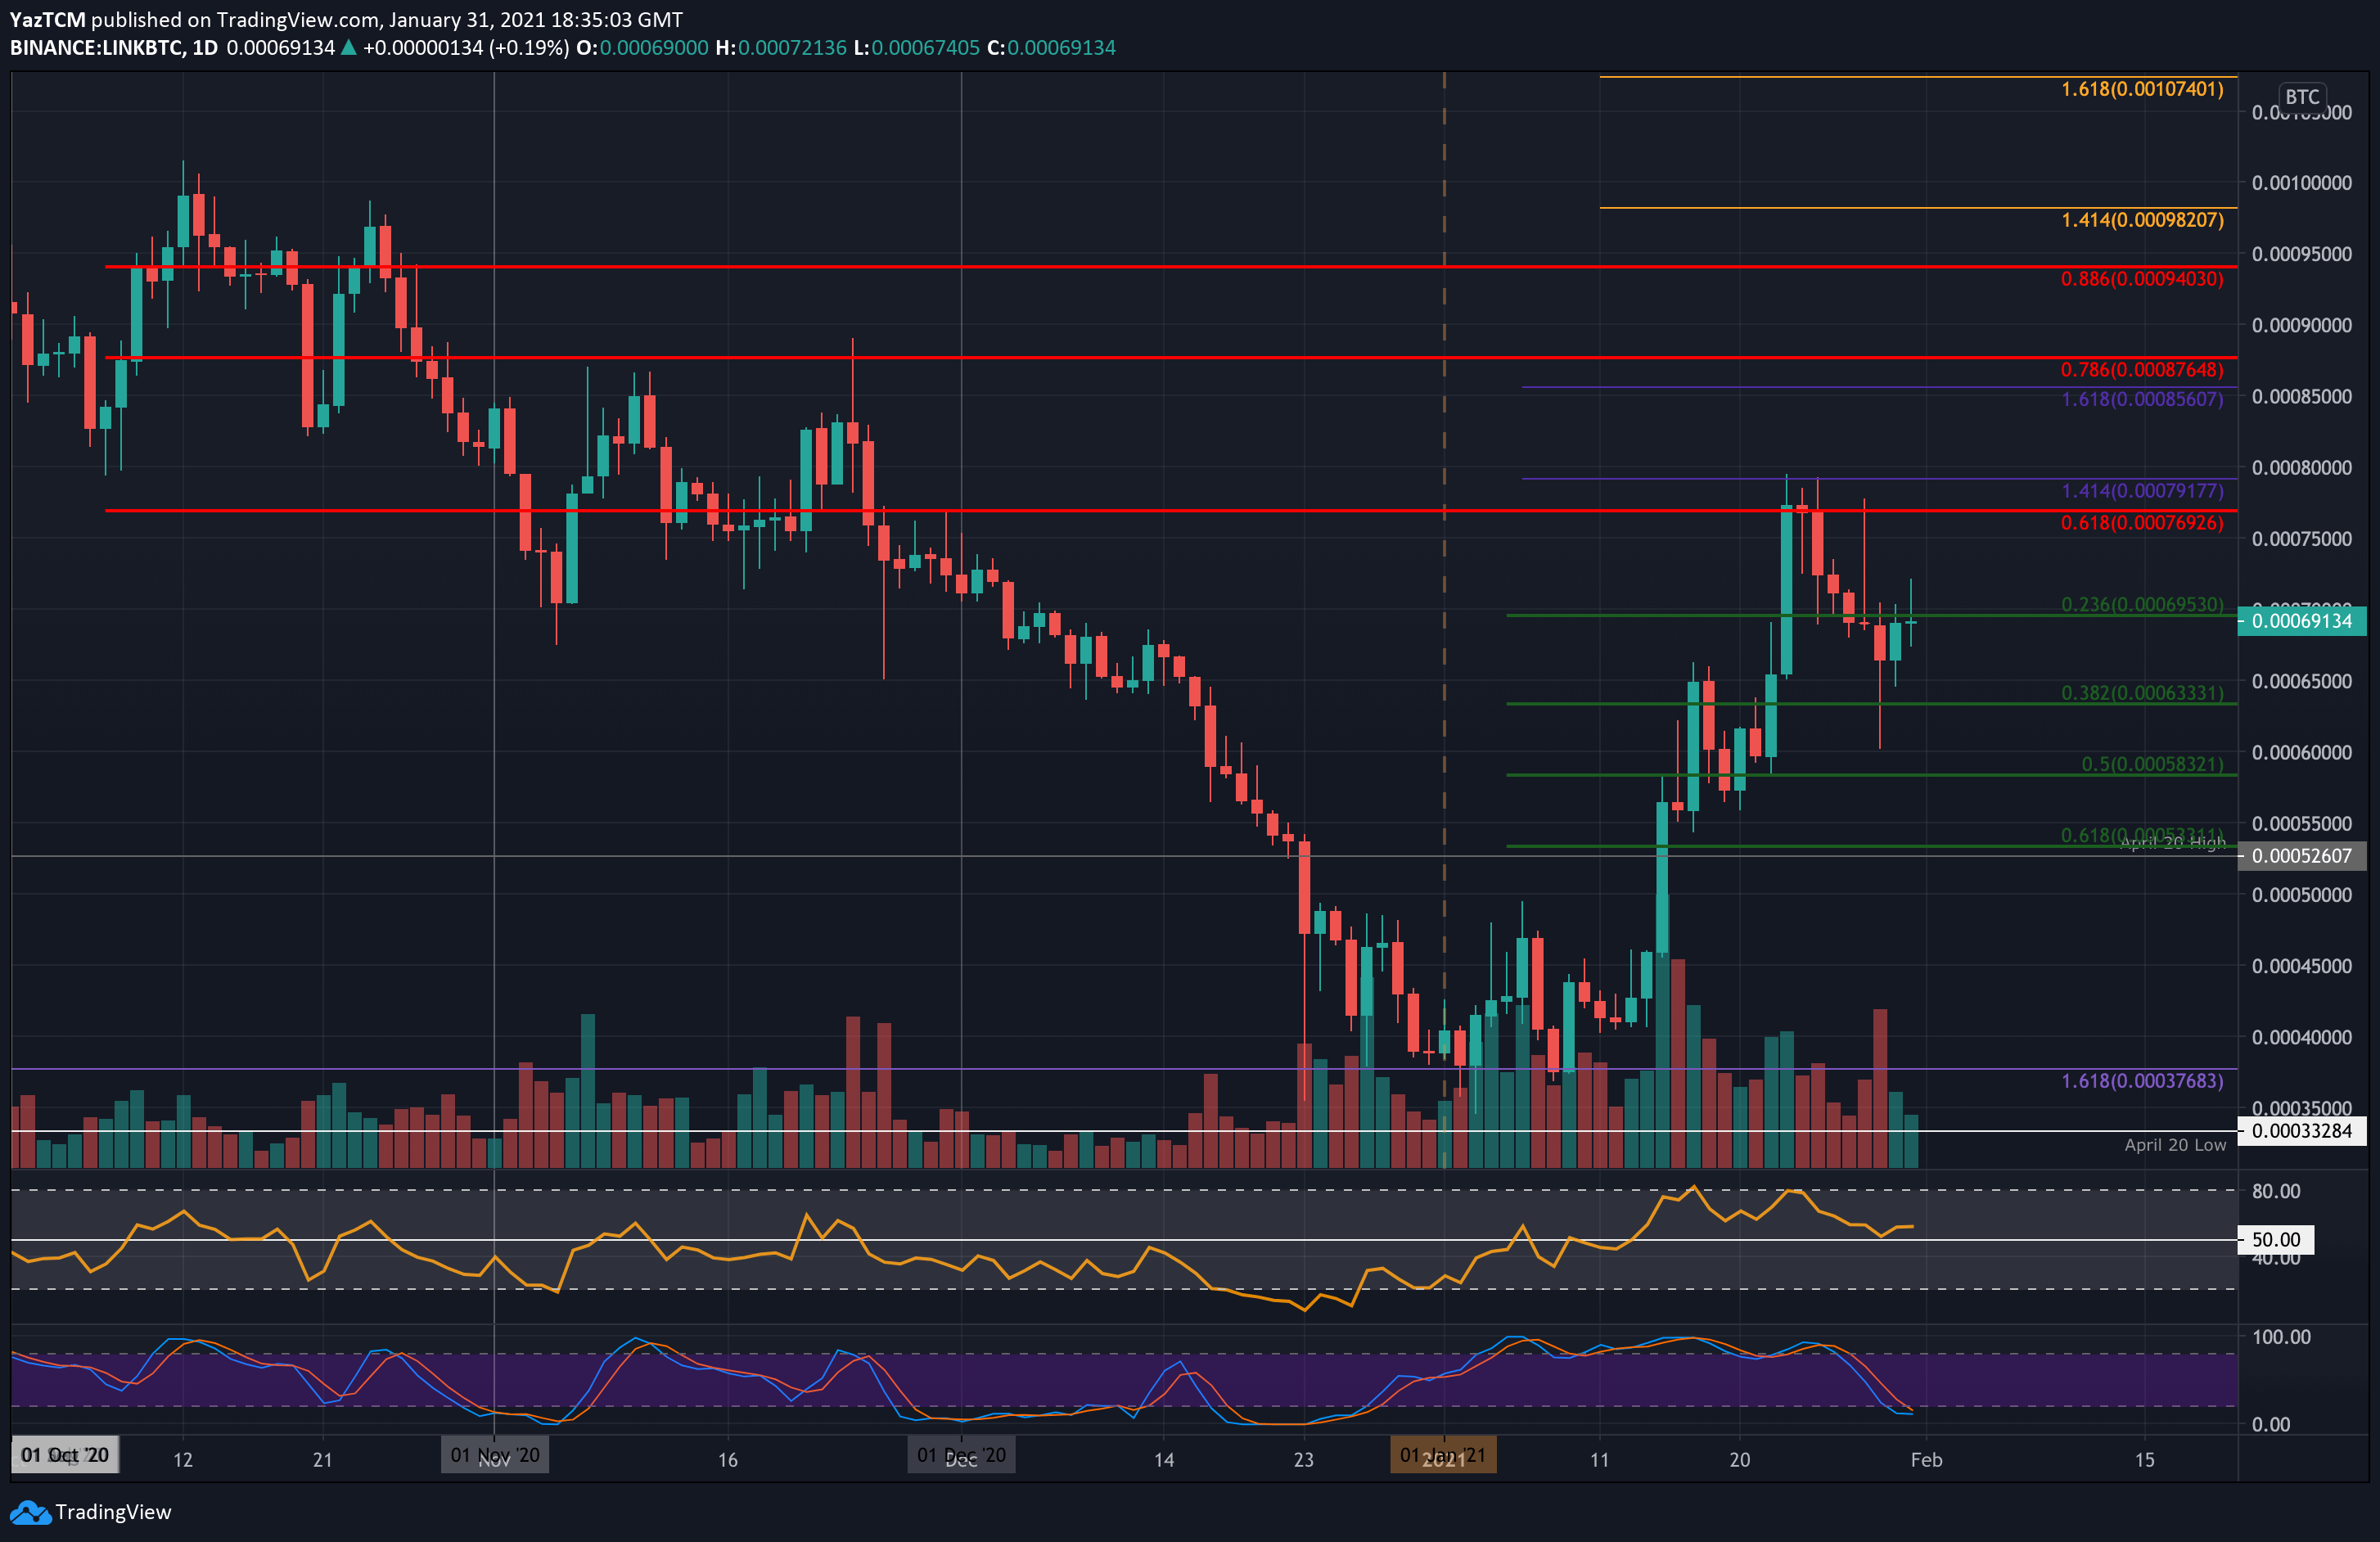
Key Support Levels: 0.000664 BTC, 0.000633 BtC, 0.0006 BTC.
Key Resistance Levels: 0.0007 BTC, 0.000769 BTC, 0.000791 BTC.
Against Bitcoin, LINK had surged higher last week to reach the resistance at 0.000791 BTC (1.414 Fib Extension) last Saturday. It could not overcome this resistance after making another attempt on Monday and started to head lower throughout the past week.
Initially, LINK found support at 0.000695 BTC (.236 Fib) but dropped beneath this level on Friday, reaching as low as 0.0006 BTC. It has since rebounded from this support and is trading at 0.0007 BTC as of now.
The first level of resistance lies at 0.0007 BTC. This is followed by 0.000769 BTC (bearish .618 Fib), 0.000791 BTC (1.414 Fib Extension), and 0.0008 BTC.
On the other side, the first support lies at 0.000664 BTC (yesterday’s closing price). This is followed by 0.000633 BTC (.382 Fib), 0.0006 BTC, and 0.000583 BTC (.5 Fib).
The RSI had also provided a bearish divergence signal at the start of the week, which resulted in LINK rolling over. The RSI is now at the midline, indicating indecision within the market.