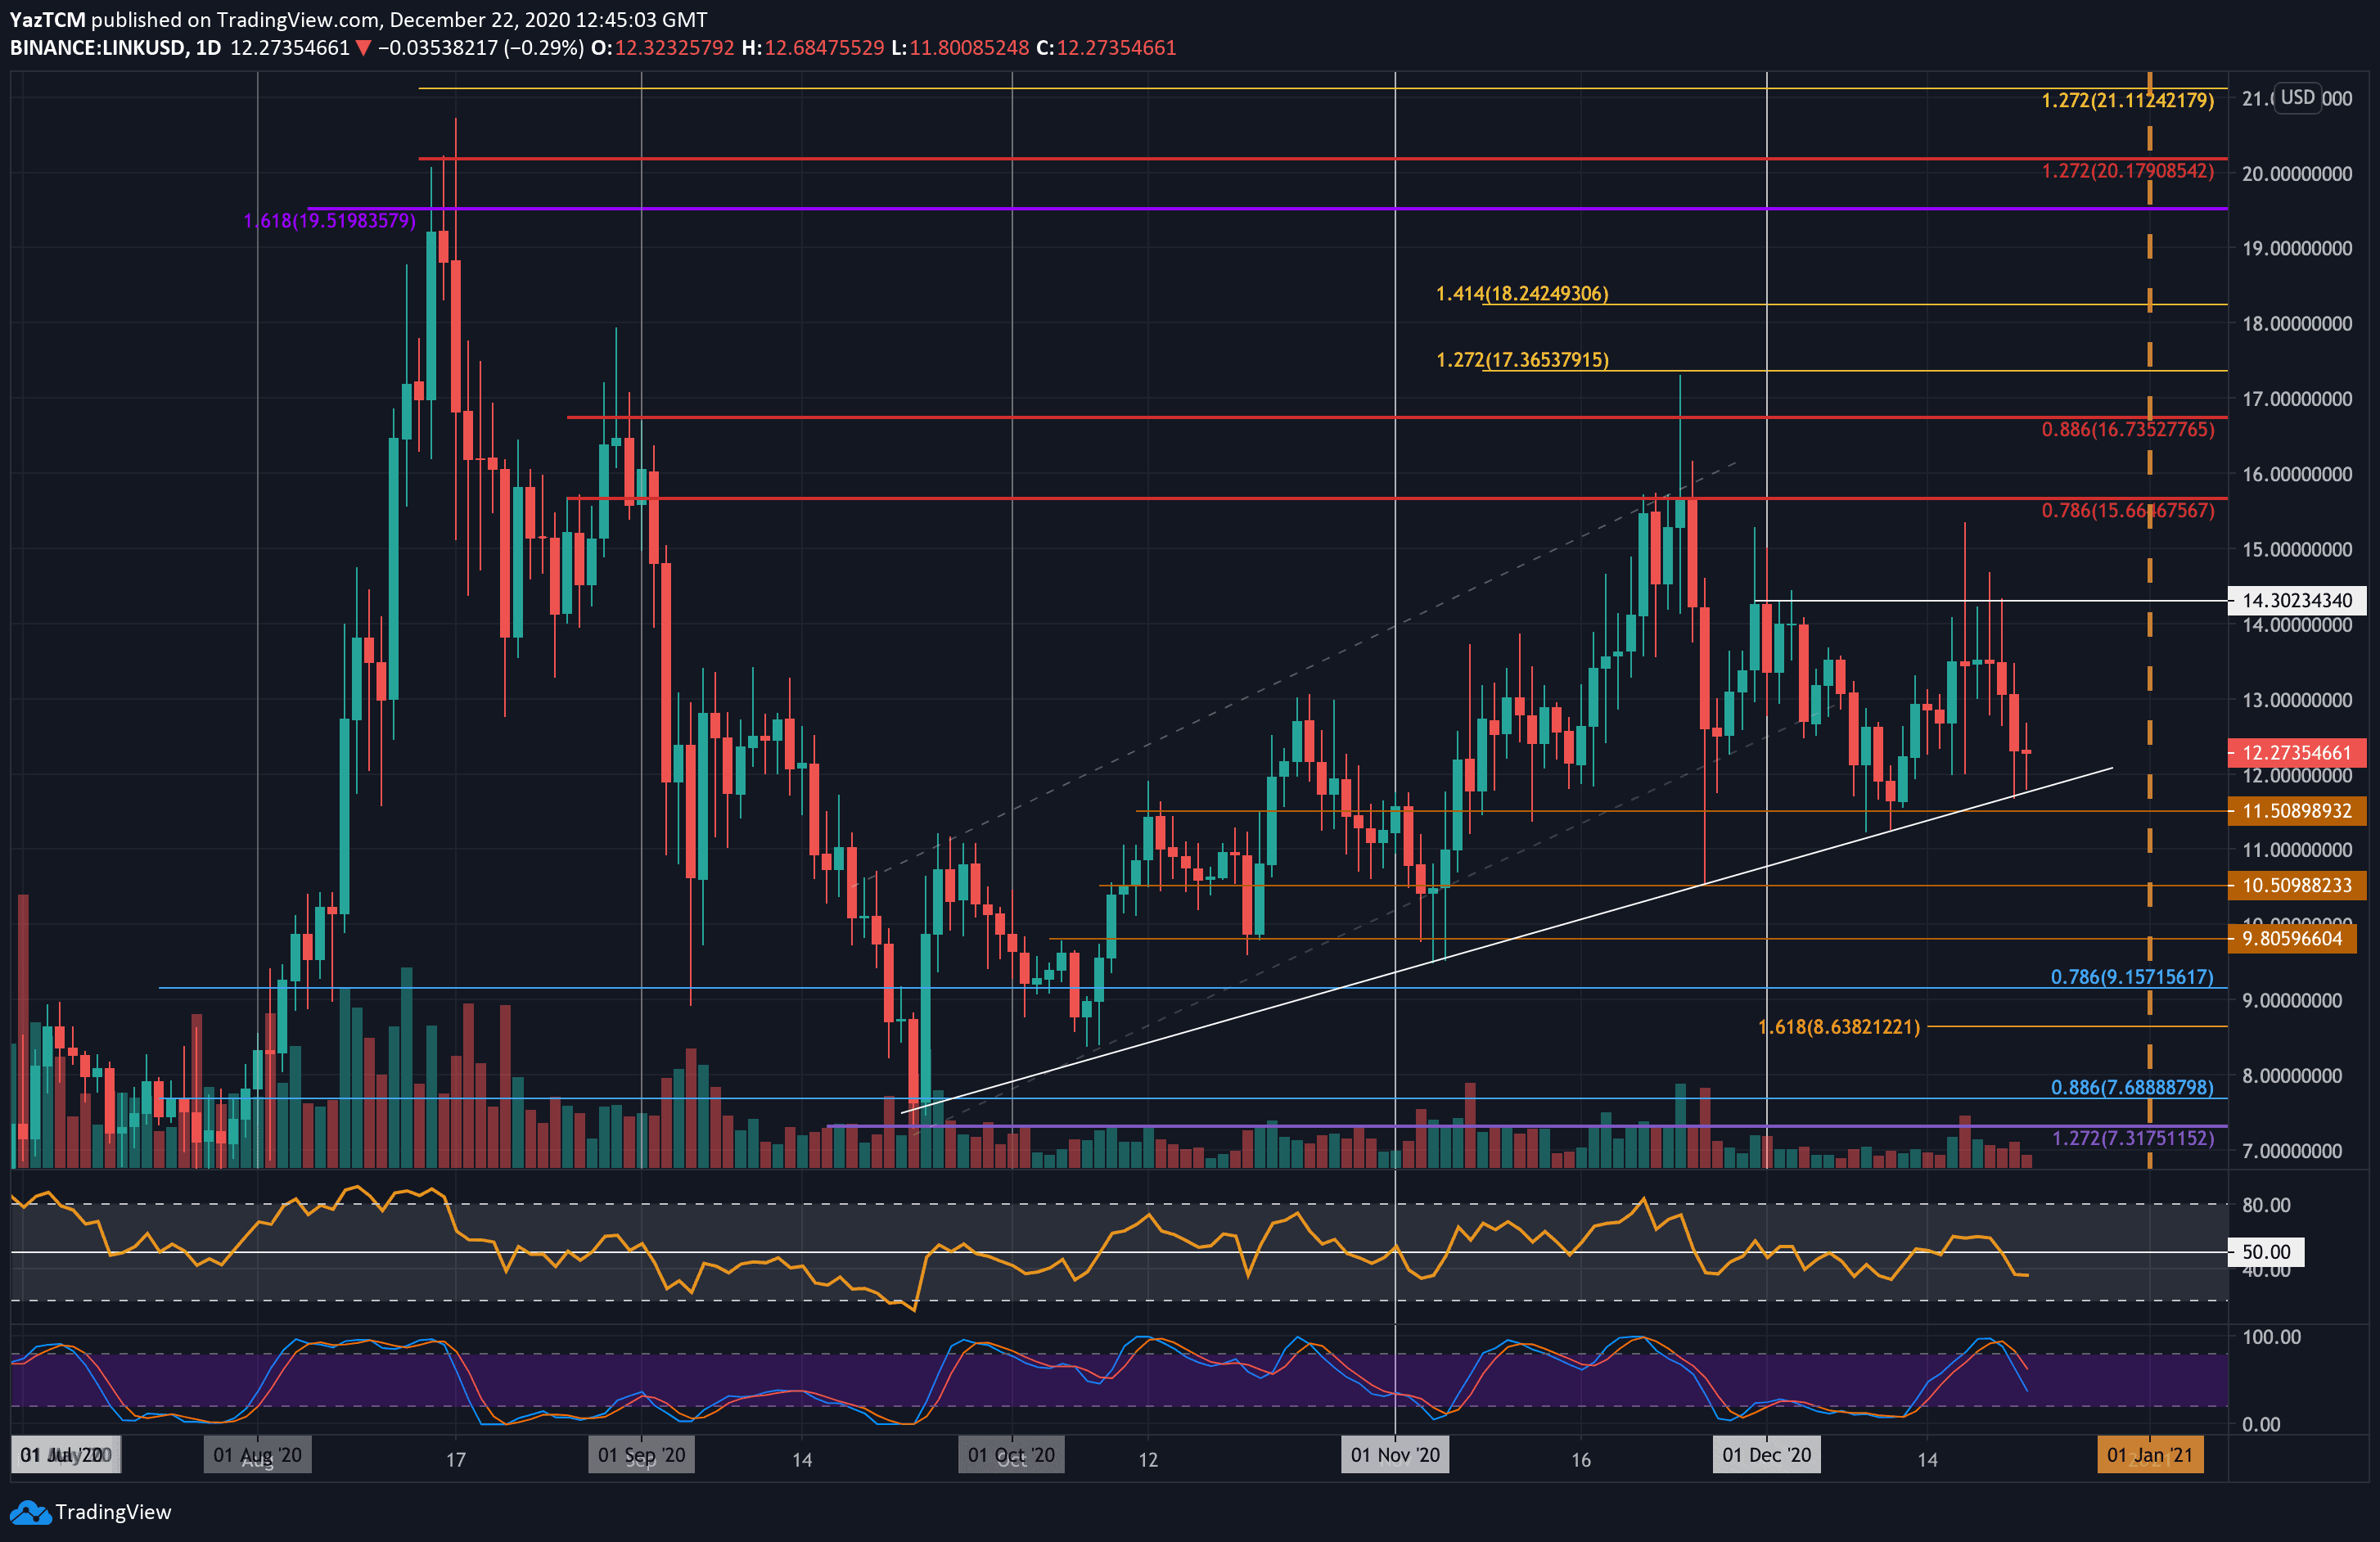
LINK/USD Daily Chart. Source: TradingView
Key Support Levels: $12, $11.50, $10.50.
Key Resistance Levels: $13.50, $14.30, $15.
LINK is currently trapped in a period of indecision as it bounces between $14.30 and $11.50. The coin has been unable to claim either of these boundaries for the entire December but is battling to remain above a three-month-old rising trend line.
It surged higher from $11.50 last week but could not close a daily candle beyond $13.50 over the weekend, causing it to roll over and head back beneath $13.00 at the start of this week.
The market condition for LINK will remain neutral until the range can be penetrated.
Looking ahead, if the bulls can defend the $12 support and push higher, the first level of resistance is expected at $13.50. This is followed by $14.30 (upper boundary of December range), $15, and $15.66 (bearish .786 Fib & November High-Day Closing Price).
Alternatively, if the sellers head lower, the first level of support lies at $12 (rising trend line support). This is followed by $11.50 (December support), $11, $10.50, and $10.
The Stochastic RSI recently produced a bearish crossover signal to indicate the bullish pressure has faded. Additionally, the RSI trades beneath the mid-line as the bears currently control the market momentum.
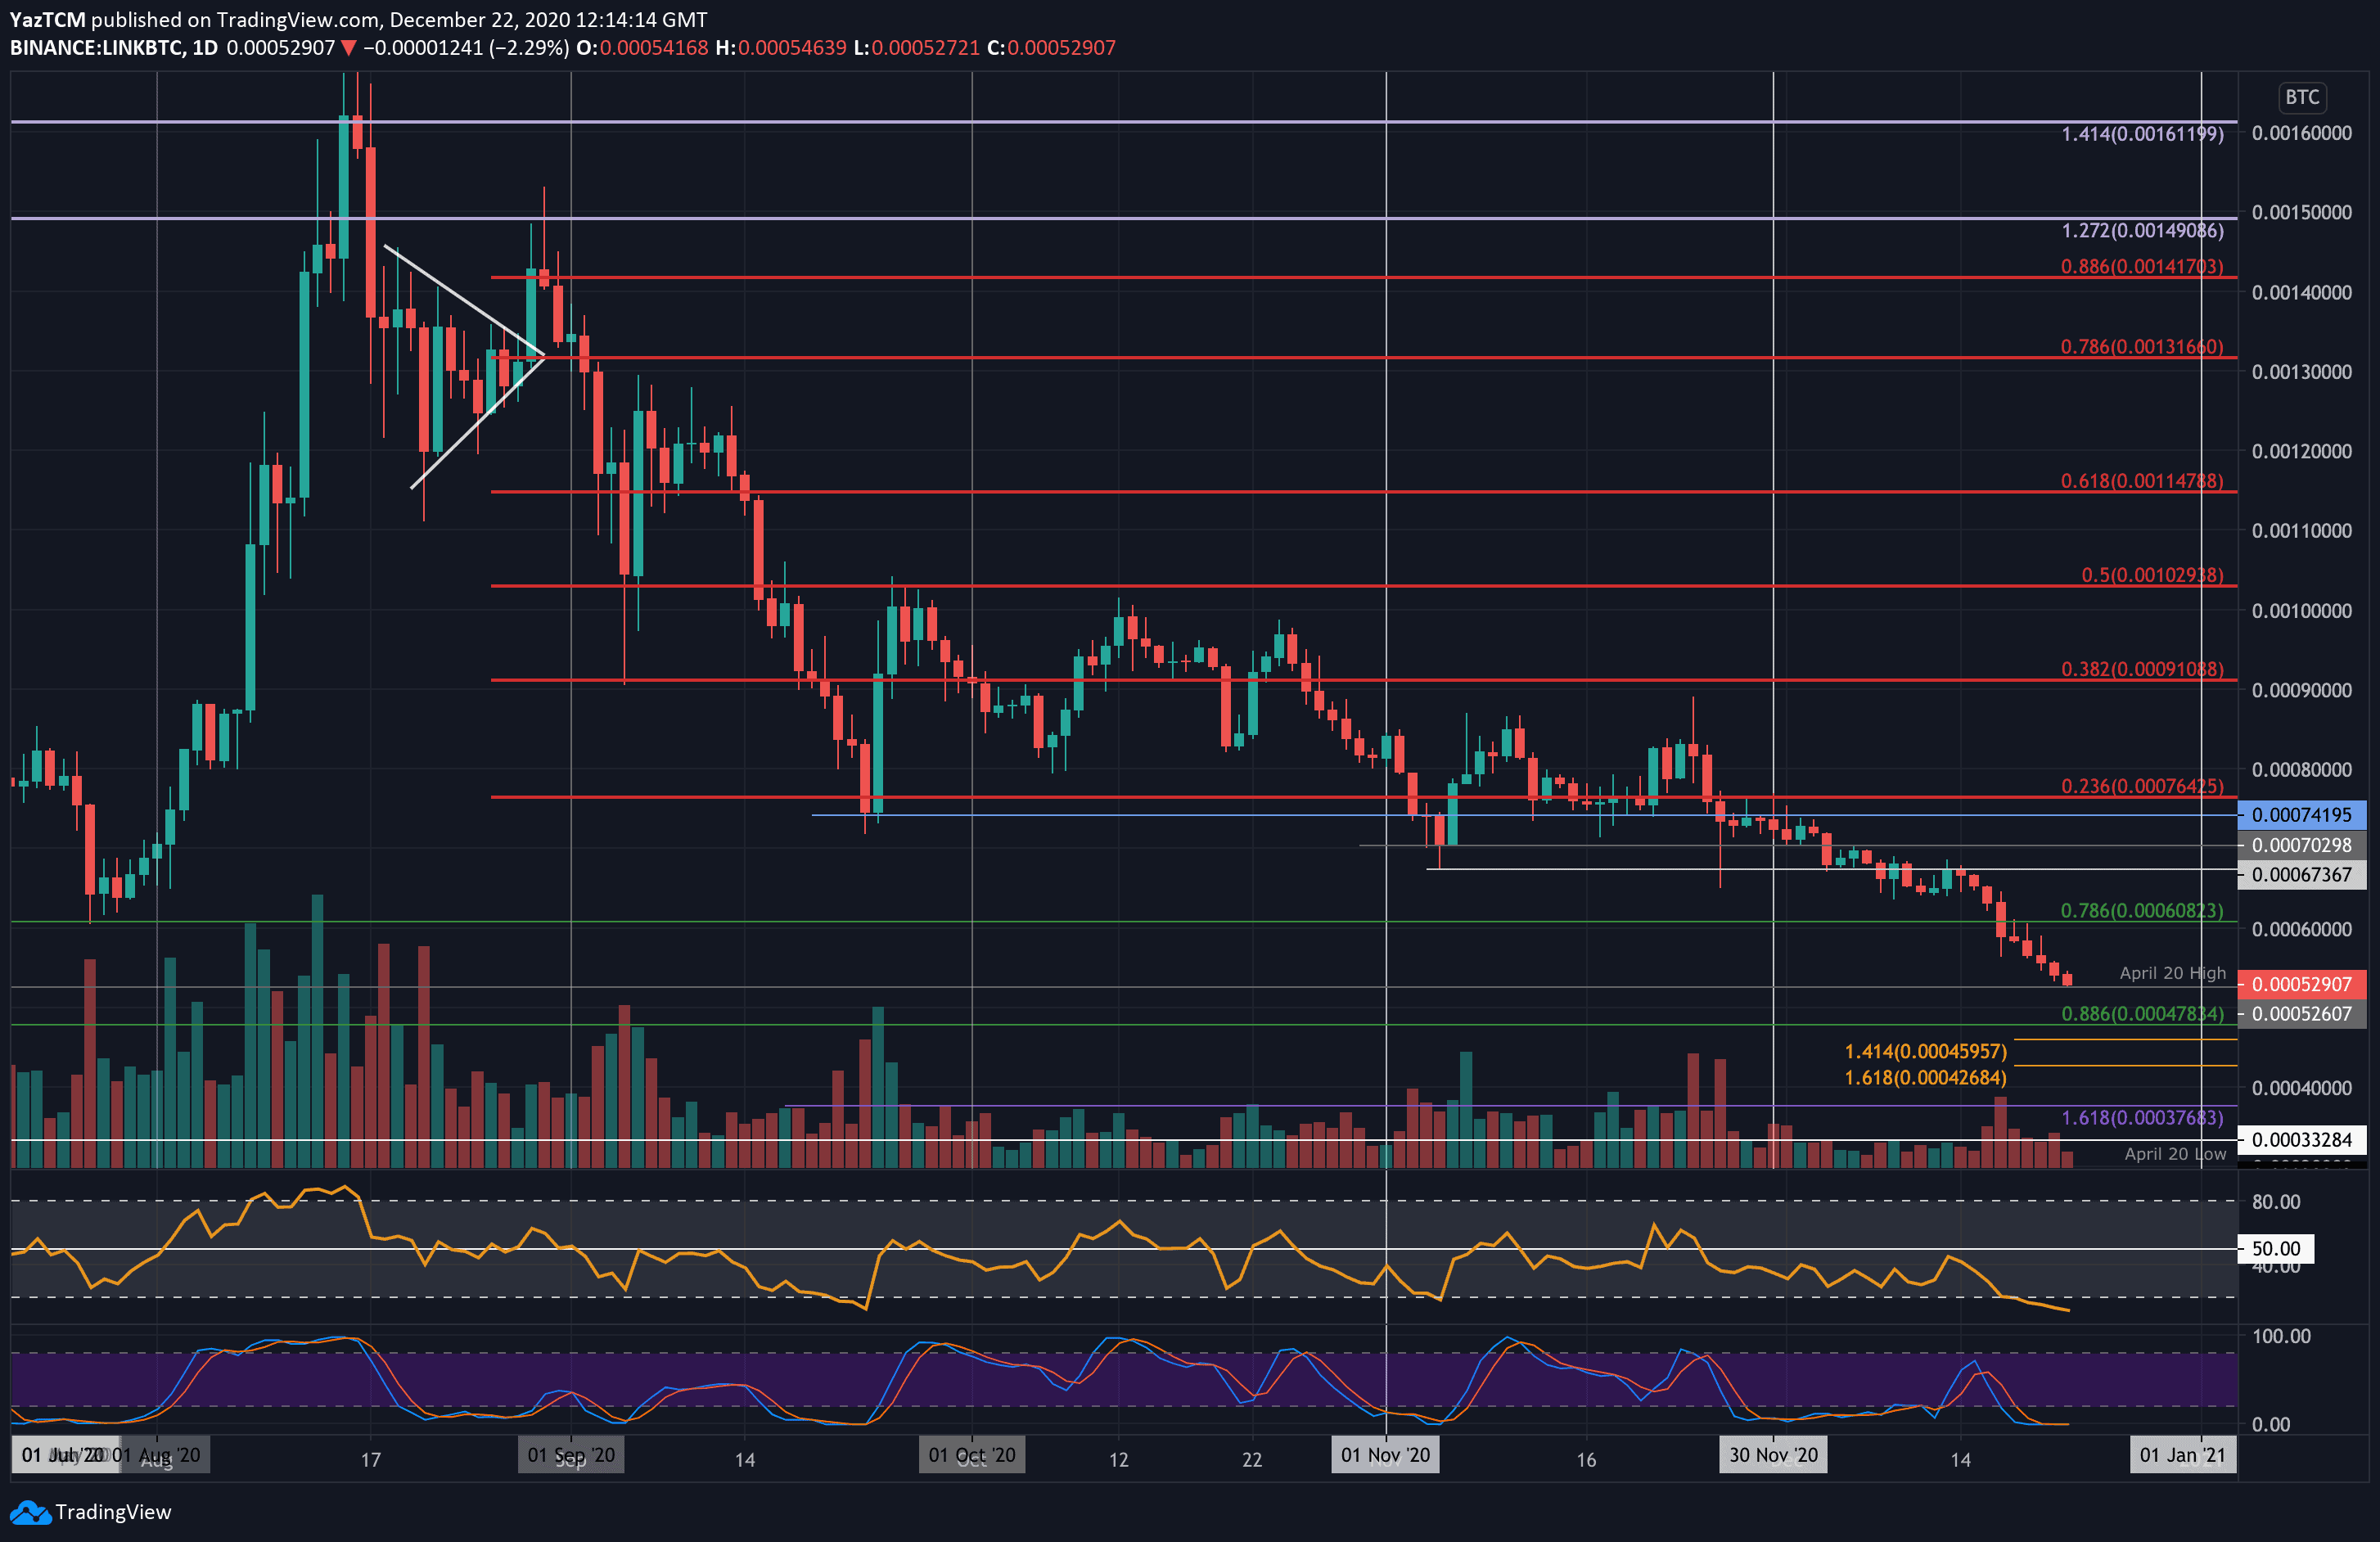
Key Support Levels: 70,000 SAT, 67,367 SAT, 65,000 SAT.
Key Resistance Levels: 74,200 SAT, 80,000 SAT, 86,800 SAT.
Against Bitcoin, LINK has dropped by a precipitous 31% from the December high of 76,400 SAT. Last week, it fell beneath the 60,800 SAT support, provided by a .786 Fib Retracement, and continued to reach the current support at 52,600 SAT (April 2020 Highs).
LINK has been in a consistent downtrend for the past three months, and the latest downward pressure has put the coin at a near 6-month low price.
Looking ahead, if the bears push beneath the 52,600 SAT level, support is first expected at 50,000 SAT. This is followed by 47,800 SAT (.886 Fib), 46,000 SAT, and 42,700 SAT.
On the other side, the first level of resistance lies at 60,000 SAT. This is followed by 67,400 SAT, 70,000 SAT, and 76,425 SAT (December highs).
The RSI is exceptionally oversold, which might indicate the sellers are overextended. The Stochastic RSI is primed for a bullish crossover signal that could send the market higher.