The positive momentum in the crypto markets is now being shadowed by a cross of two significant moving average lines.
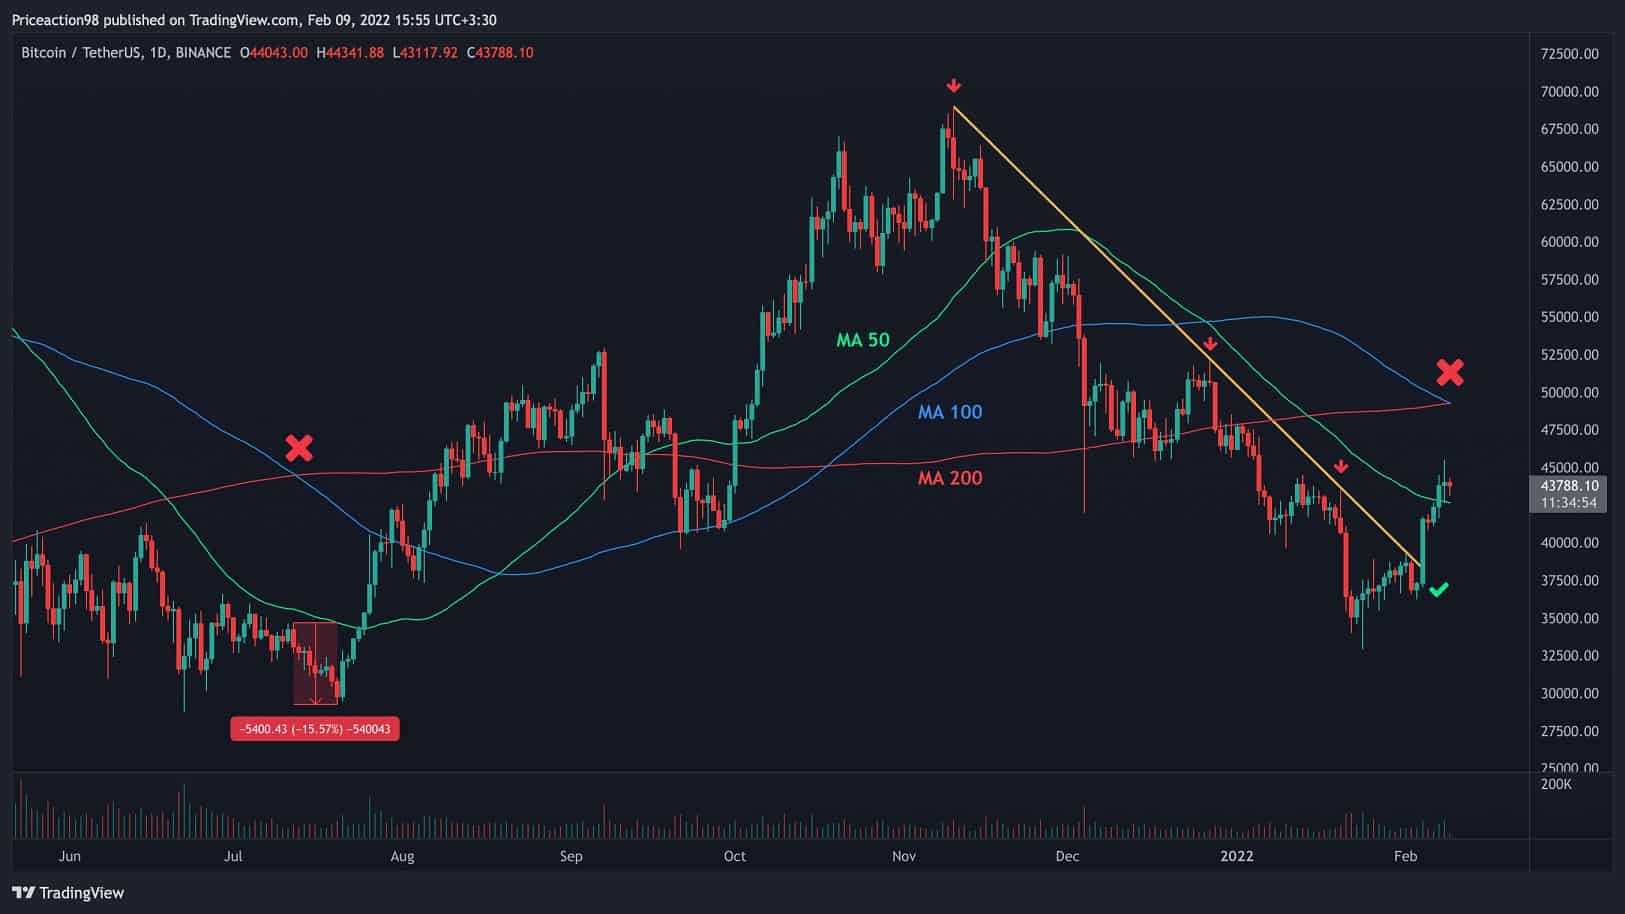
A death cross occurs when the MA-50 crosses below the MA-200 line. This time, the cross was between the MA-100 crossing below the MA-200 line.
Reviewing the historical incidents where this cross took place, the market has reacted negatively last time, causing a 15% correction in June – July 2021 following the previous incident of a death cross.
By: Edris
Bitcoin has been moving upwards in the past few days. The positive signaling point is that the BTC price has already broken above the major descending trendline and shortly attempting at the 50-days MA resistance line.
However, the negative point to highlight here is that the 100-days MA crossed below the 200-days MA. The last time this cross happened was at the final phase of the mid-2021 heavy correction. The price declined more than 15% back then – below $30K, finalizing the last bearish leg before a significant rally that ended at November’s Bitcoin ATH of $69K.
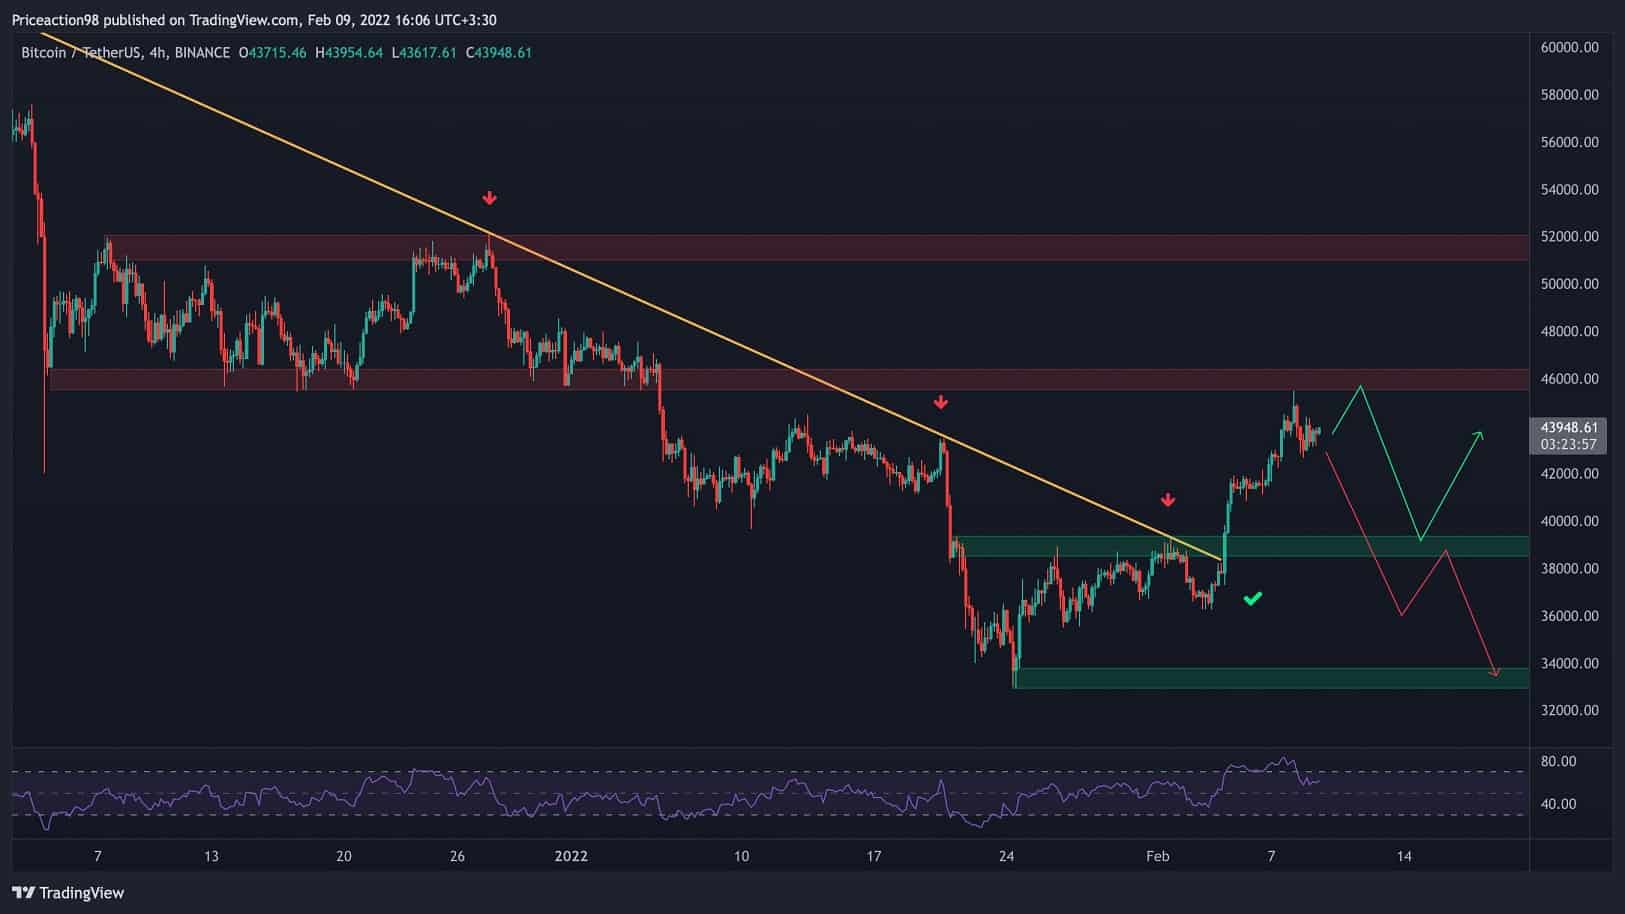
On the 4-hour timeframe, it is evident that the price is currently being rejected at the $45k resistance area. Moreover, the RSI indicator shows that bitcoin has been “overbought” in the 4-hour timeframe, and a correction may be imminent.
From a technical perspective, there is a high chance for the price to experience a correction to the $39k range, completing the first-major pullback after breaking the major bearish trendline.
However, one should observe the price action, as a deeper correction to the $33k range (January’s lows) is feasible, especially with the daily MA100/200 cross.
By: Shayan
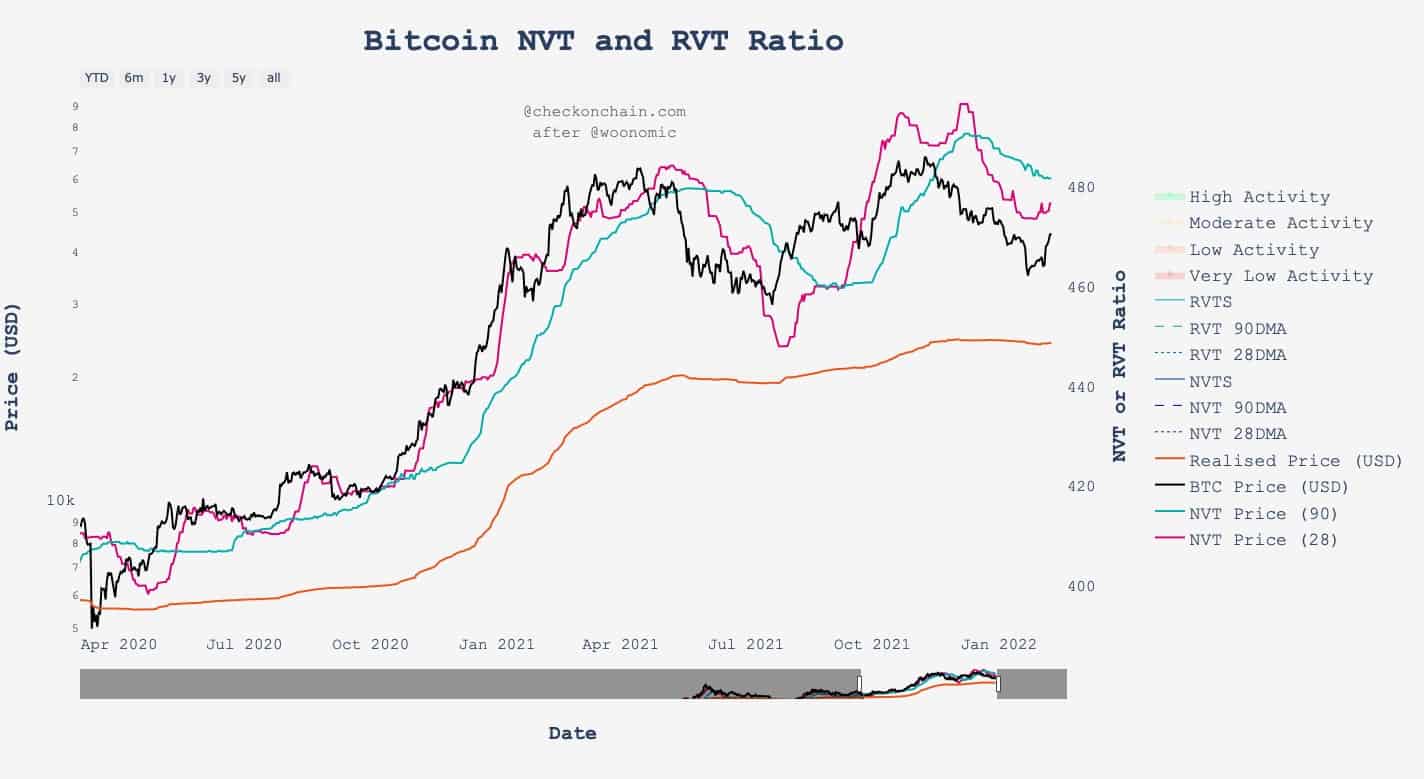
The NVT Ratio (Network Value to Transactions) illustrates the relation between market capitalization and transfer volume. It’s similar to the PE (Price to Earnings) ratio utilized in equities markets.
NVT is a metric that determines whether or not Bitcoin’s blockchain network is overvalued.
Historically, when the price dropped below the 90-day and the 28-day MA NVT price, it was an excellent opportunity to follow the DCA strategy to accumulate Bitcoin.
Currently, the price is below both NVT prices indicating the network is undervalued and is considered an ideal time to start a DCA accumulation. Moreover, a day trader can start realizing the profits whenever the price breaks above the NVT prices.