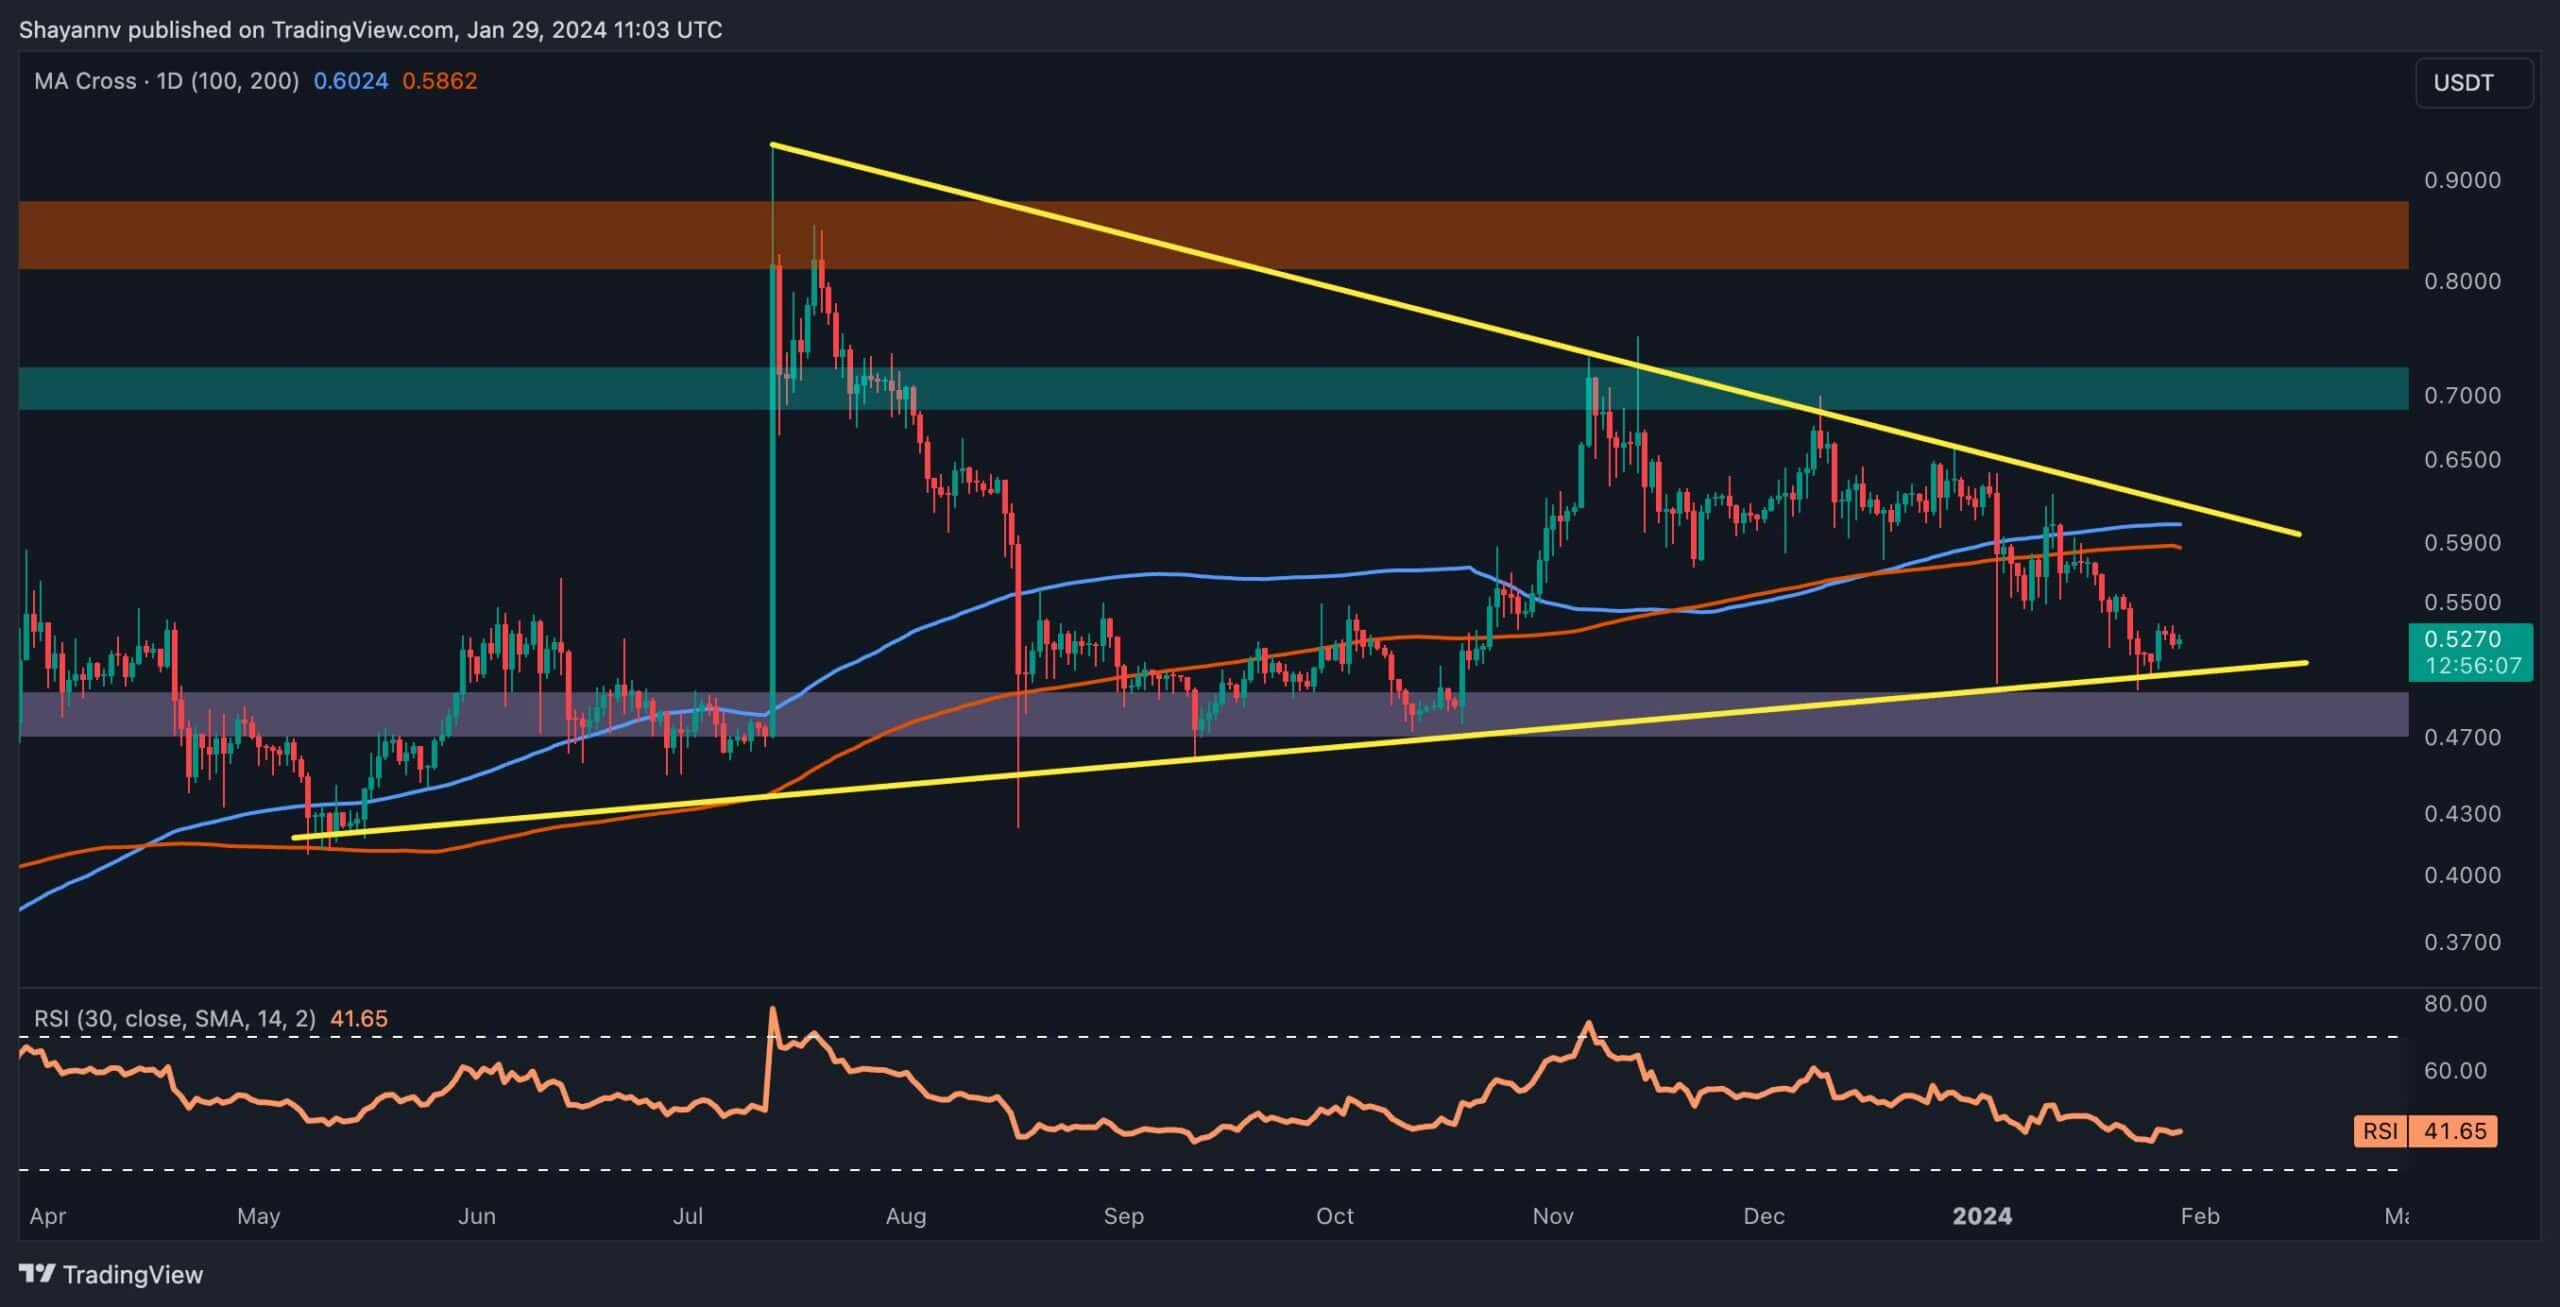
Ripple’s price has been confined within a symmetrical triangle pattern since the latter half of 2023. However, a recent sharp decline has brought the price to the lower boundary of the triangle, where it may find support in the coming days. The subsequent breakout from this triangle pattern will play a pivotal role in shaping Ripple’s future prospects.
By Shayan
A comprehensive analysis of the daily chart shows a noticeable downturn in Ripple’s price, following a successful pullback to the broken 100 and 200-day moving averages.
However, the current price has reached a critical and decisive support region, encompassing the static support level of $0.5 and the lower boundary of the multi-month triangle. This support range is a robust defense against sellers, potentially impeding further downward movements.
Despite the resilience of this support range, the impending breakout is evident as the price approaches the narrow range of the triangle. A successful break below this crucial triangle could initiate a significant downward trajectory for Ripple, introducing fear and uncertainty to the market.
Conversely, a break above the upper boundary would pave the way for a renewed bullish trend, targeting the pivotal resistance at $0.7.
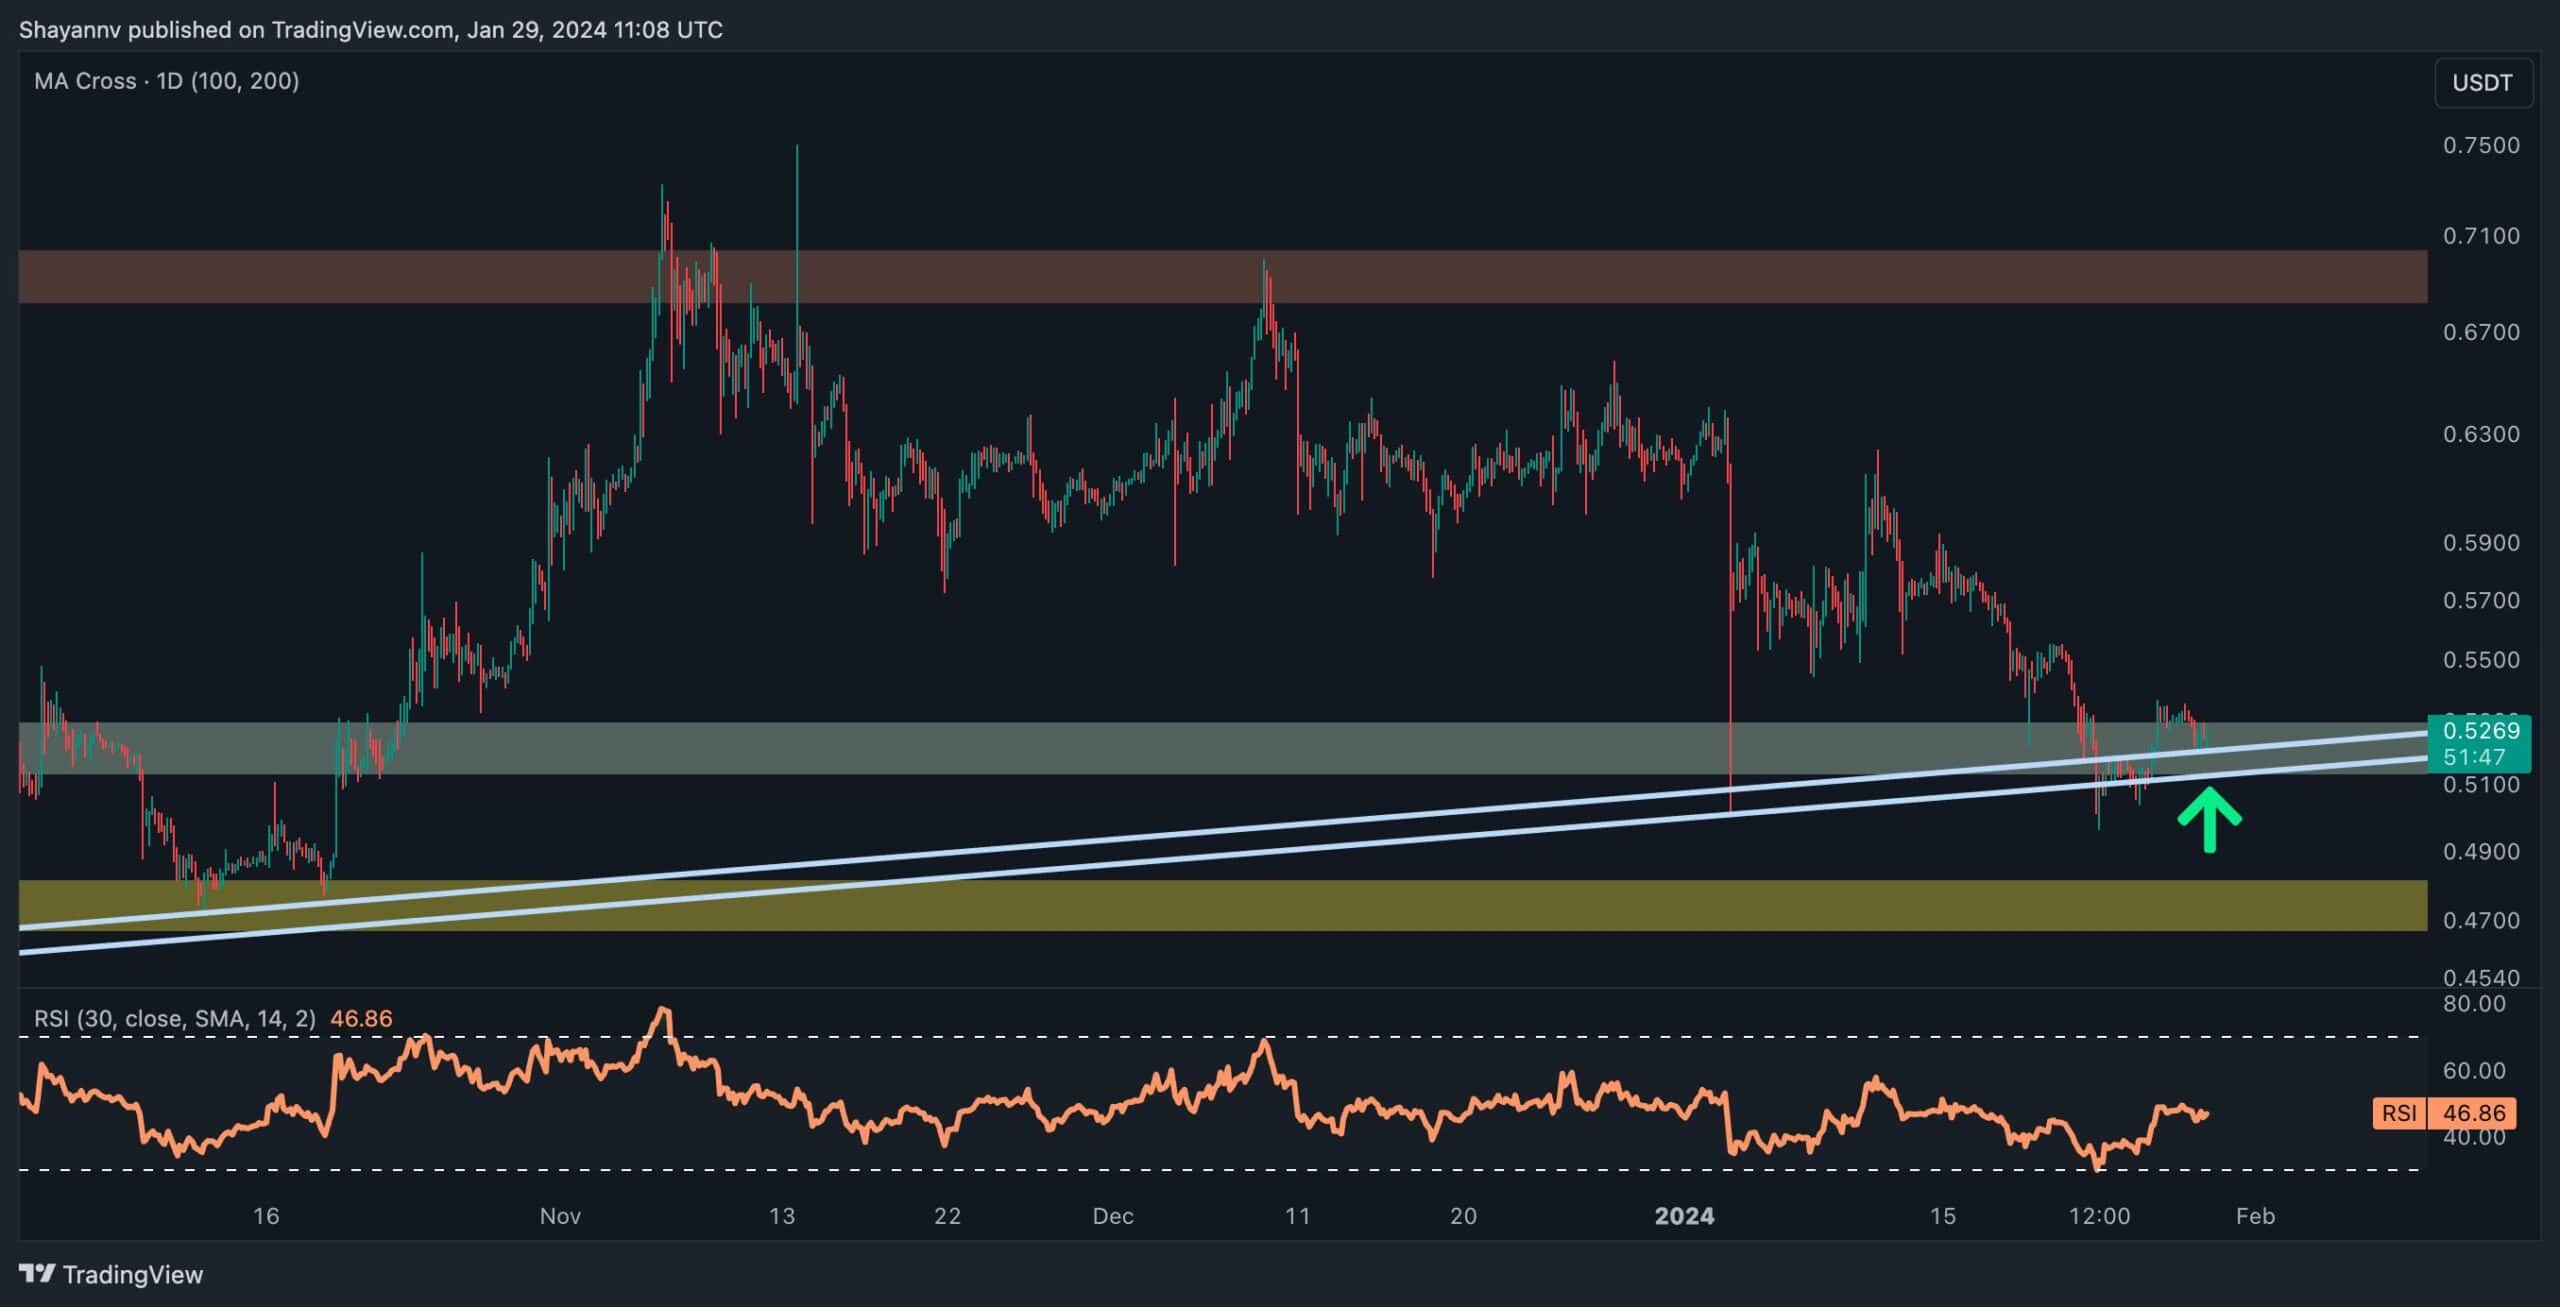
A more focused examination of the 4-hour chart also highlights an impulsive downtrend, underscoring the dominance of sellers in the market.
Nevertheless, the price has now reached a pivotal support region defined by the multi-month ascending trendline and the static support range of $0.5.
The trendline’s historical role as robust support suggests heightened demand. With the price intersecting this crucial trendline and the static support zone at $0.50, there is a notable potential for a reversal, signalling a possible bullish trend in the mid-term.
However, a sudden break below this critical support range could lead to a substantial decline, targeting the next crucial support level at $0.48. In such a scenario, the $0.5 support region would transform into a formidable barrier, initiating a consolidation stage between the support region of $0.48 and the mentioned resistance at $0.5.