By TradingRage
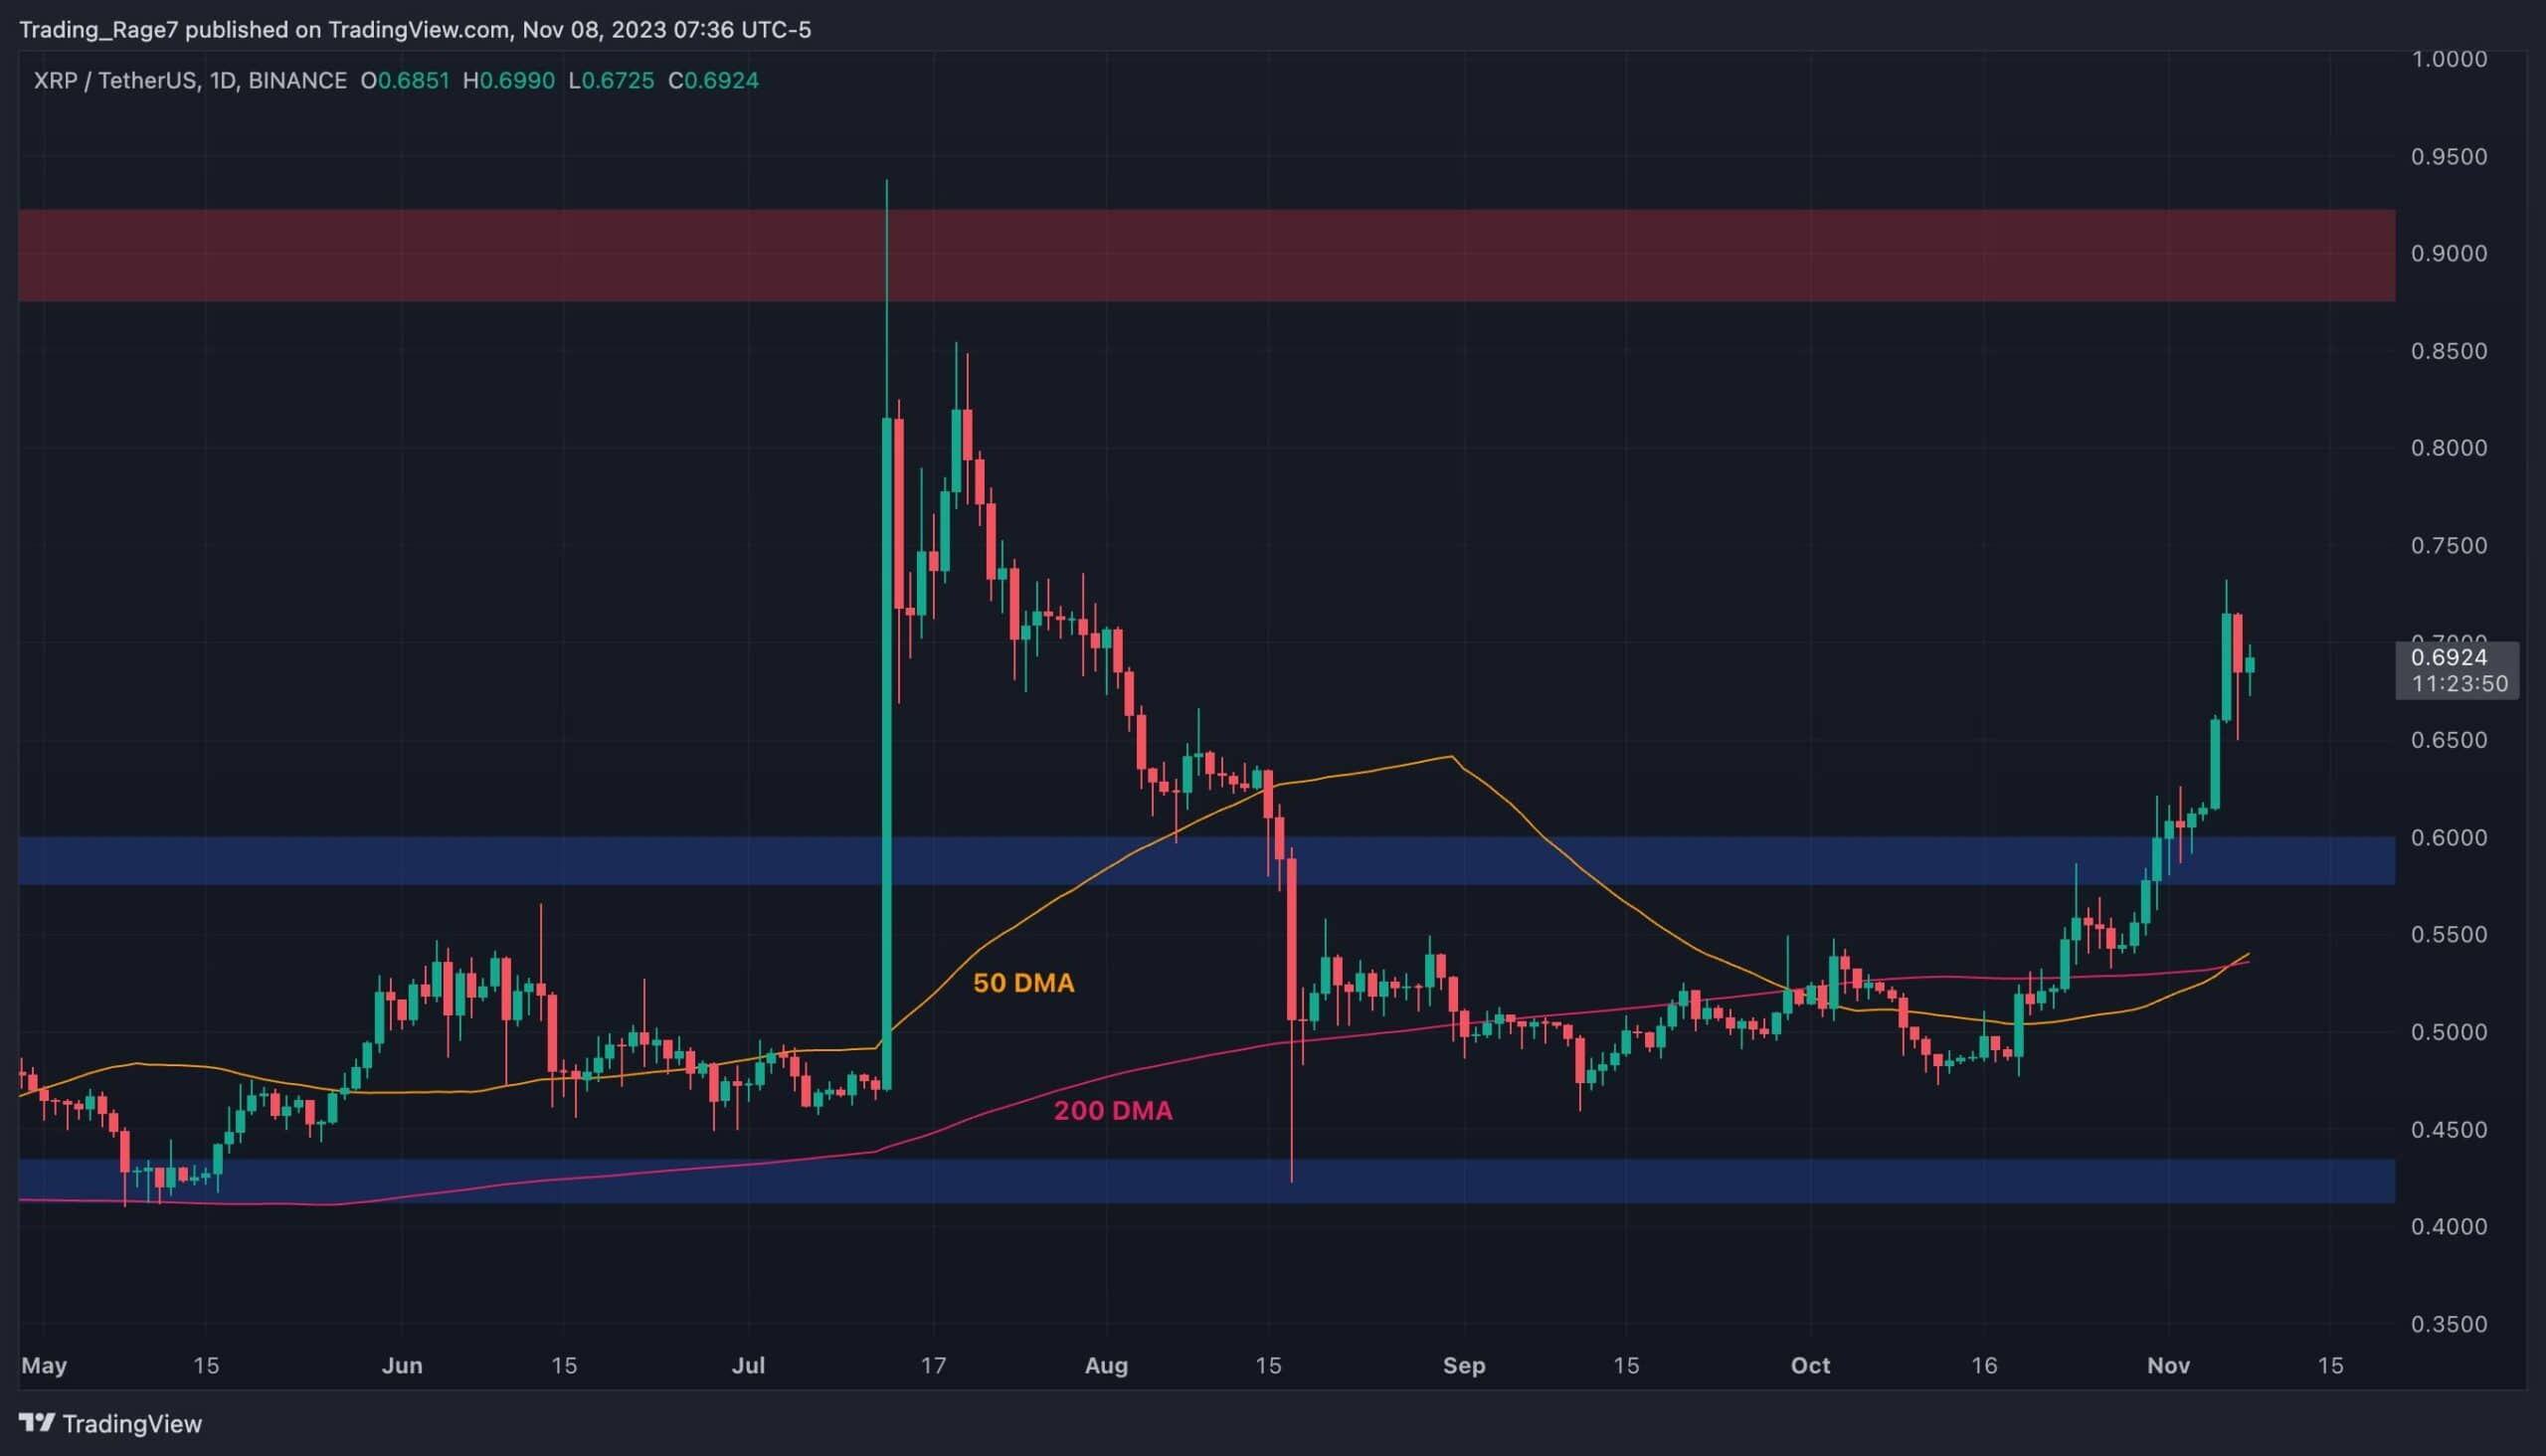
Ripple’s price has been running wild over the last few weeks following a rebound from the $0.5 range in October. While a pullback seems probable in the coming days, the price faces little resistance before the $0.9 resistance level.
Against USDT, the price has broken above the $0.6 level and has been rallying higher since. The 50-day and 200-day moving averages have also demonstrated a bullish crossover recently, with the 50-day moving average crossing the 200-day moving average to the upside.
This is a classic bullish shift signal, and the market seems likely to climb toward the $0.9 resistance area shortly.
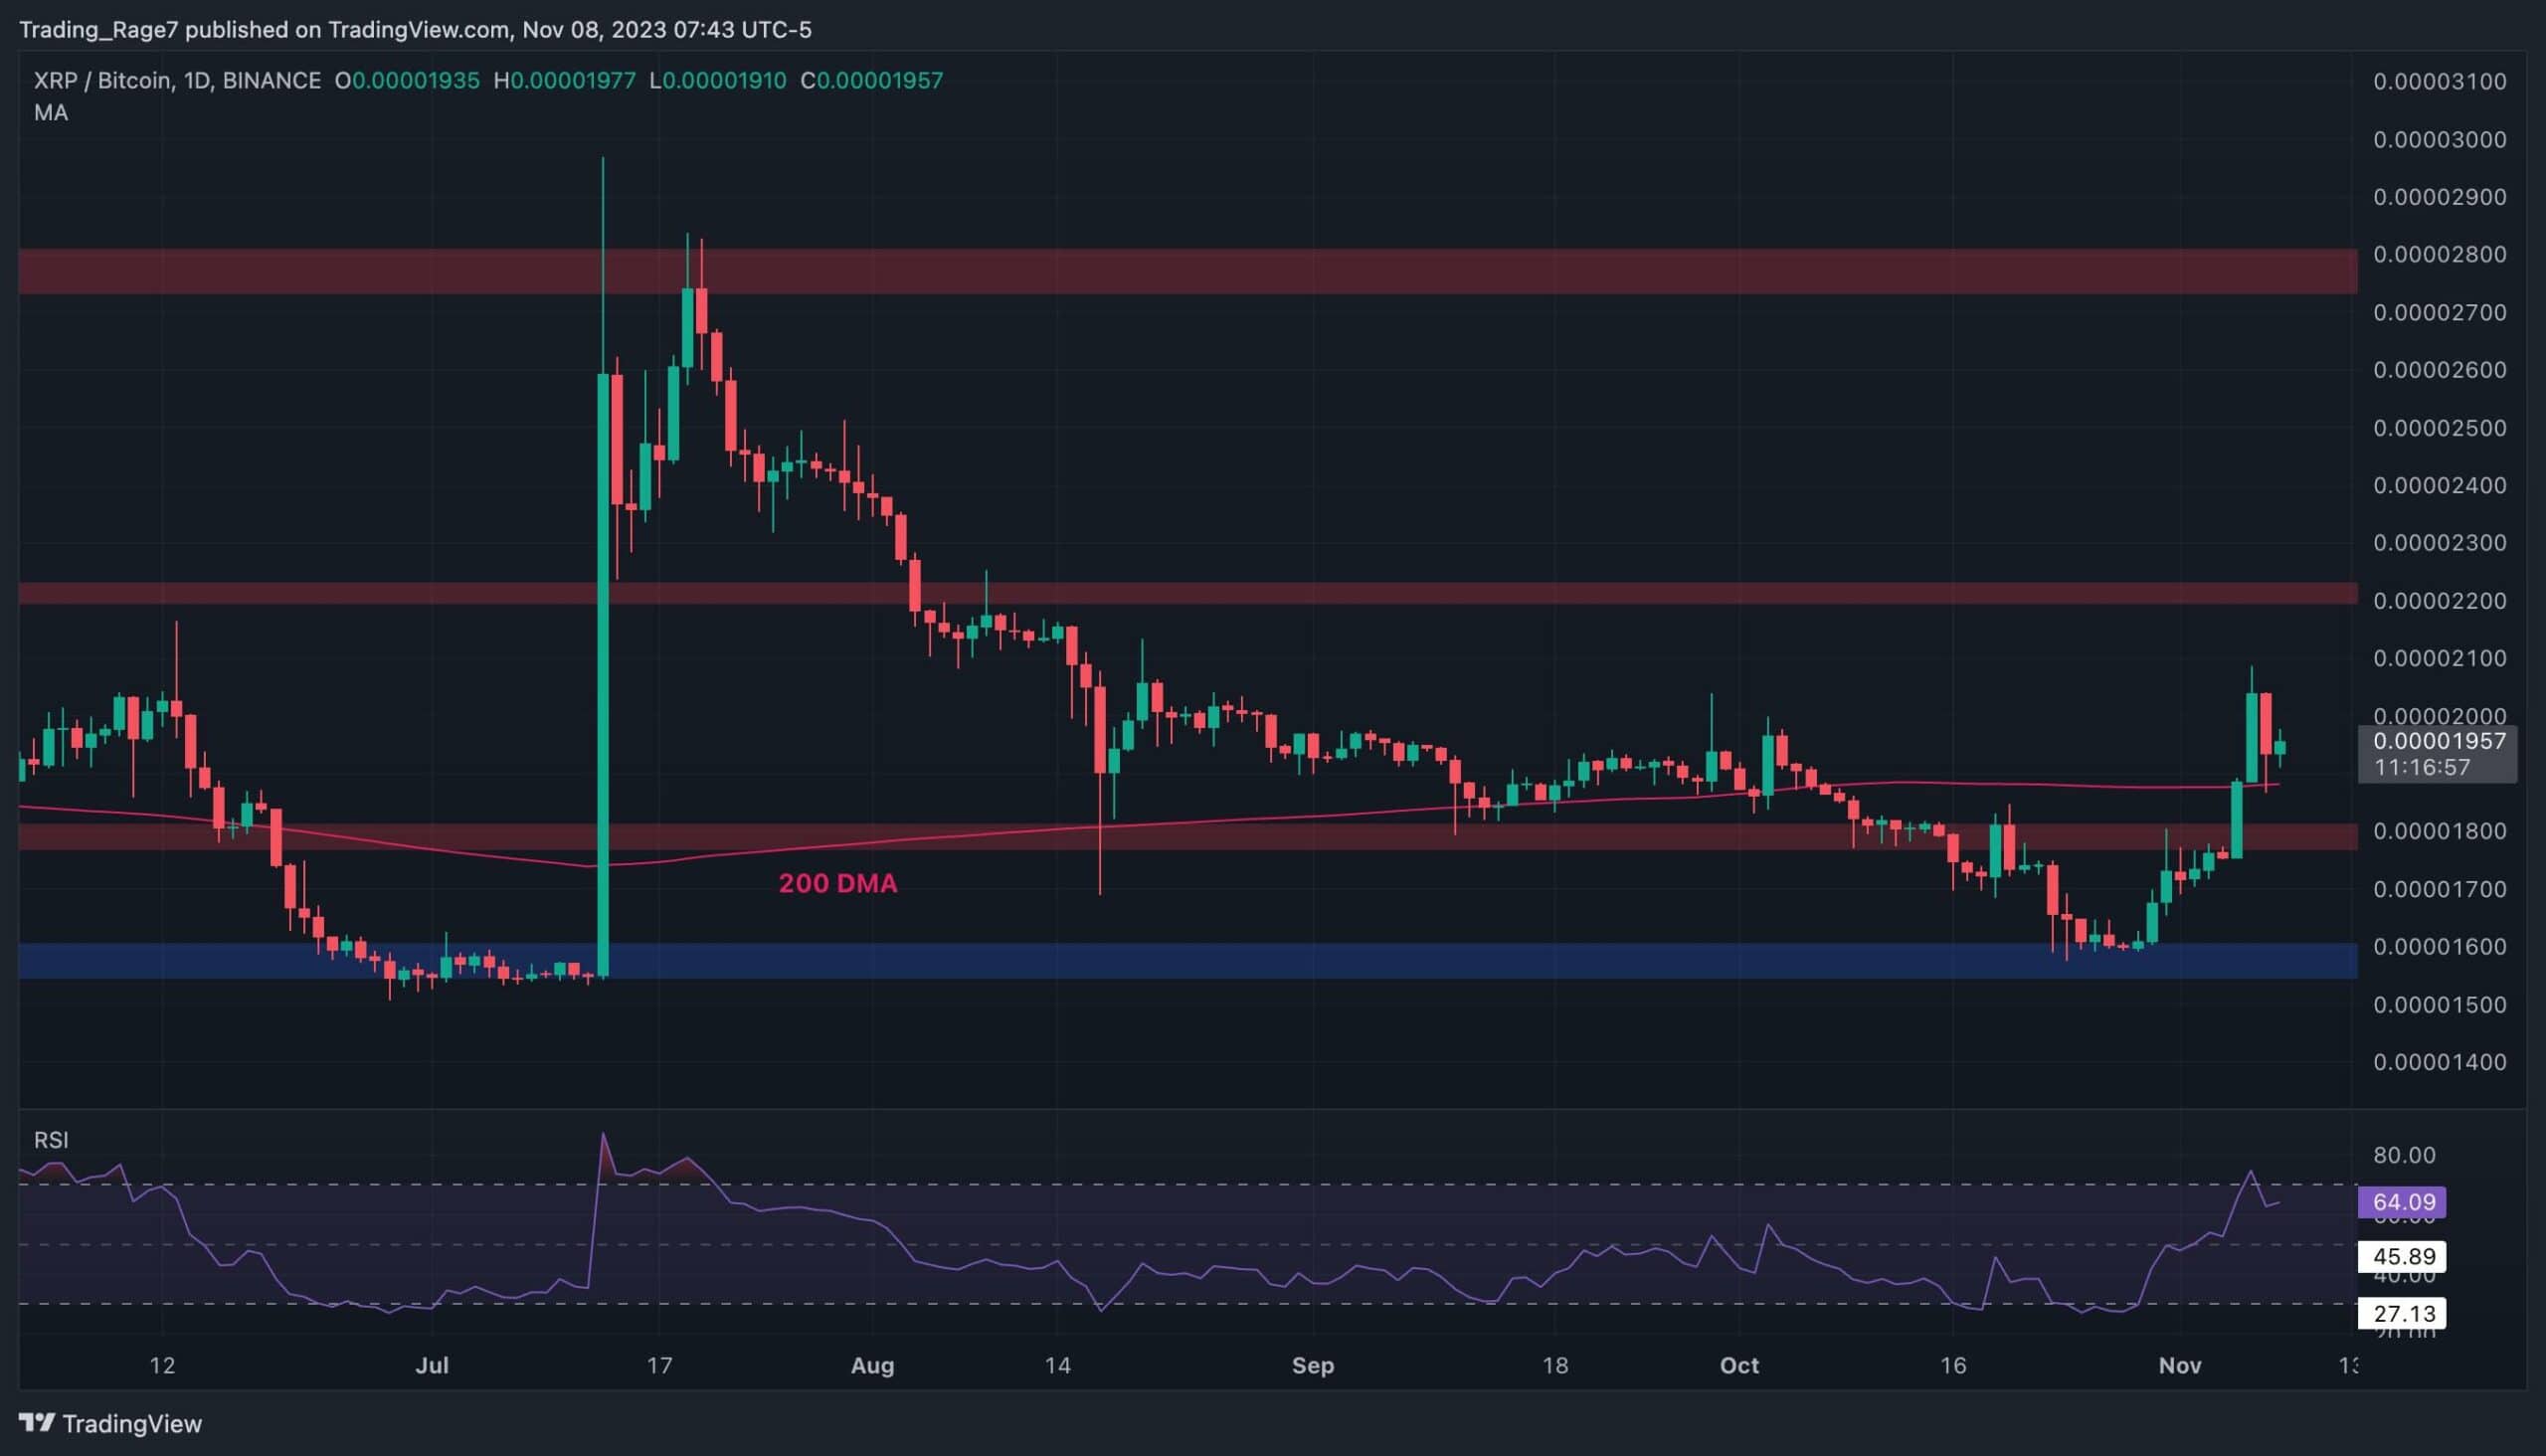
Looking at the BTC pair, things look quite similar for Ripple. The price has recently broken above the 1800 SAT level and the 200-day moving average, located around the 1900 SAT mark.
Moreover, the market has also retested the 200-day moving average yesterday and held above. As a result, the price seems more likely to push toward the 2200 SAT resistance zone in the coming days.
With the Relative Strength Index also showing values above 50%, a bullish continuation is looking very probable at the moment.