Ethereum’s price has declined significantly over the weekend as a result of the rising tensions in the Middle East. Yet, there are still potential support levels available to hold the price.
By TradingRage
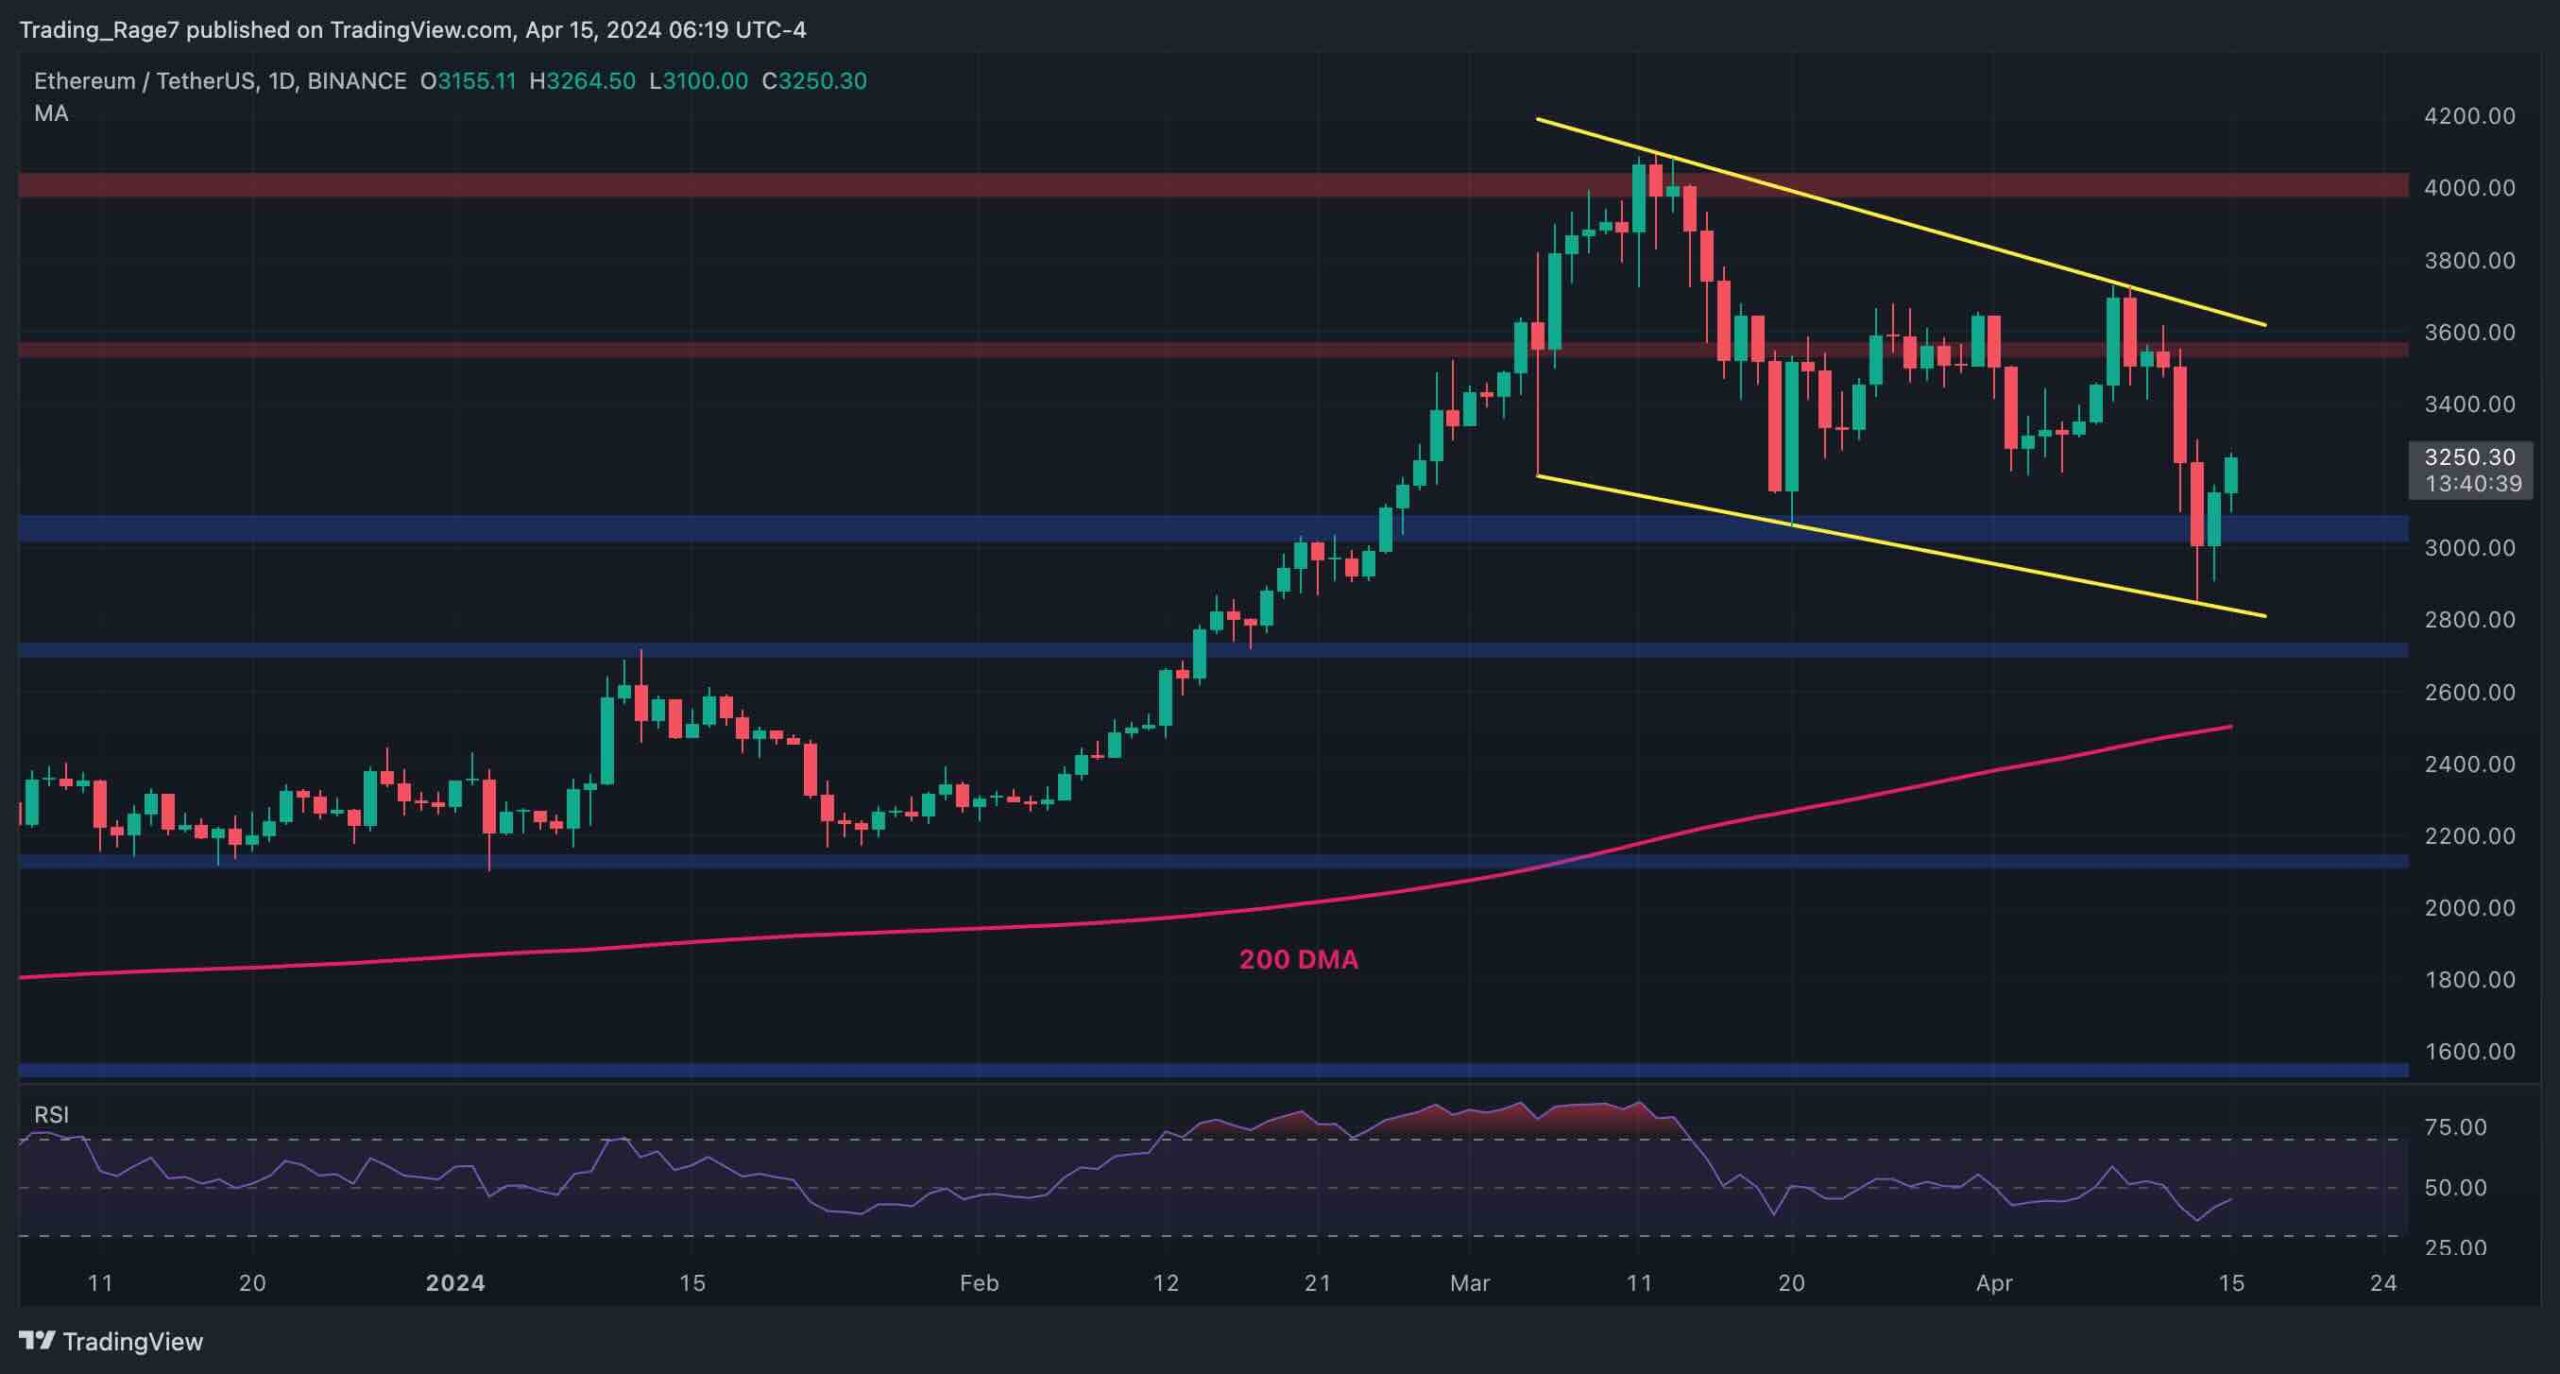
During the daily timeframe, Ethereum’s price has formed a large bullish flag pattern. The recent drop has briefly pushed the price below the $3,000 support level, but the market has rebounded from the lower boundary of the channel. Judging by the quick recovery, the drop below $3,000 can be considered as a false bearish breakout.
Therefore, ETH’s price can be expected to rally toward the $3,600 resistance level and the higher boundary of the flag in the coming days. The reaction to these levels can be crucial, as it can determine the longer-term market trend.
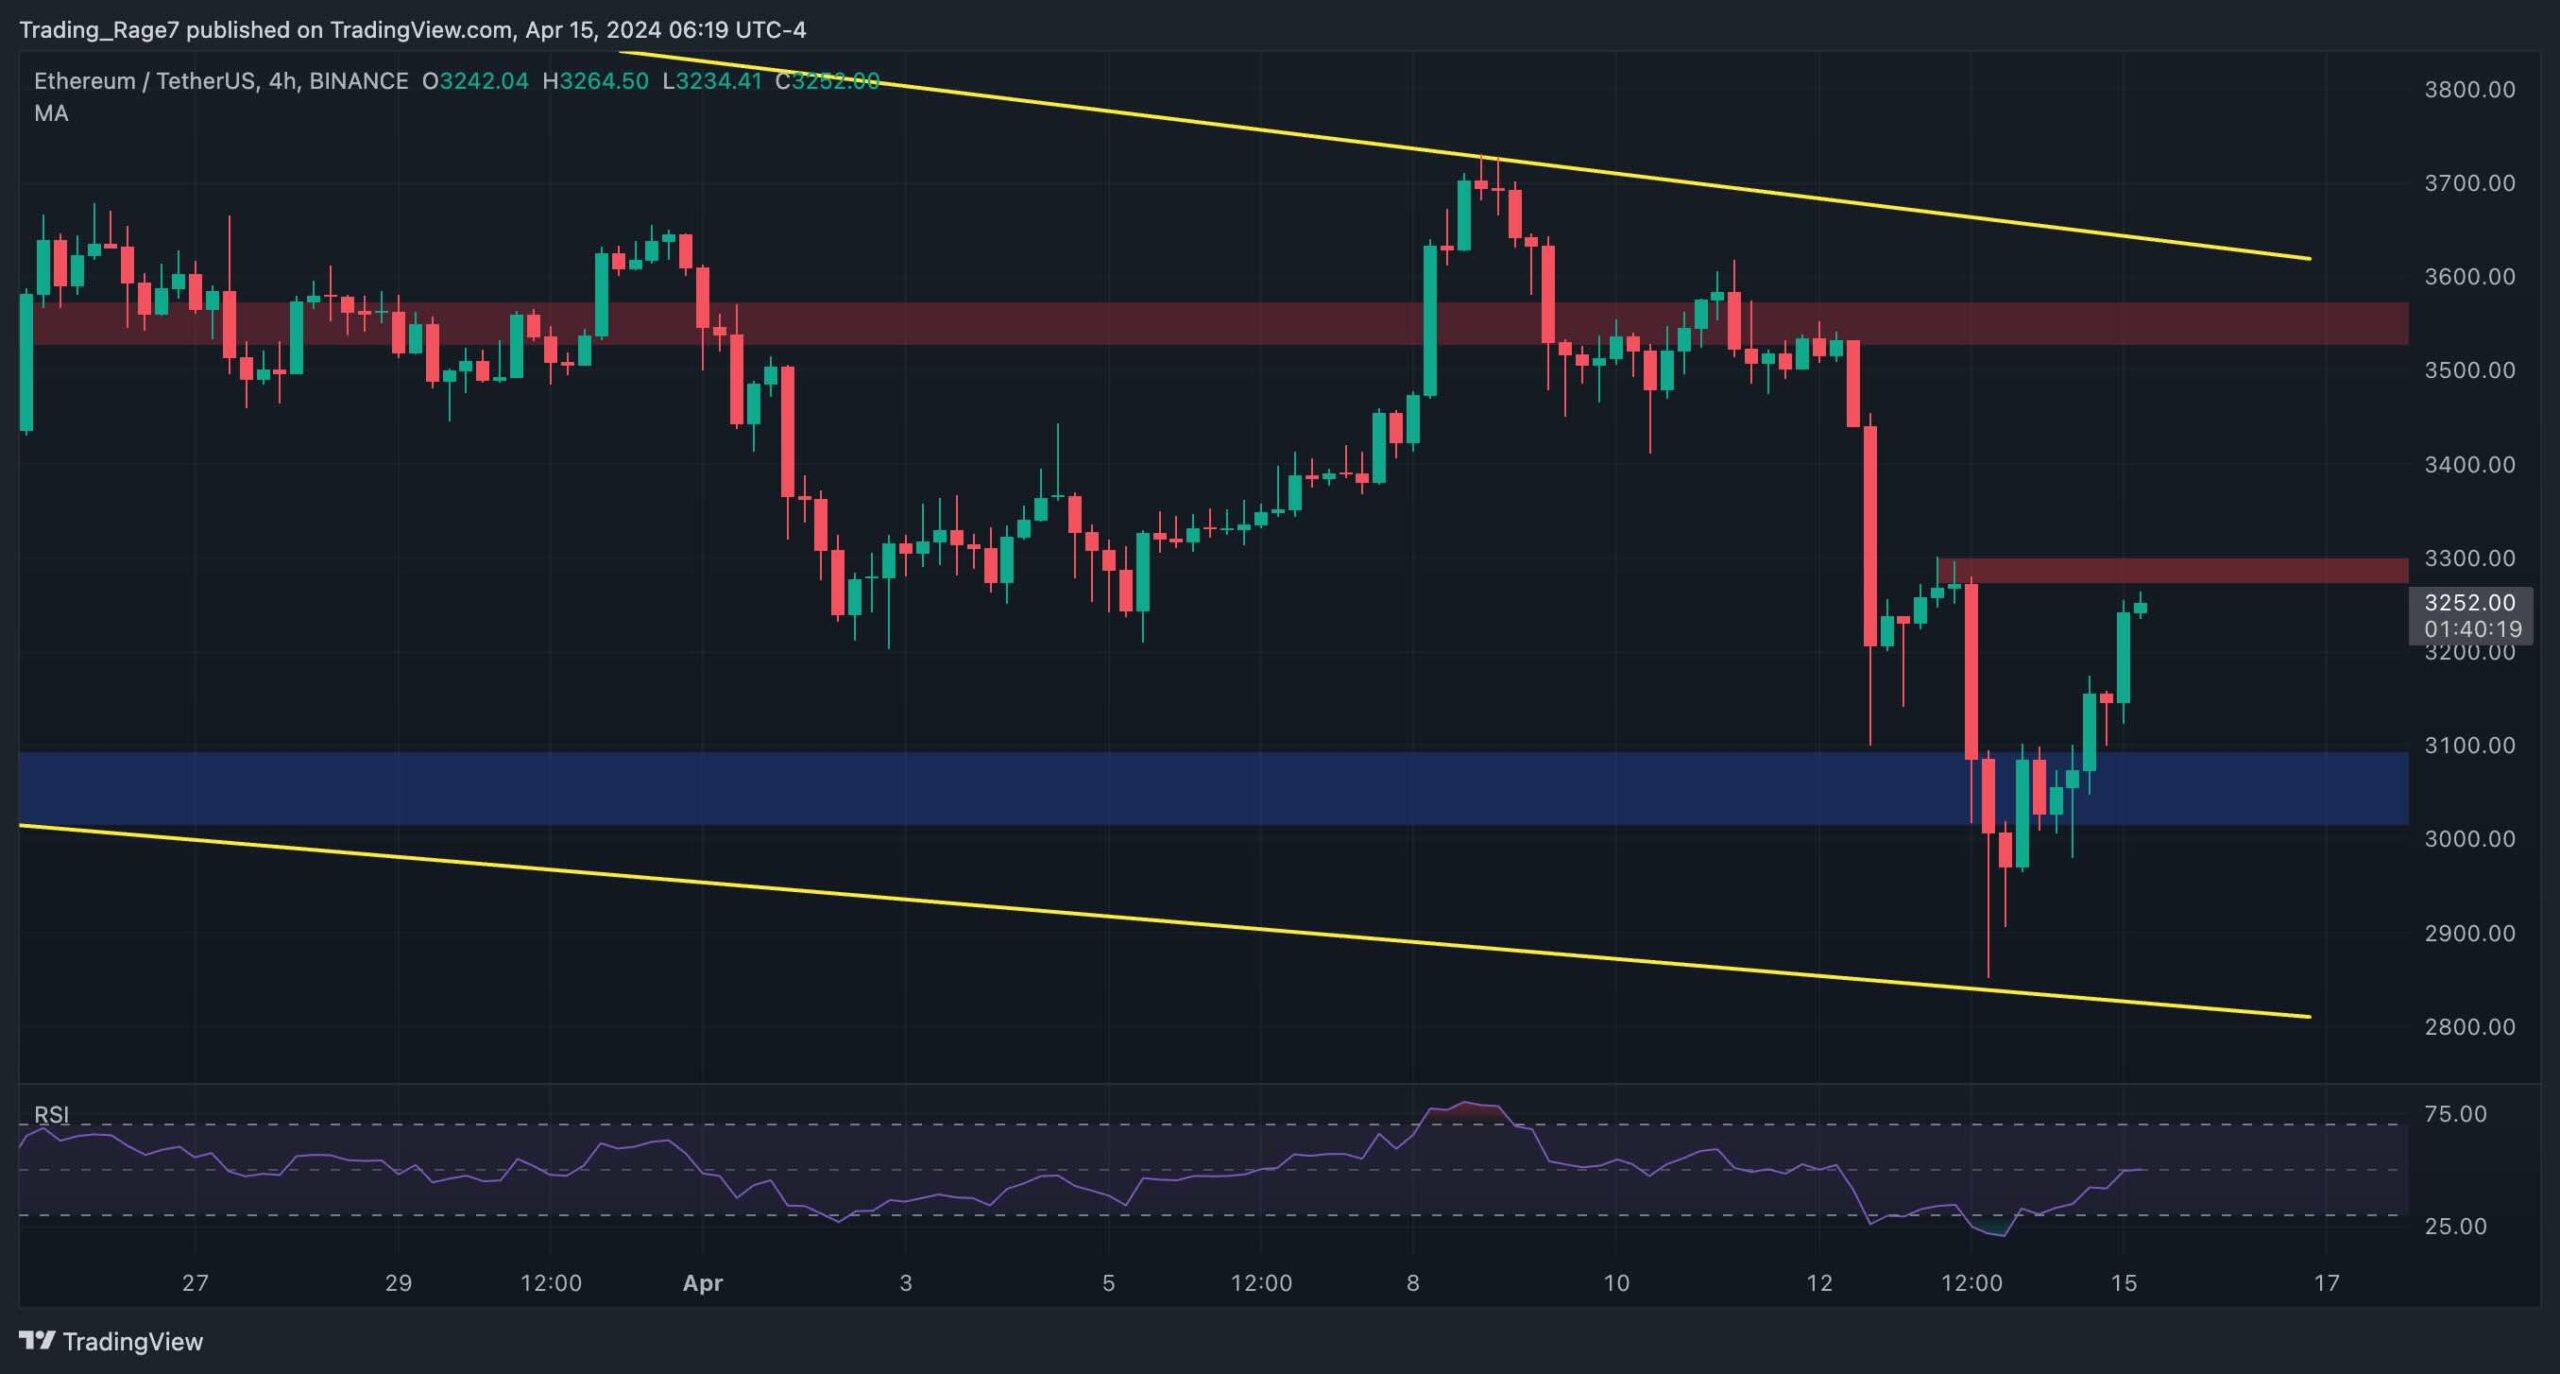
Dropping lower to the 4-hour timeframe, the price is approaching the $3,300 short-term resistance level. If the market successfully climbs above the mentioned mar, it could rally toward the $3,600 resistance and retest it once more.
The Relative Strength Index is also rising above the 50% threshold, indicating that the momentum is shifting in favor of the buyers, and the market might soon return to the higher region of the large channel. Therefore, investors can be hopeful that the long-term bull market is far from over.
By TradingRage
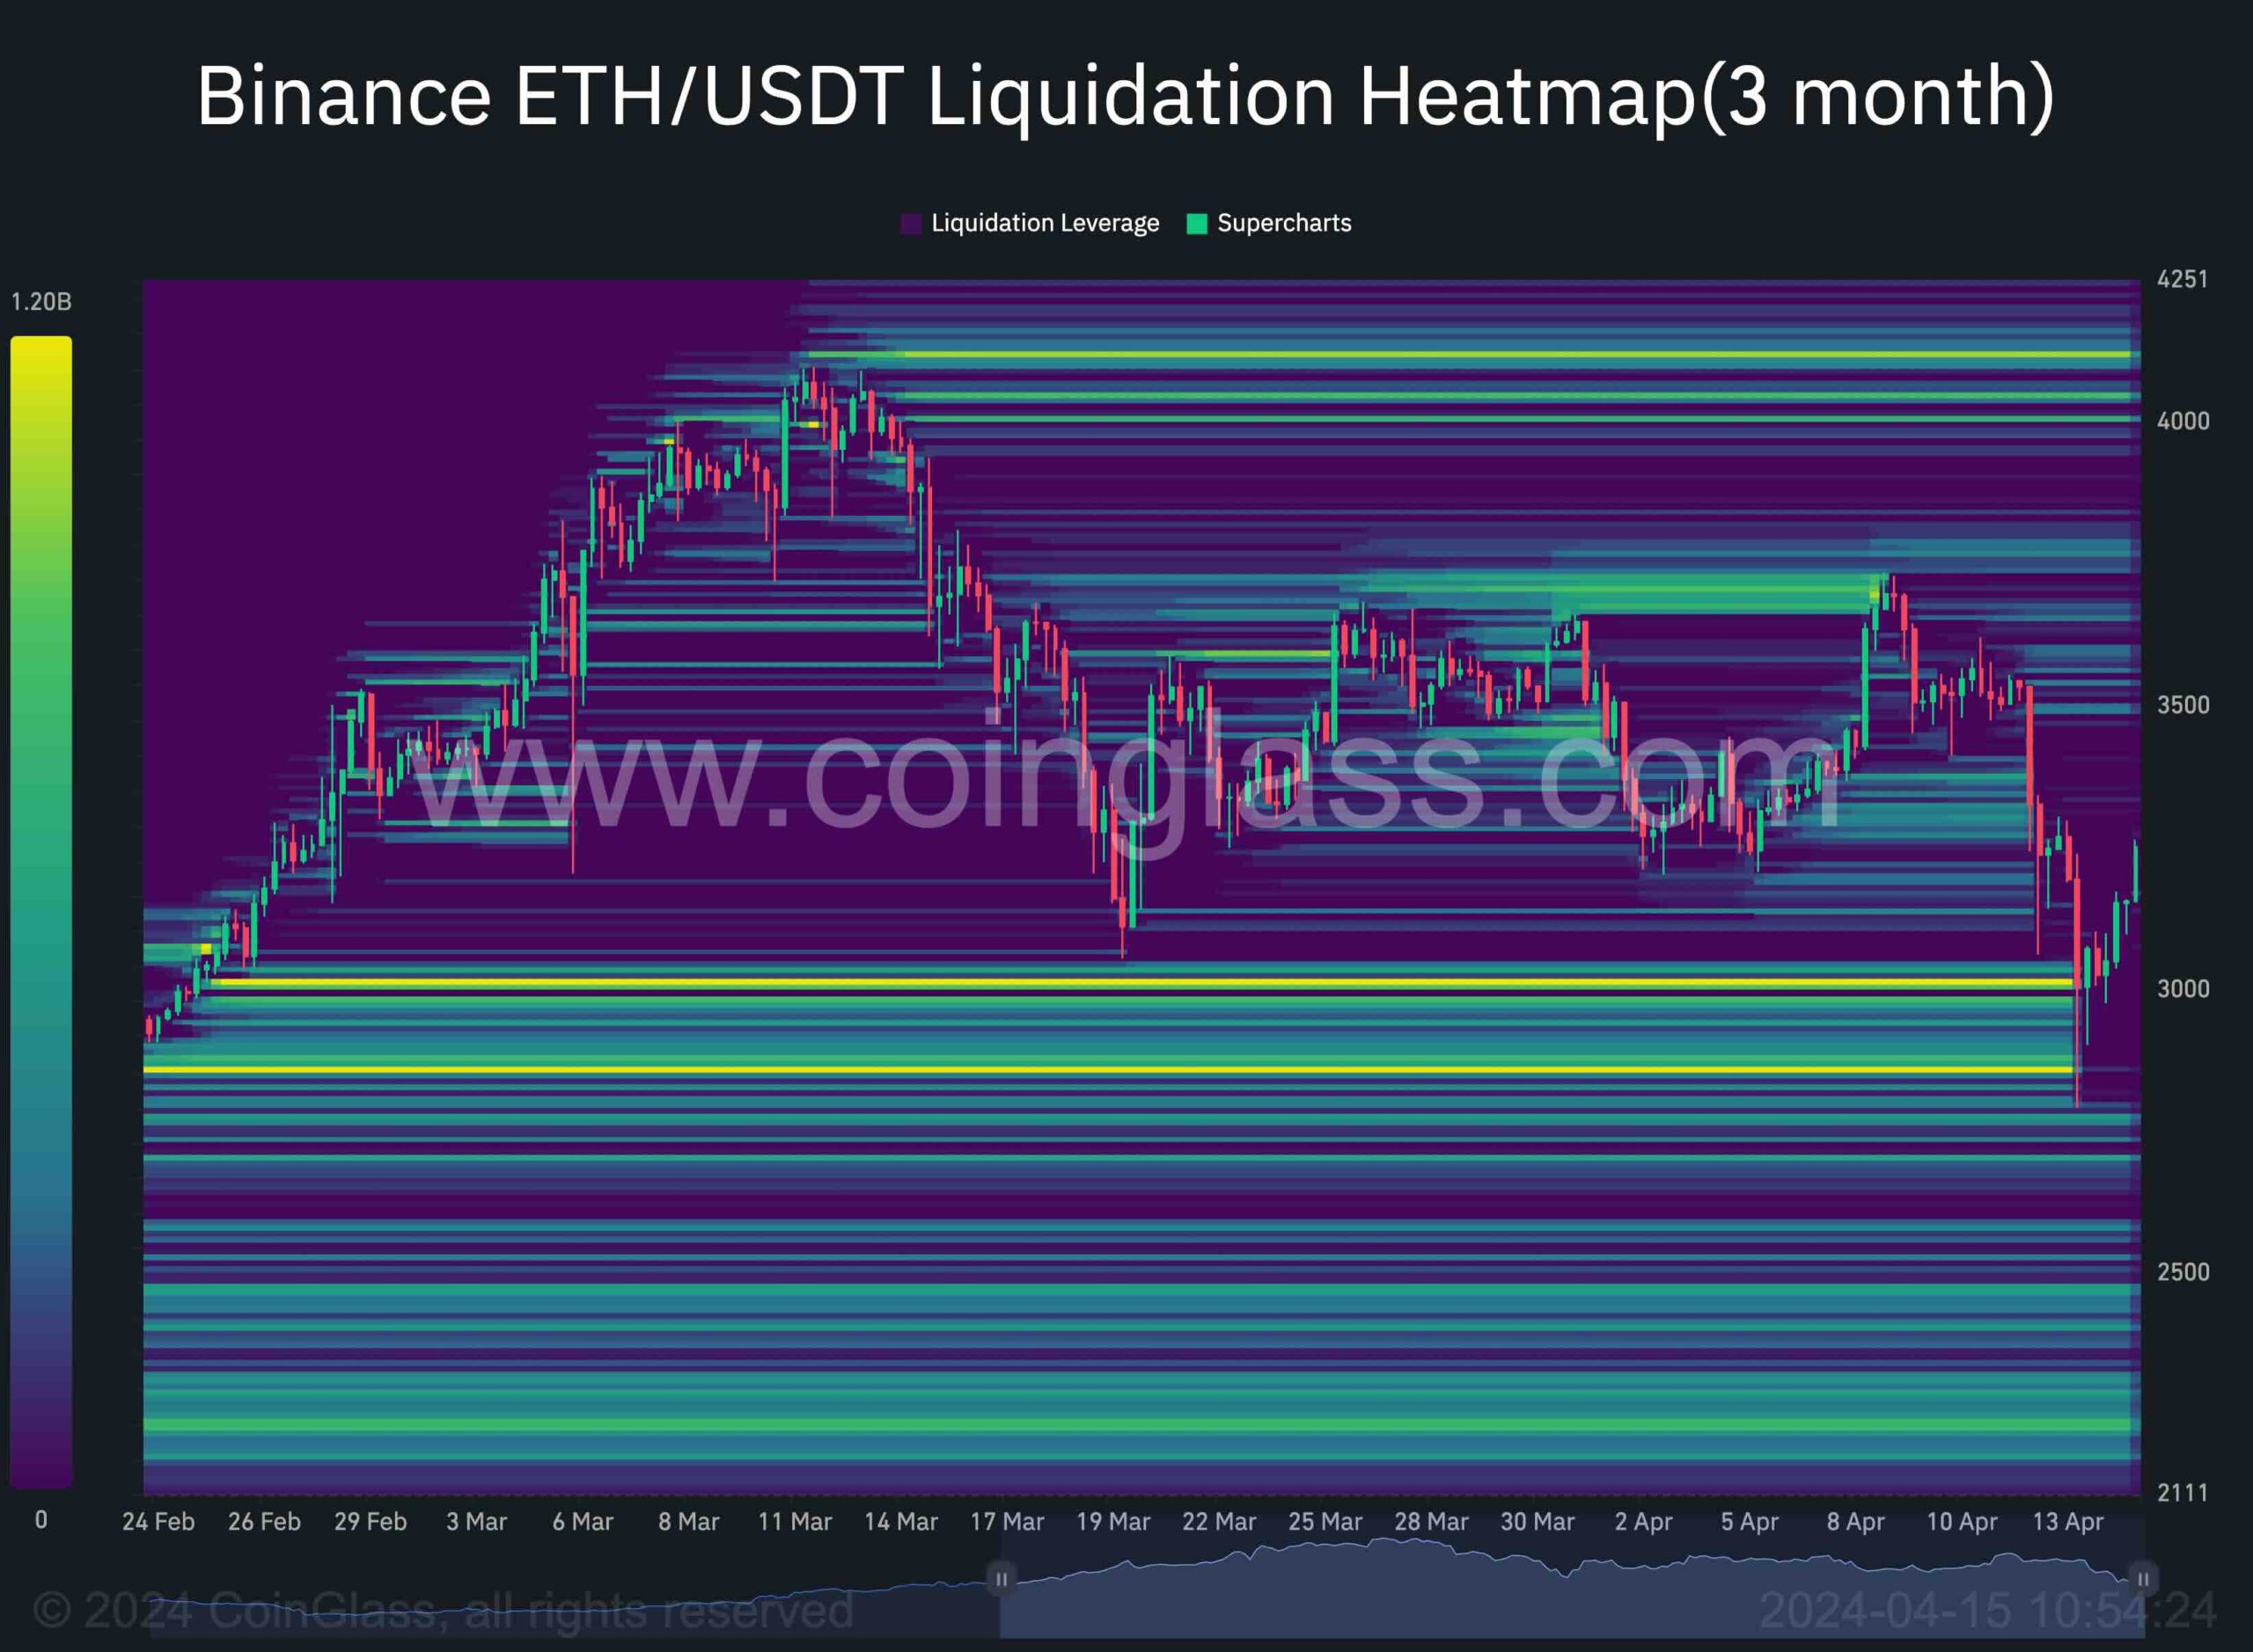
During the weekend, the price briefly dropped below the $3,000 support level. This area can be considered a critical zone from a technical analysis standpoint. Therefore, many investors might have put their stop losses there.
This chart demonstrates the Binance ETH/USDT pair’s liquidation heatmap. The price’s decline below the $3,000 level has liquidated a considerable portion of the long positions.
As the cryptocurrency is currently recovering, it can be assumed that the selling pressure resulting from these liquidations has been met with sufficient demand, and the recent drop might have been a bear trap. Therefore, the market can target liquidity above the $4,000 level if nothing unexpected happens in the short term.