Yesterday, with the announcement of the inflation rate in the United States, the market experienced a sharp decline. Ethereum briefly dropped by $103, but the bulls held the price above $1,000.
By Grizzly
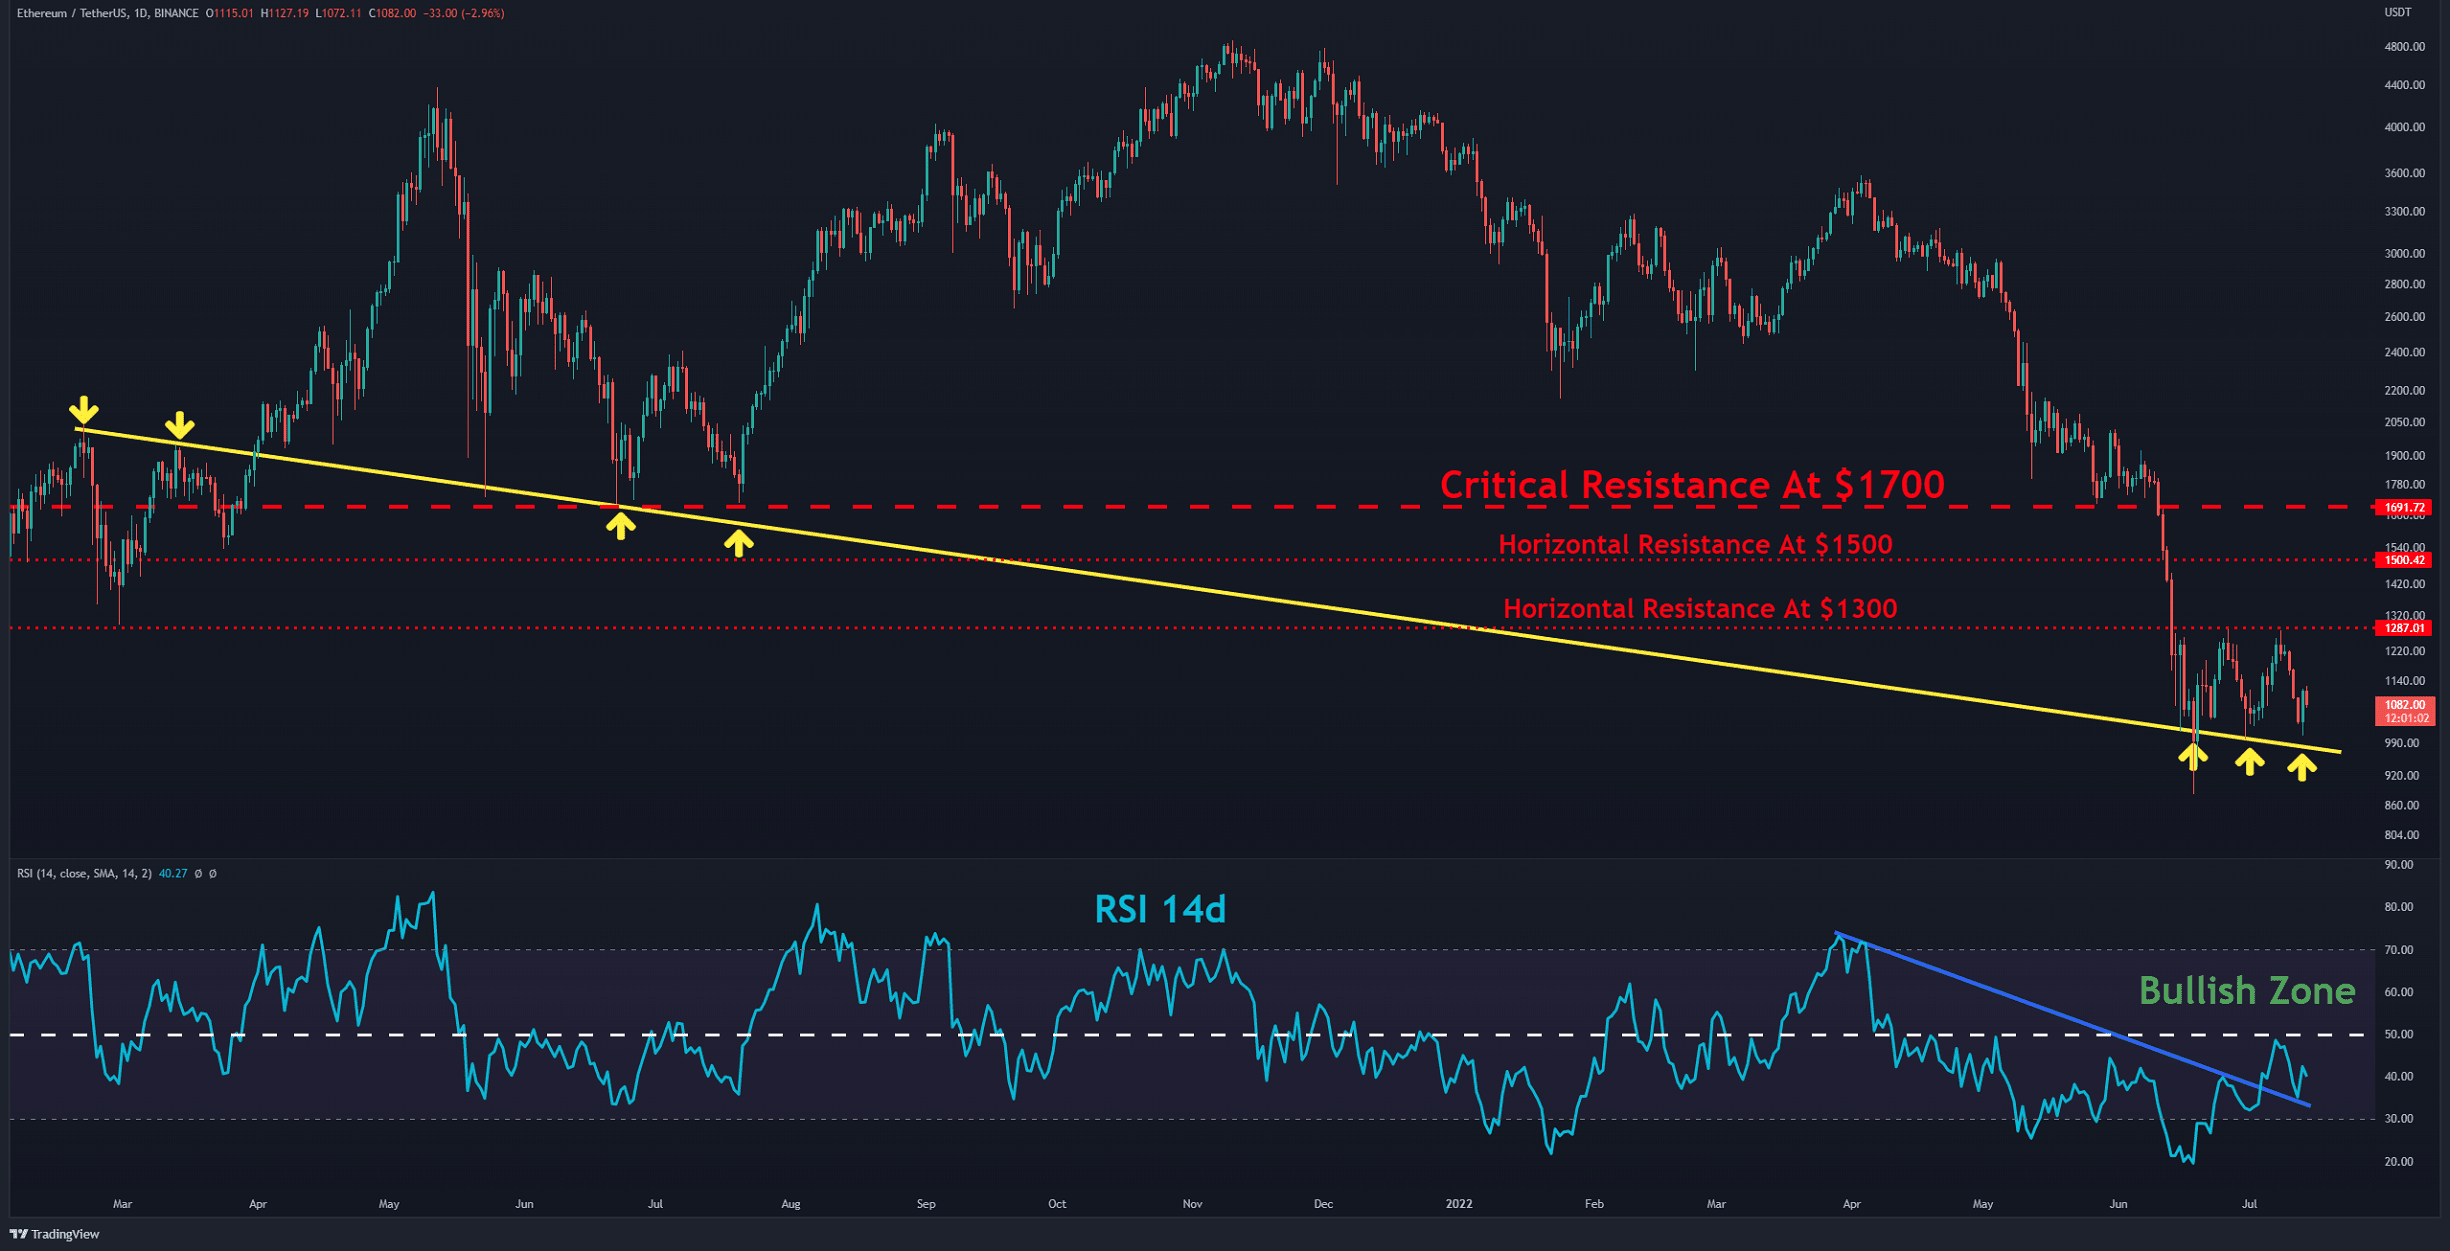
ETH trades above the descending line (in yellow) on the daily timeframe. The RSI 14D index has not been able to break above the dynamic resistance (in blue), which was rejected by the baseline showing the weakness of bulls in the market. Pushing for a short-term rally significantly depends on keeping the price above $1,000. If this level fails, another sell-off becomes much more likely.
However, in the bullish scenario, the next step for buyers is breaking the horizontal resistance at $1300 after the previous two failed attempts. This would also push the RSI into the bullish zone after three months and could propel a rally up to $1,700.
Key Support Levels: $1000 & $880
Key Resistance Levels: $1300 & $1500 & $1700
Daily Moving Averages:
MA20: $1139
MA50: $1367
MA100: $2006
MA200: $2504
The price is stuck below the horizontal resistance at 0.06 BTC (in red). Similar to the USD pair, ETH has failed in its last two attempts to break the first key resistant level. Against Bitcoin, a rally can be expected if the price can break the resistance levels at 0.06 BTC and 0.065 BTC. More importantly, the bulls must defend the horizontal support at 0.055-0.05 BTC. The forming structure looks bullish as long as buyers can hold the price above the support zone.
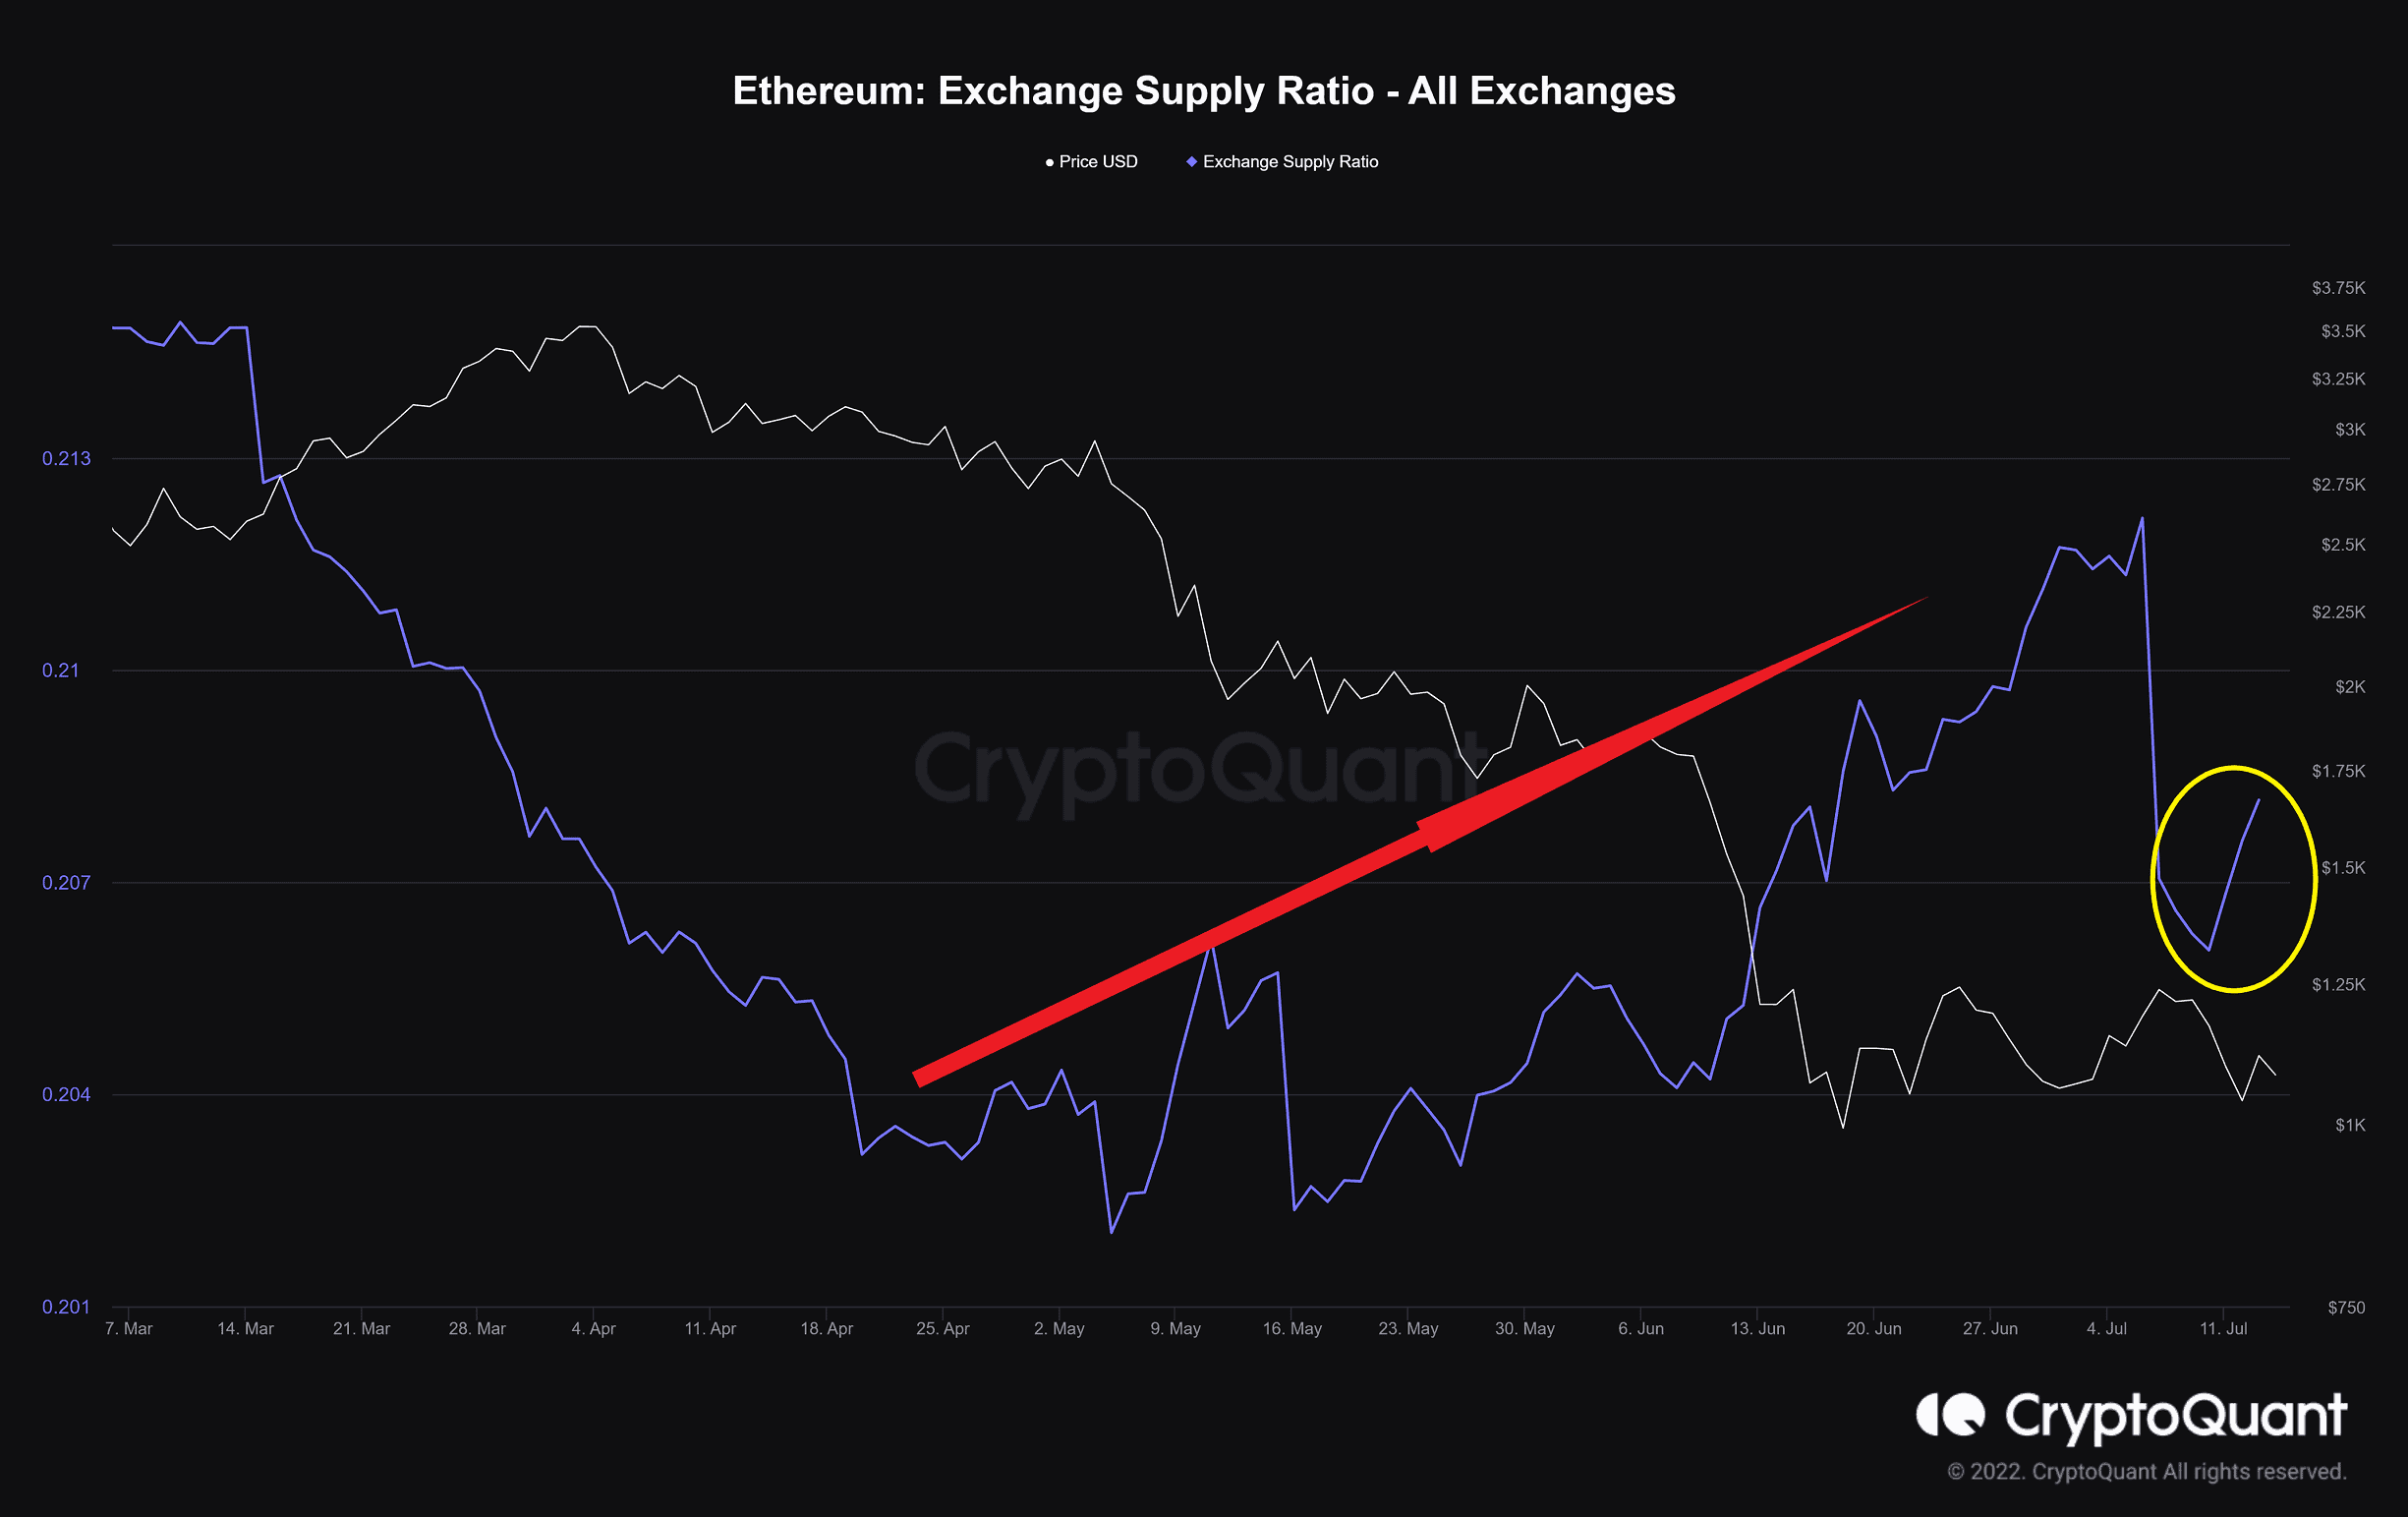
Definition: It measures the ratio of tokens in exchange wallets relative to the total supply.
This metric had an upward trend in the recent two market crashes, which confirms the panic among investors depositing their assets in exchange for selling. Last week, this index dropped slightly, which led to a temporary decline in selling pressure. However, the investors’ reaction to the macroeconomic factors (CPI news) has led to another jump in this metric.