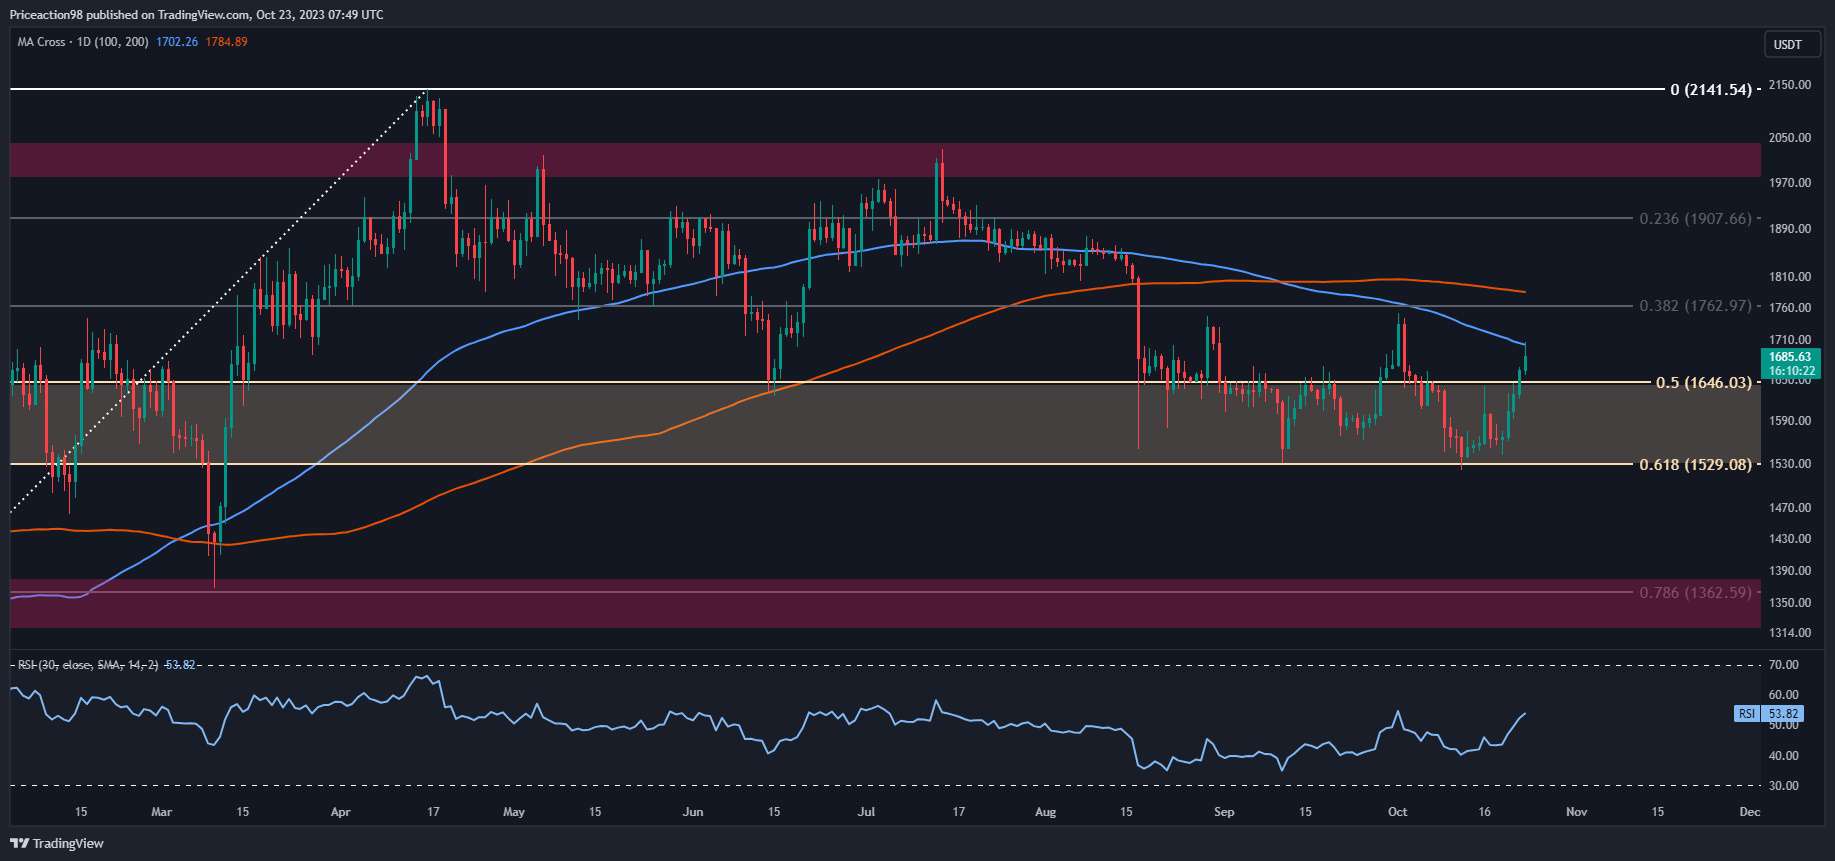
After a robust uptrend fueled by steadfast demand stabilizing the price at the significant $1.5K support region, Ethereum’s price has reached a pivotal resistance area, notably the 100-day moving average.
Should a breakthrough transpire, it could herald an imminent bullish rally.
By Shayan
Examining the daily chart, Ethereum found substantial support near the crucial $1.5K resistance, triggering an impulsive surge. While this revived hope and demand in the market, a formidable obstacle lies around $1.7K, marked by the 100-day moving average.
Accordingly, if buyers reclaim this vital level, it could pave the way for another bullish leg, potentially targeting the 200-day moving average at $1.8K.
Conversely, facing rejection might lead Ethereum into a phase of consolidation correction, marked by heightened volatility. Nevertheless, as the price has already experienced a notable surge, the market might require a temporary correction phase before initiating another impulsive move.
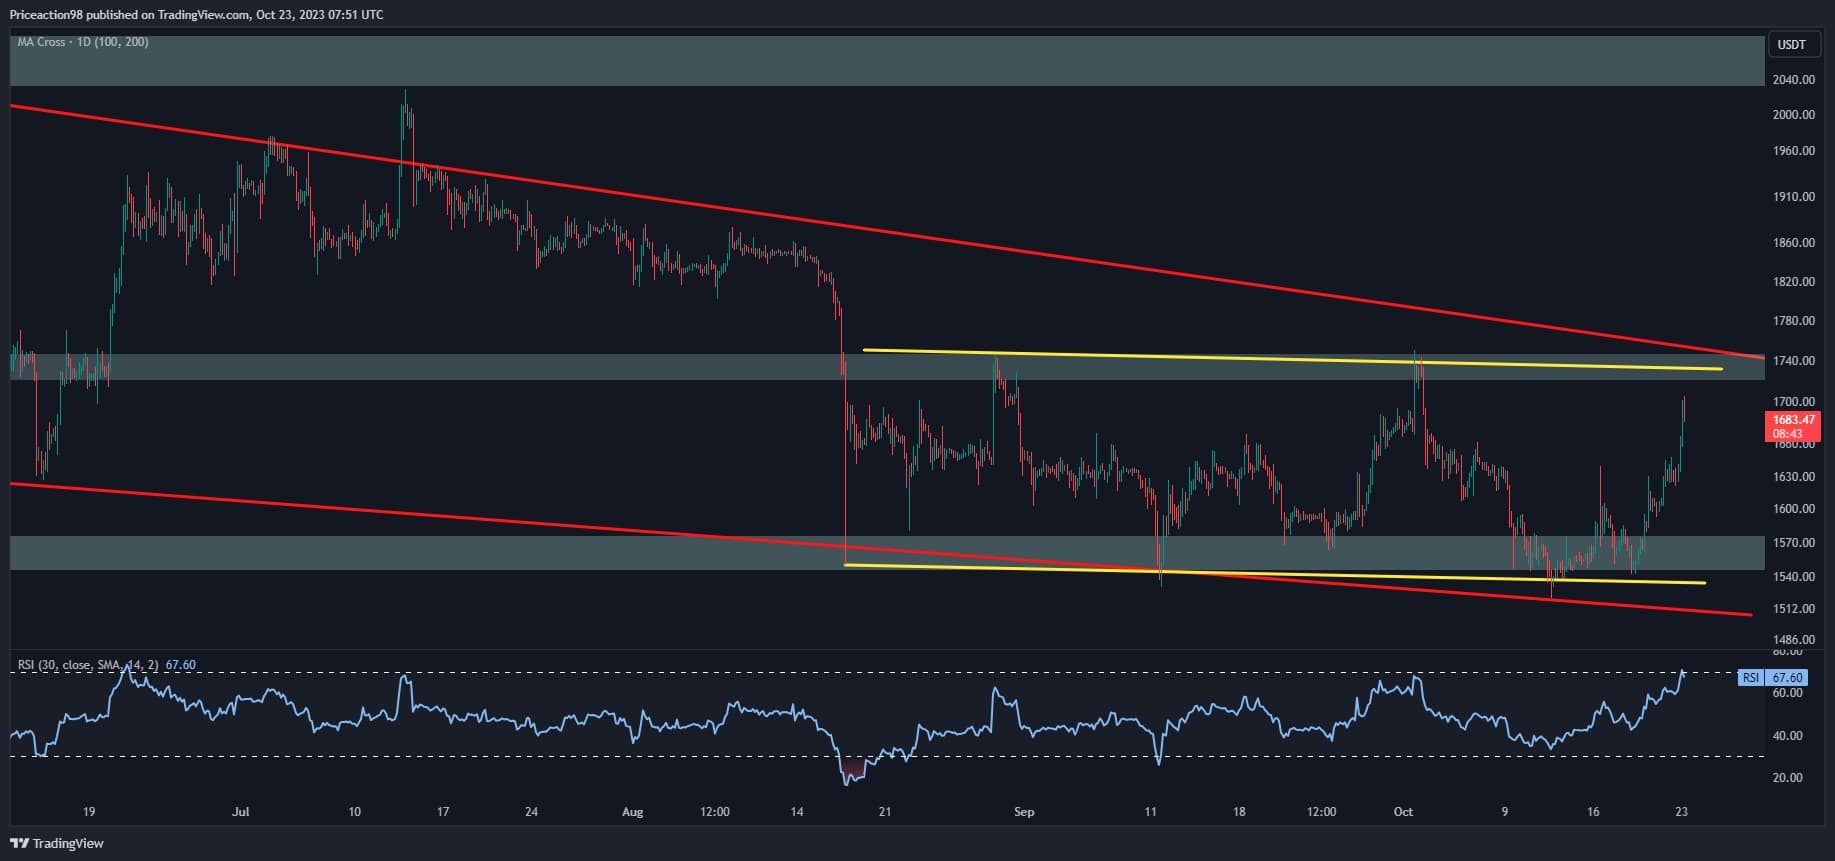
On the 4-hour chart, a distinct bullish divergence between the price and the RSI indicator and persistent demand around the $1.5K mark propelled Ethereum’s price upward.
It brought the cryptocurrency to a significant resistance zone, encompassed by the upper boundary of a short-term descending wedge (indicated by the yellow line), the static resistance level of $1.7K, and the upper trendline of a multi-month falling wedge pattern (denoted by the red line).
This convergence of crucial barriers solidifies the resistance in this price range, characterized by substantial supply. Consequently, there’s a high likelihood of a consolidation correction stage before the market decisively determines its next direction. However, if buyers ultimately manage to outpace sellers, a sudden breakout could unfold, potentially sparking a robust uptrend.
By Shayan
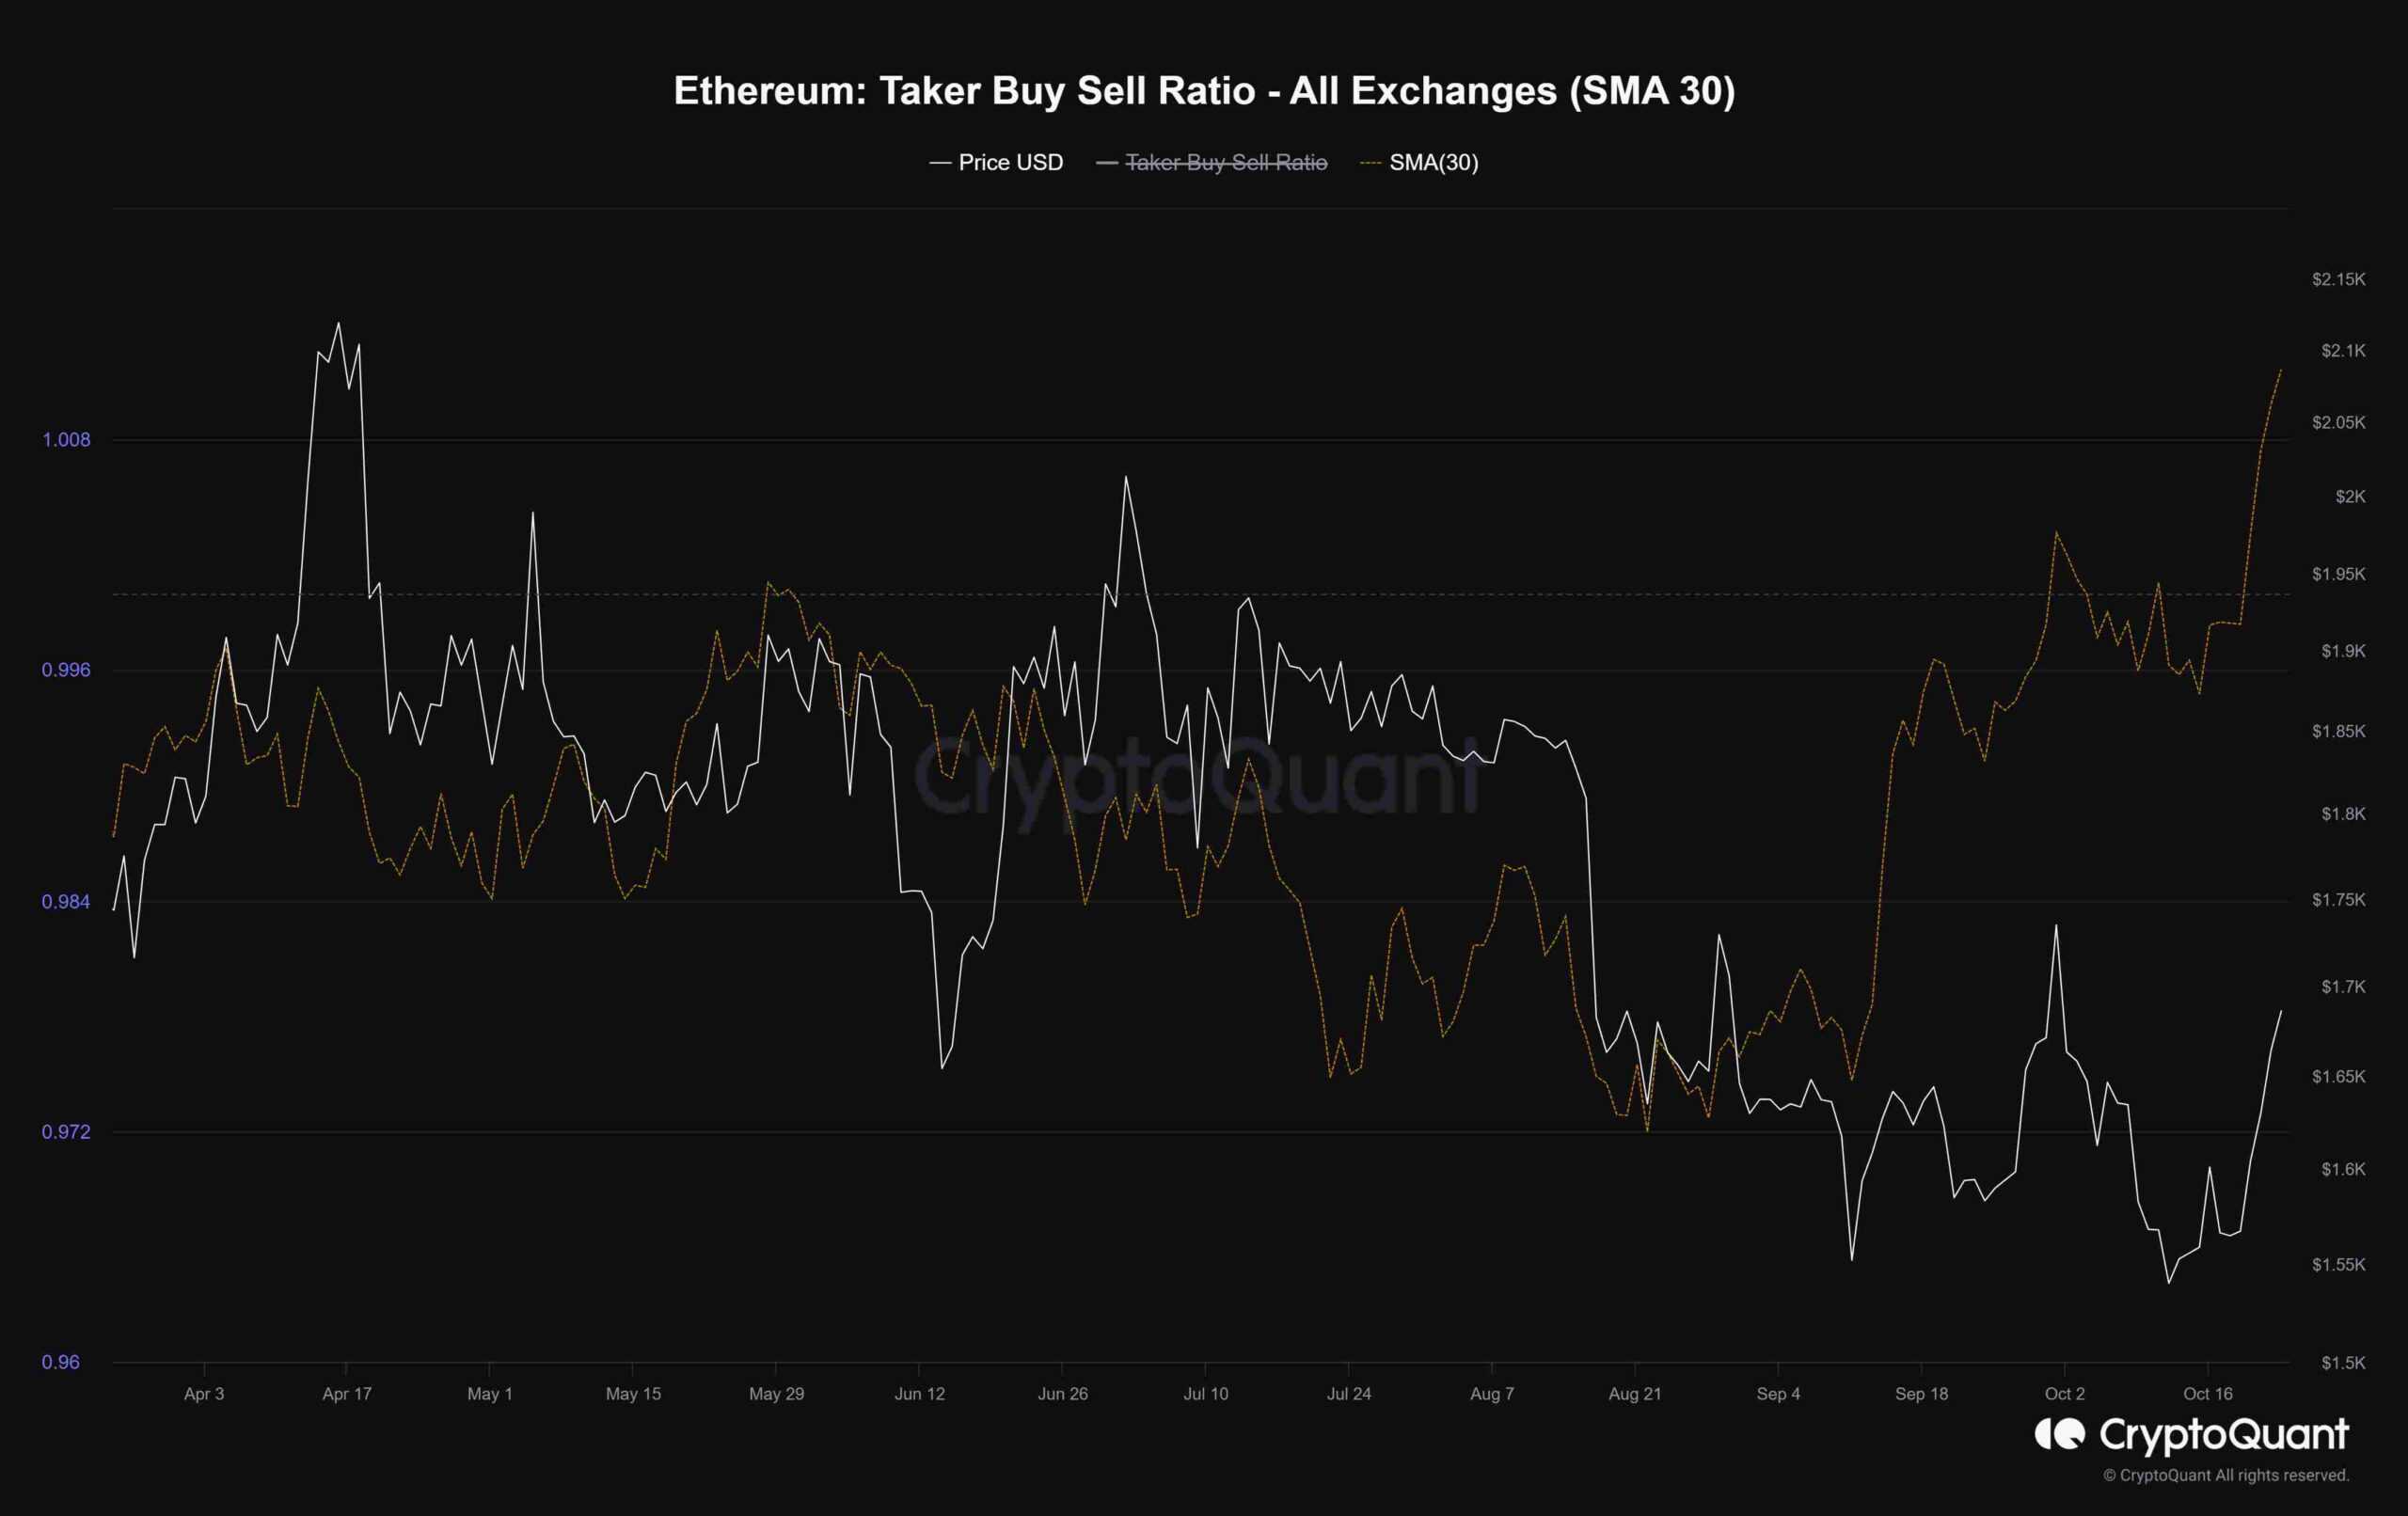
A notable shift in sentiment has occurred in the futures market following Ethereum’s recent price surges. This chart illustrates the 30-day moving average of the Ethereum Taker Buy-Sell ratio, a crucial metric for gauging sentiment in futures trading. This metric helps discern whether buyers or sellers are executing more aggressive orders collectively.
As depicted in the chart, the taker buy-sell ratio has grown substantially, surpassing the value of 1. This surge signifies a prevalent bullish sentiment in the futures market. This upward trend aligns seamlessly with Ethereum’s recent impulsive surge, propelling it toward the $1.7K resistance level.
However, given the significant surge in this metric, the market is anticipated to require a temporary pause in the trend. This pause could lead to a short-term correction stage before the market initiates another substantial upward movement. It’s crucial to observe if the ratio maintains this momentum or reverses in the upcoming days. If the bullish momentum wanes, it could lead to increased market volatility.