In the wake of a remarkable surge that propelled Ethereum to a yearly high of $2.4K, the subsequent encounter with selling pressure resulted in a notable rejection.
Presently, ETH finds itself within a critical price range, and a breakout from this range will likely chart the course for the cryptocurrency’s next moves.
By Shayan
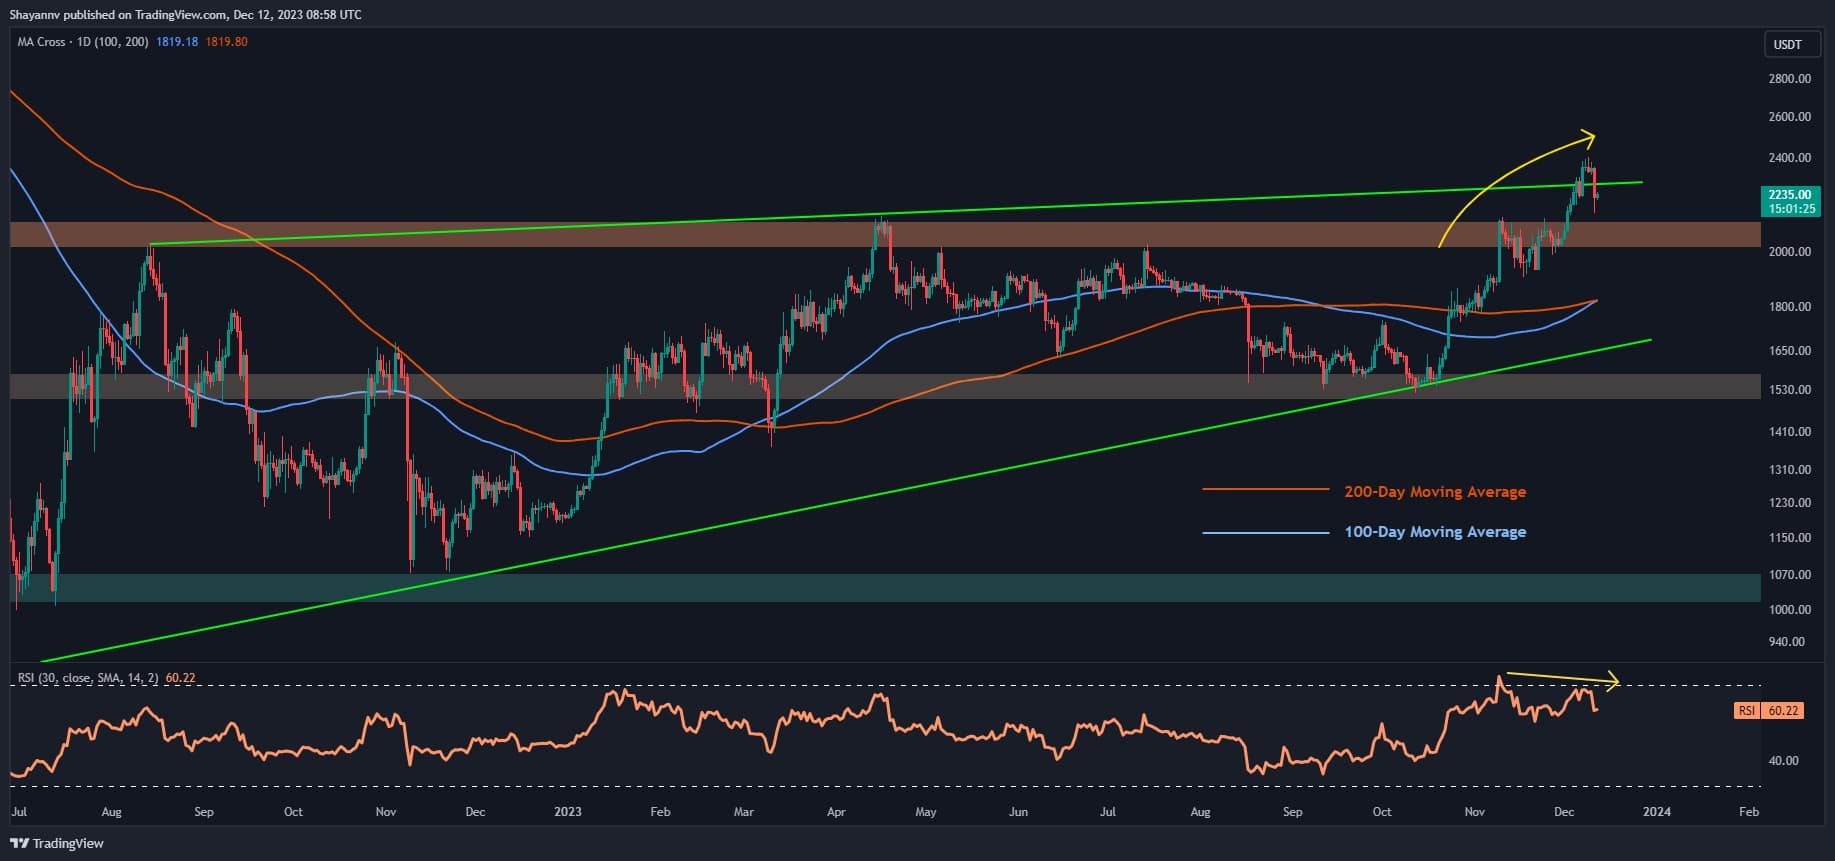
Ethereum has displayed significant bullish signals, with the price exhibiting a robust uptrend that retraced above the pivotal resistance level of $2.1K. Despite a temporary setback, the cryptocurrency maintained its upward trajectory, reaching an annual peak of $2.4K. This PA suggests a revived bullish market, reflecting renewed demand and heightened buying interest among market participants.
It’s crucial to acknowledge that short-term corrections typically follow each bullish surge. As evident from the chart, Ethereum’s upward momentum faced rejection upon hitting the upper boundary of the wedge, resulting in a 10% decline.
The divergence between the price and the RSI indicator also supports the likelihood of a brief retracement before initiating the next bullish move. In such a scenario, the $2K support zone is anticipated to be Ethereum’s next destination in the daily timeframe.
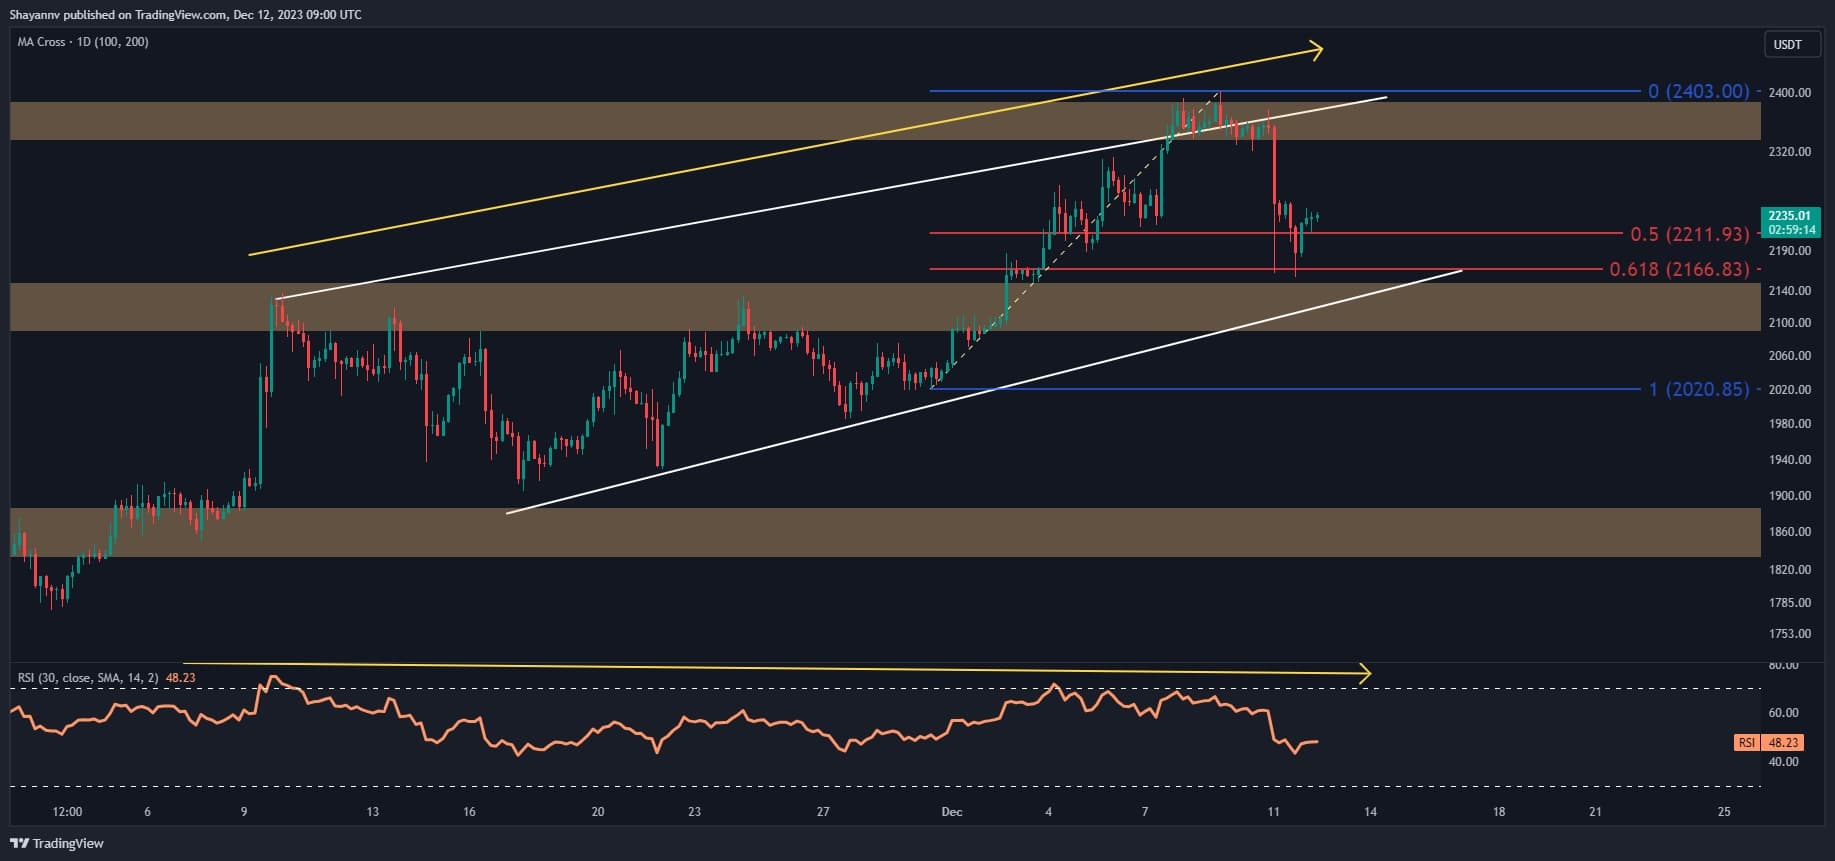
A closer examination of the 4-hour chart reveals that Ethereum’s robust upward movement lost momentum upon encountering a pivotal resistance zone, encompassing the $2.4K price range and the upper threshold of the ascending wedge pattern. On the other hand, the expanded bearish divergence between the price and RSI played a crucial role in triggering a substantial rejection.
However, Ethereum has already reached a crucial support region, encompassing the price range between 0.5 ($2,211) and 0.618 ($2,166) Fibonacci levels and the static support level of $2K. A breach below these critical support levels may signal a significant downturn in the market.
Despite the prevailing bullish sentiment and apparent control by buyers in the current market dynamics, there exists a notable likelihood of a temporary consolidation correction phase in the short term, accompanied by increased volatility.
By Shayan
Ethereum’s price has recently surged, reclaiming the $2,1K price range, sparking expectations among market participants of the onset of a new long-term bull market. Accordingly, examining the sentiment in the futures market can offer valuable insights into Ethereum’s overall prospects.
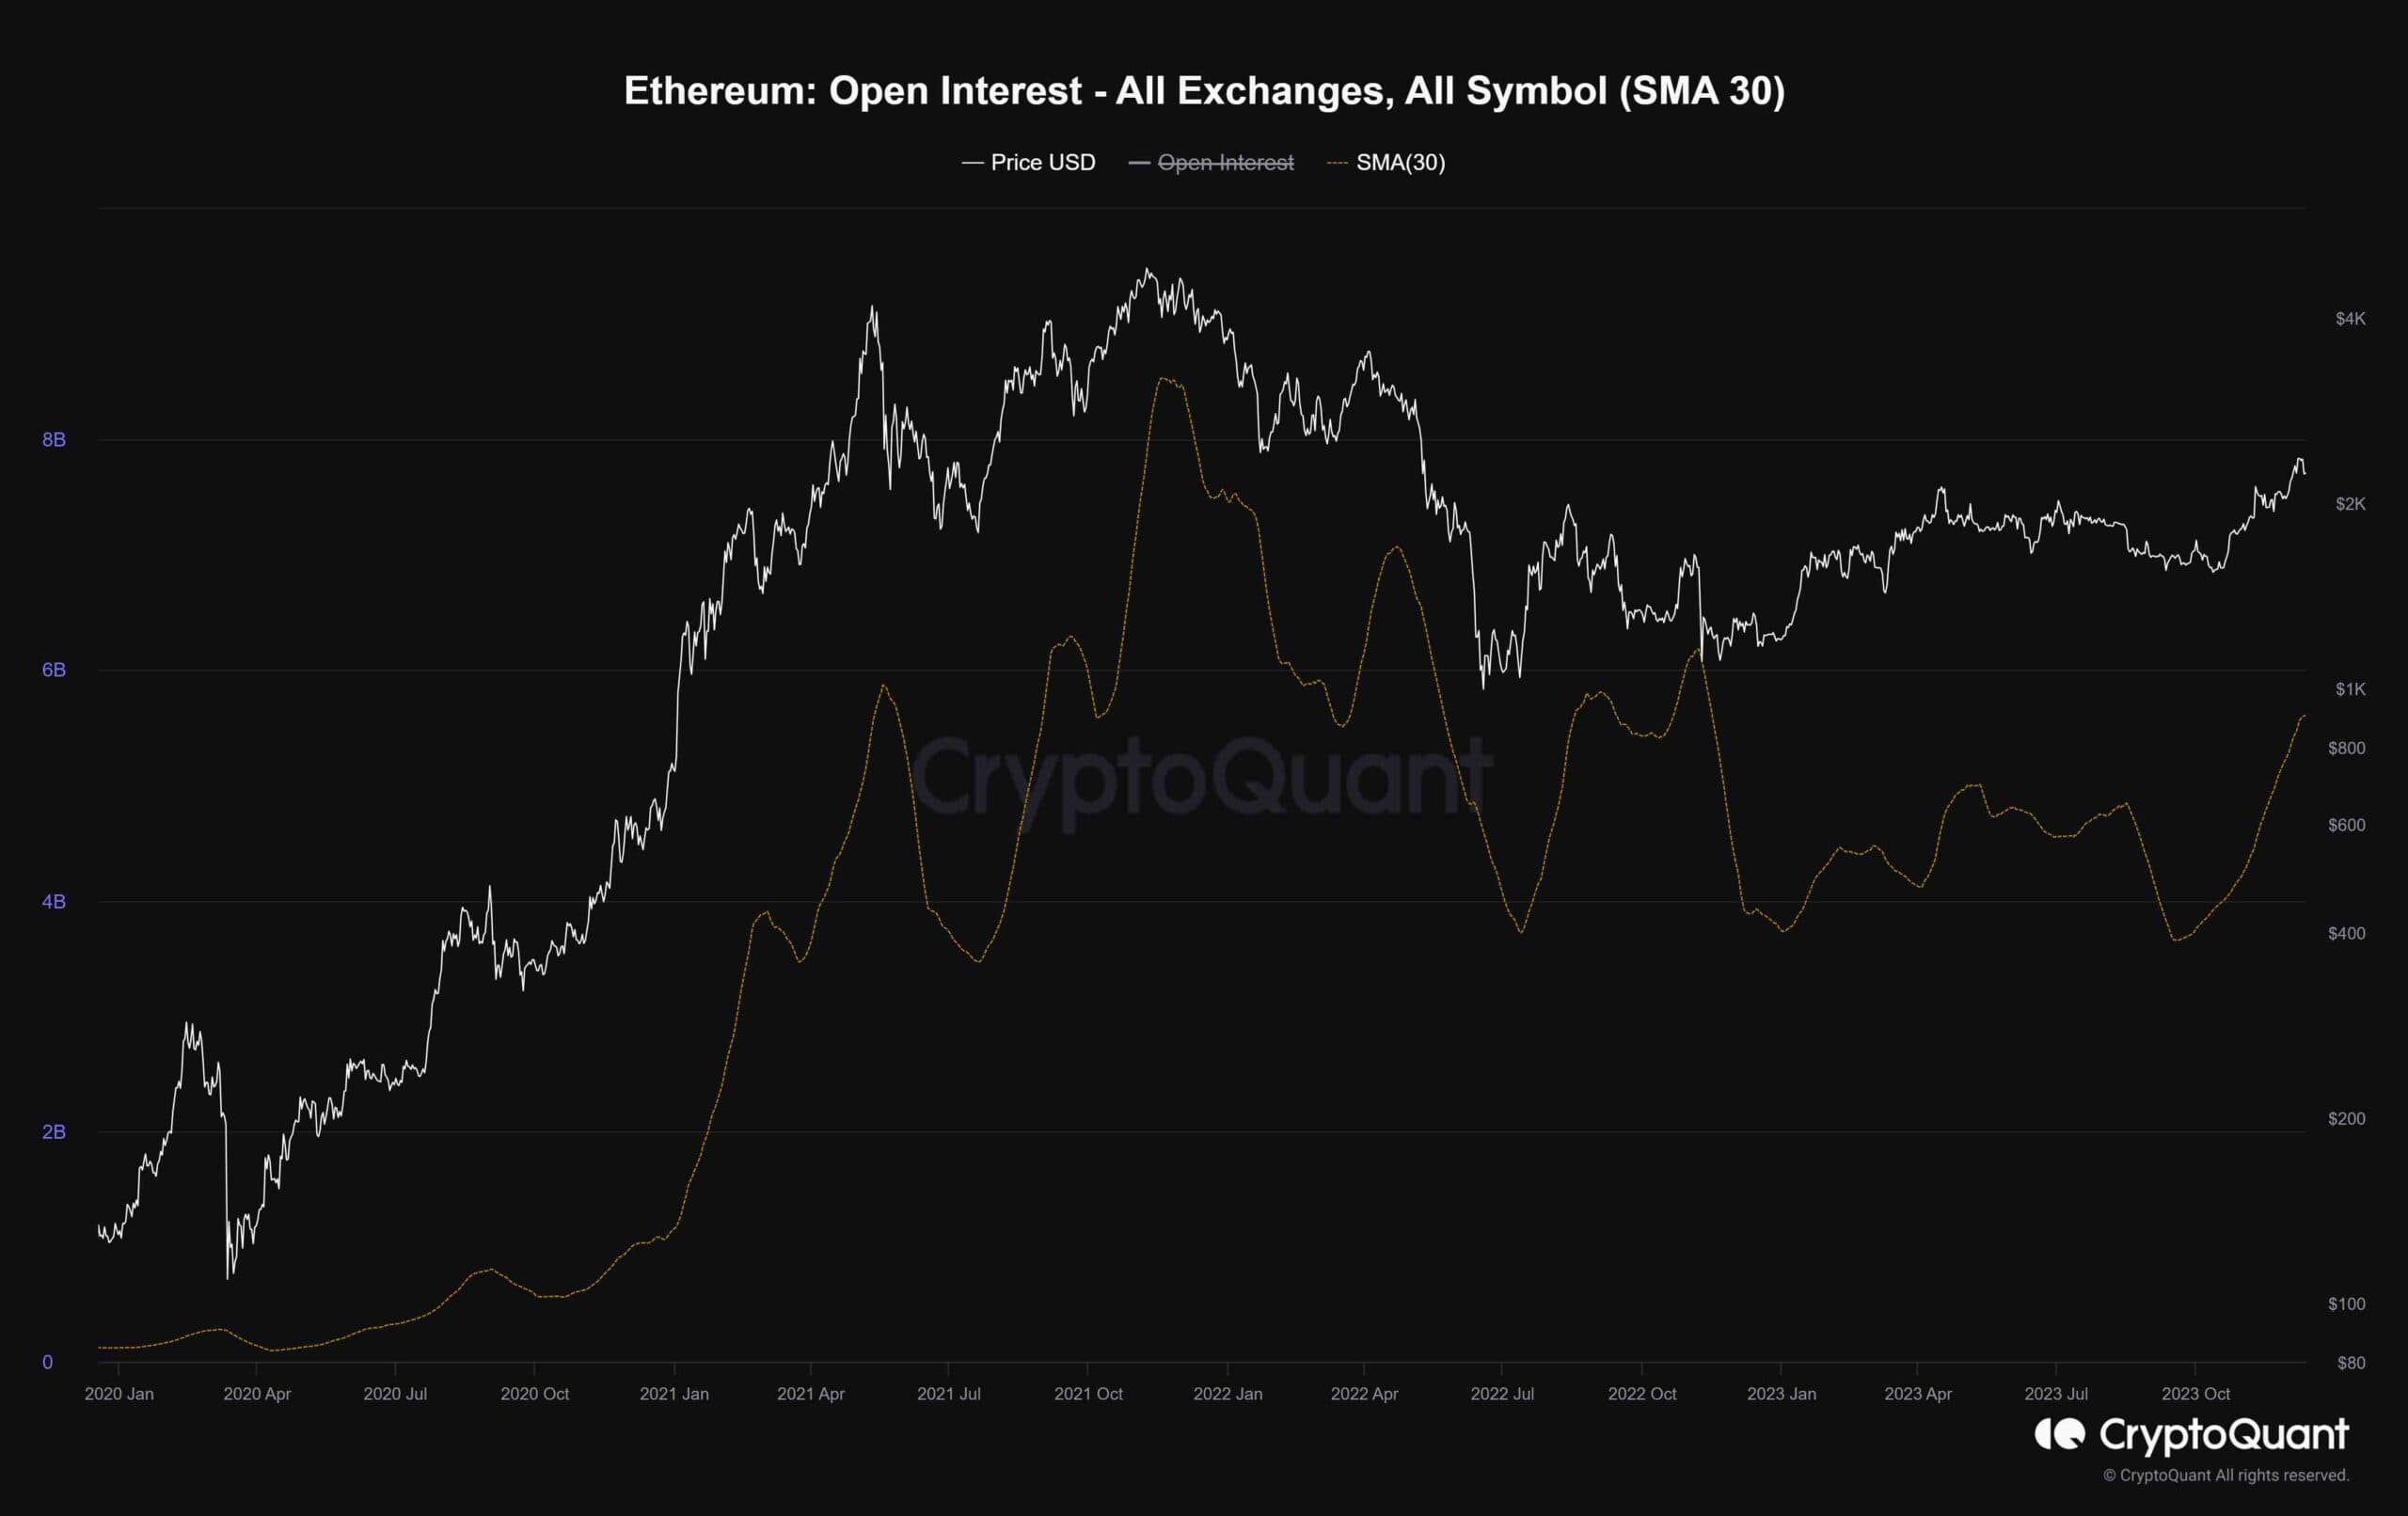
This chart illustrates Ethereum’s open interest, a measure of the number of open perpetual futures contracts on a daily basis. Typically, higher values indicate increased volatility and potential bearish reversals, while lower values suggest a more sustainable trend. As the chart clearly illustrates, a gradual rise in the Open Interest metric often accompanies bullish market phases. However, if the metric reaches elevated levels, it could signal a potential major market reversal.
The open interest has been on an upward trajectory but has yet to reach values observed during the all-time highs. Consequently, while corrections are always possible, the futures market is still far from overheating. The current bullish trend, supported by moderate levels of open interest, will likely persist in the coming weeks. Monitoring this metric will be essential to gauge potential shifts in market sentiment and adapt strategies accordingly.