After a brief uptick, Ethereum faced a significant rejection, causing the price to retreat towards the critical support zone at $1.5K.
Currently, there is a strong attempt to break below this crucial support. If successful, the market may experience sharp declines.
By Shayan
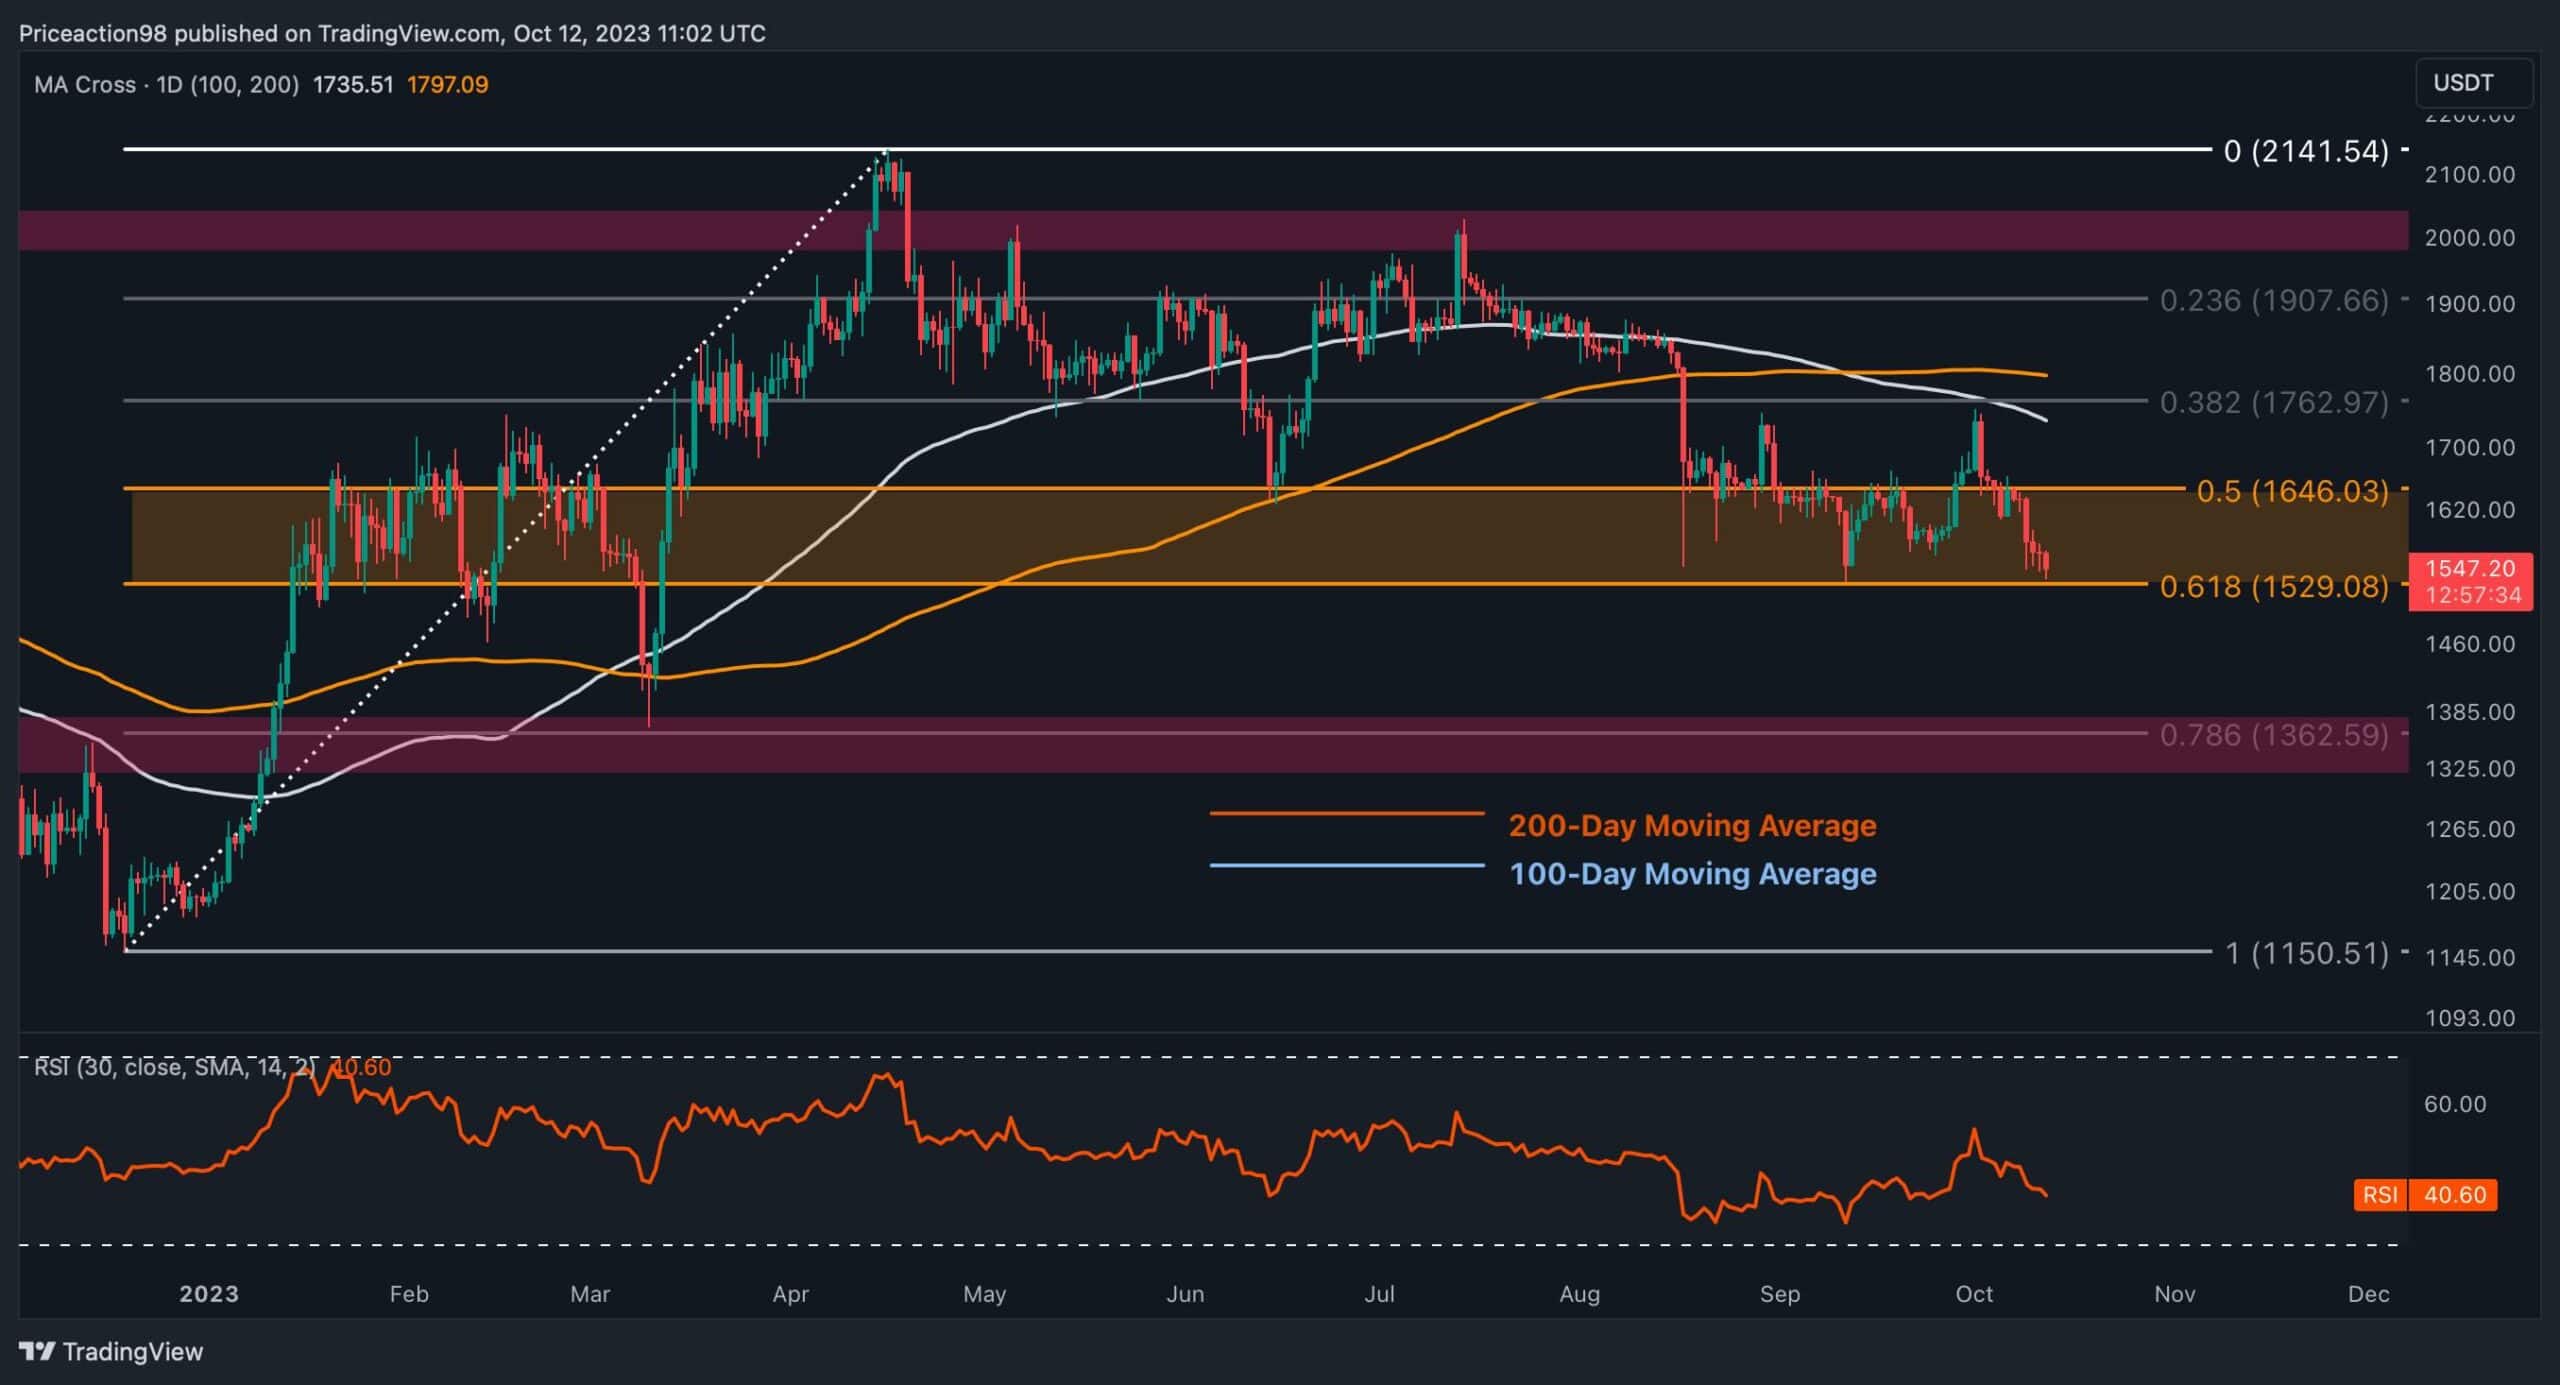
Looking at the daily chart, Ethereum initially showed strong bullish momentum after finding support around the $1.5K range. However, upon reaching the 100-day moving average at around $1.7K, Ethereum was rejected, leading to a steep downtrend.
This downtrend returned to the broken 100-day moving average, indicating a highly bearish trajectory for ETH’s price. It has now revisited its previous major swing low at $1529, aligning with the significant support level of the 61.8% Fibonacci threshold. This zone serves as the final defense for the bulls, and a breach below it could trigger a rapid market cascade.
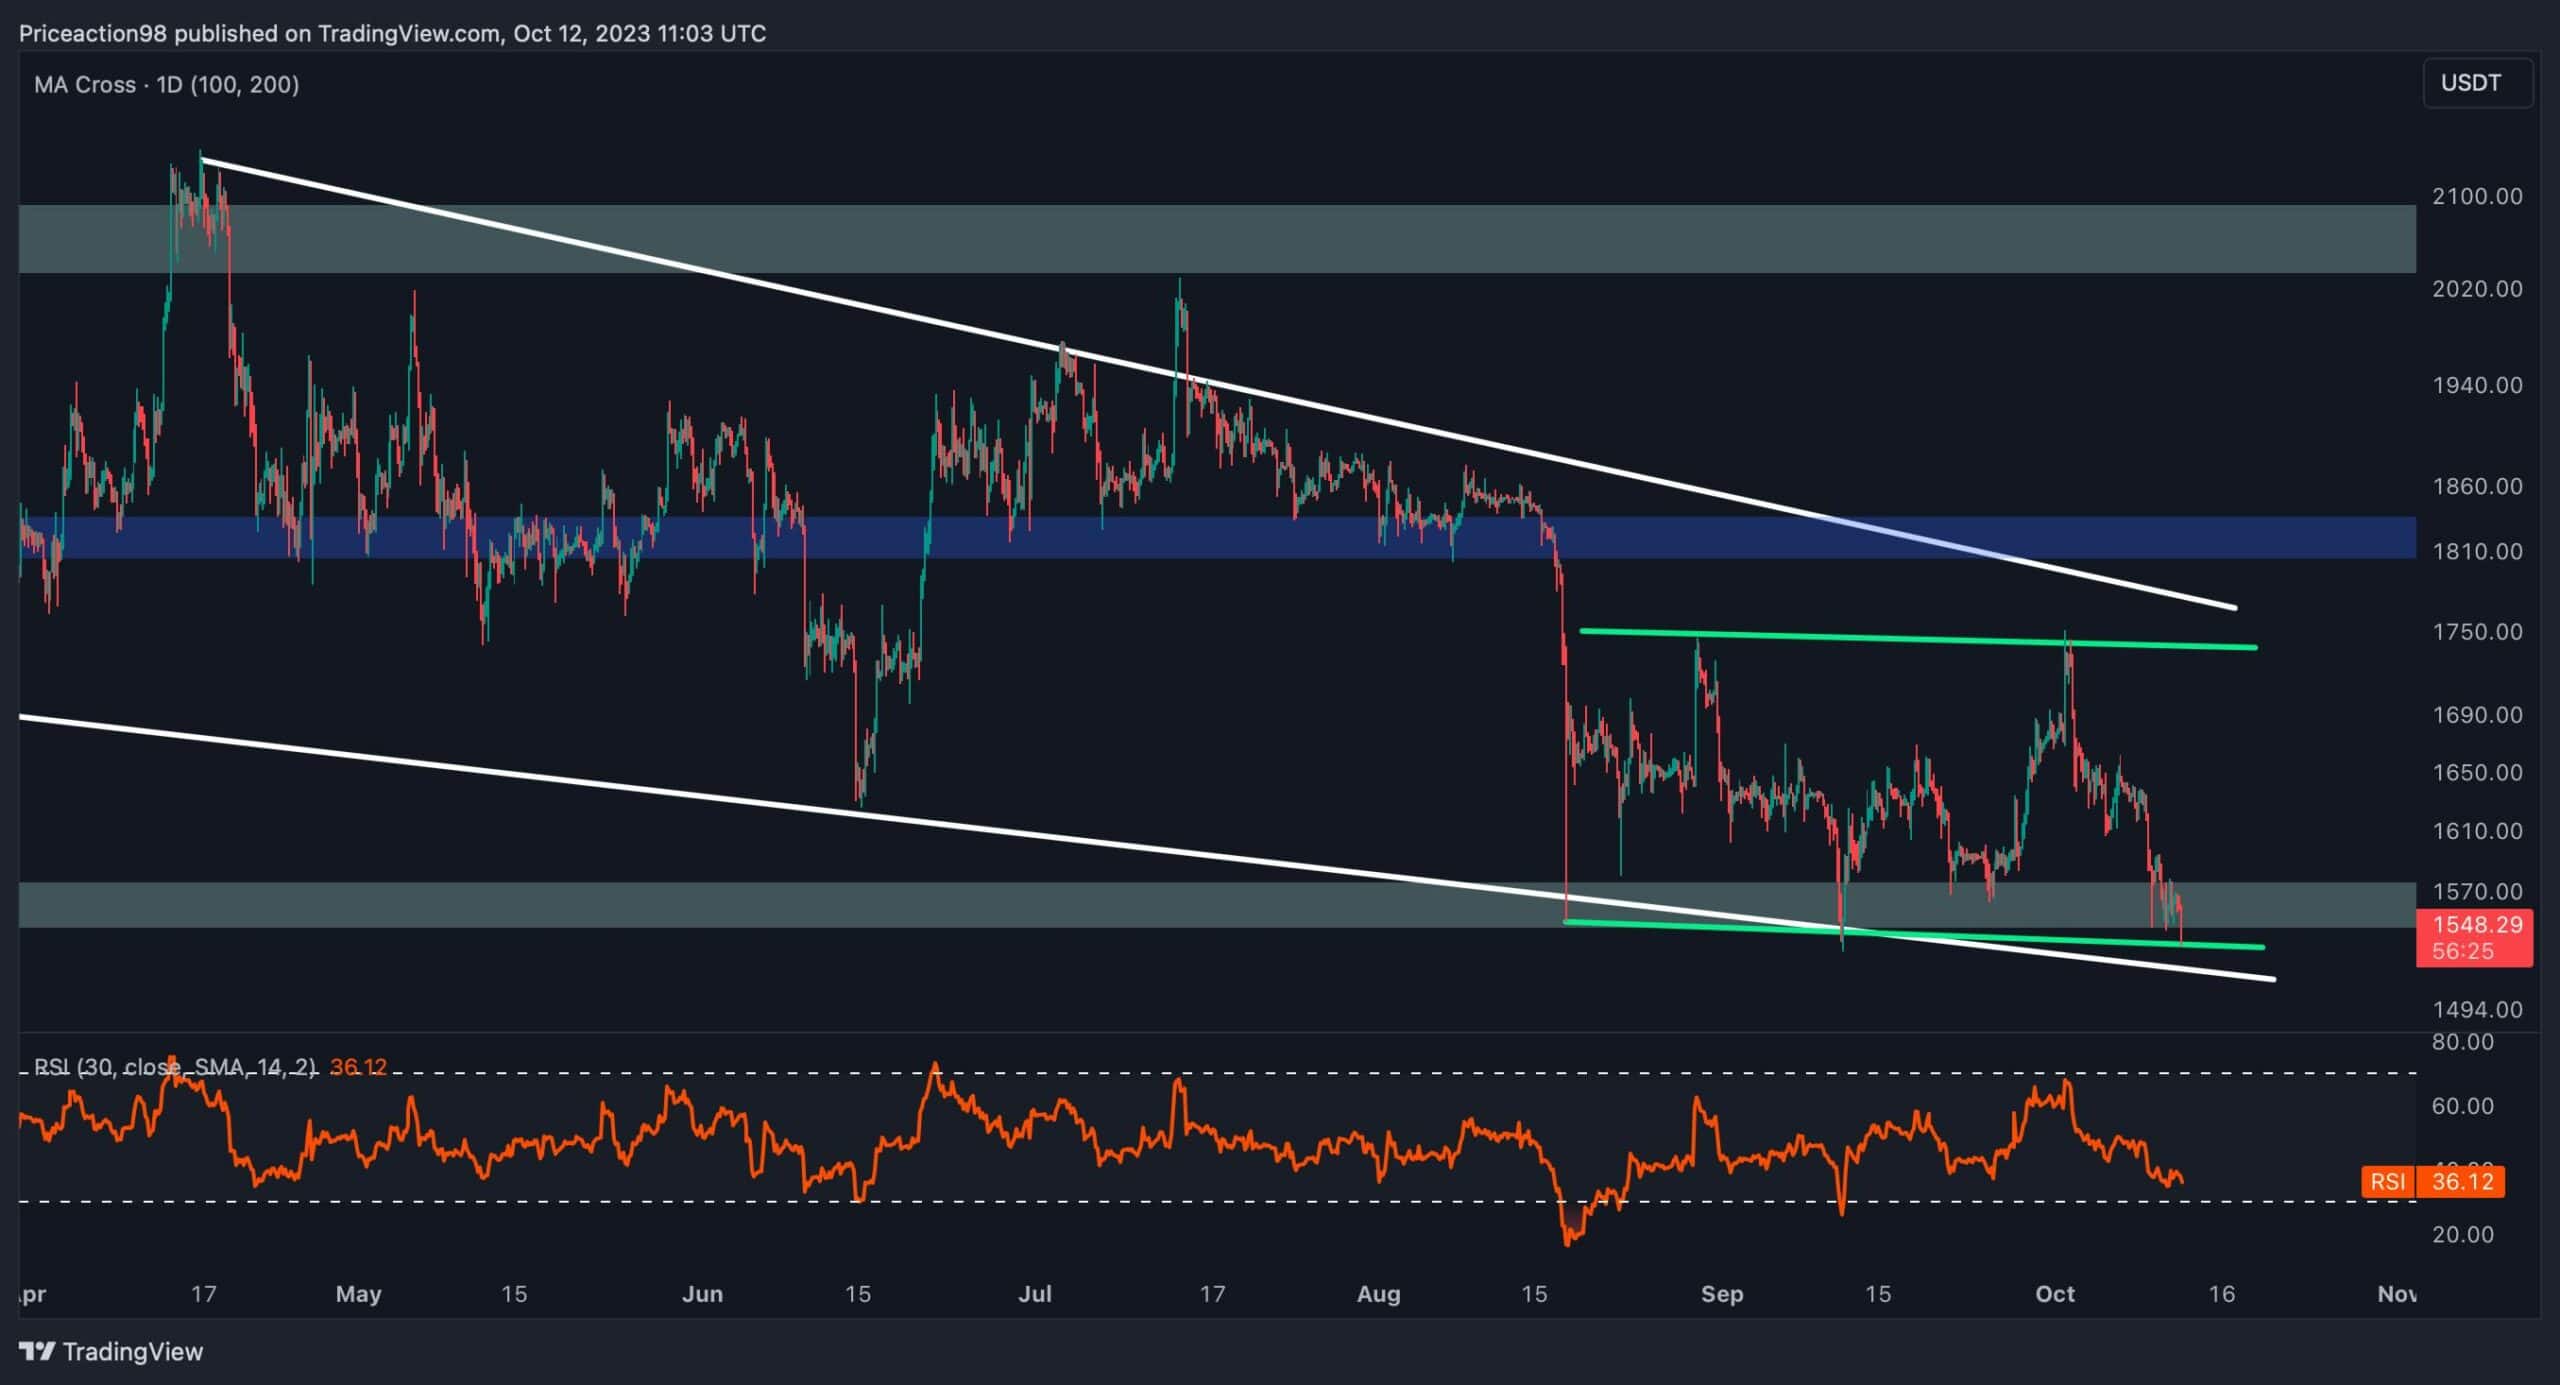
Analyzing the 4-hour chart, we can see a period of sideways consolidation marked by a descending wedge pattern. This consolidation range is bounded by the significant $1.5K support and the notable $1.7K resistance. However, the price recently faced rejection from the upper boundary of this range, leading to a steep downtrend that approached the lower boundary.
The market is on the verge of breaking below the $1.5K support, with prevailing bearish sentiment strengthening the sellers’ position. A break below this support has become a distinct possibility.
It’s important to note that if buyers manage to overpower the sellers, a sudden reversal could occur, potentially resulting in the liquidation of numerous short positions.
By Shayan
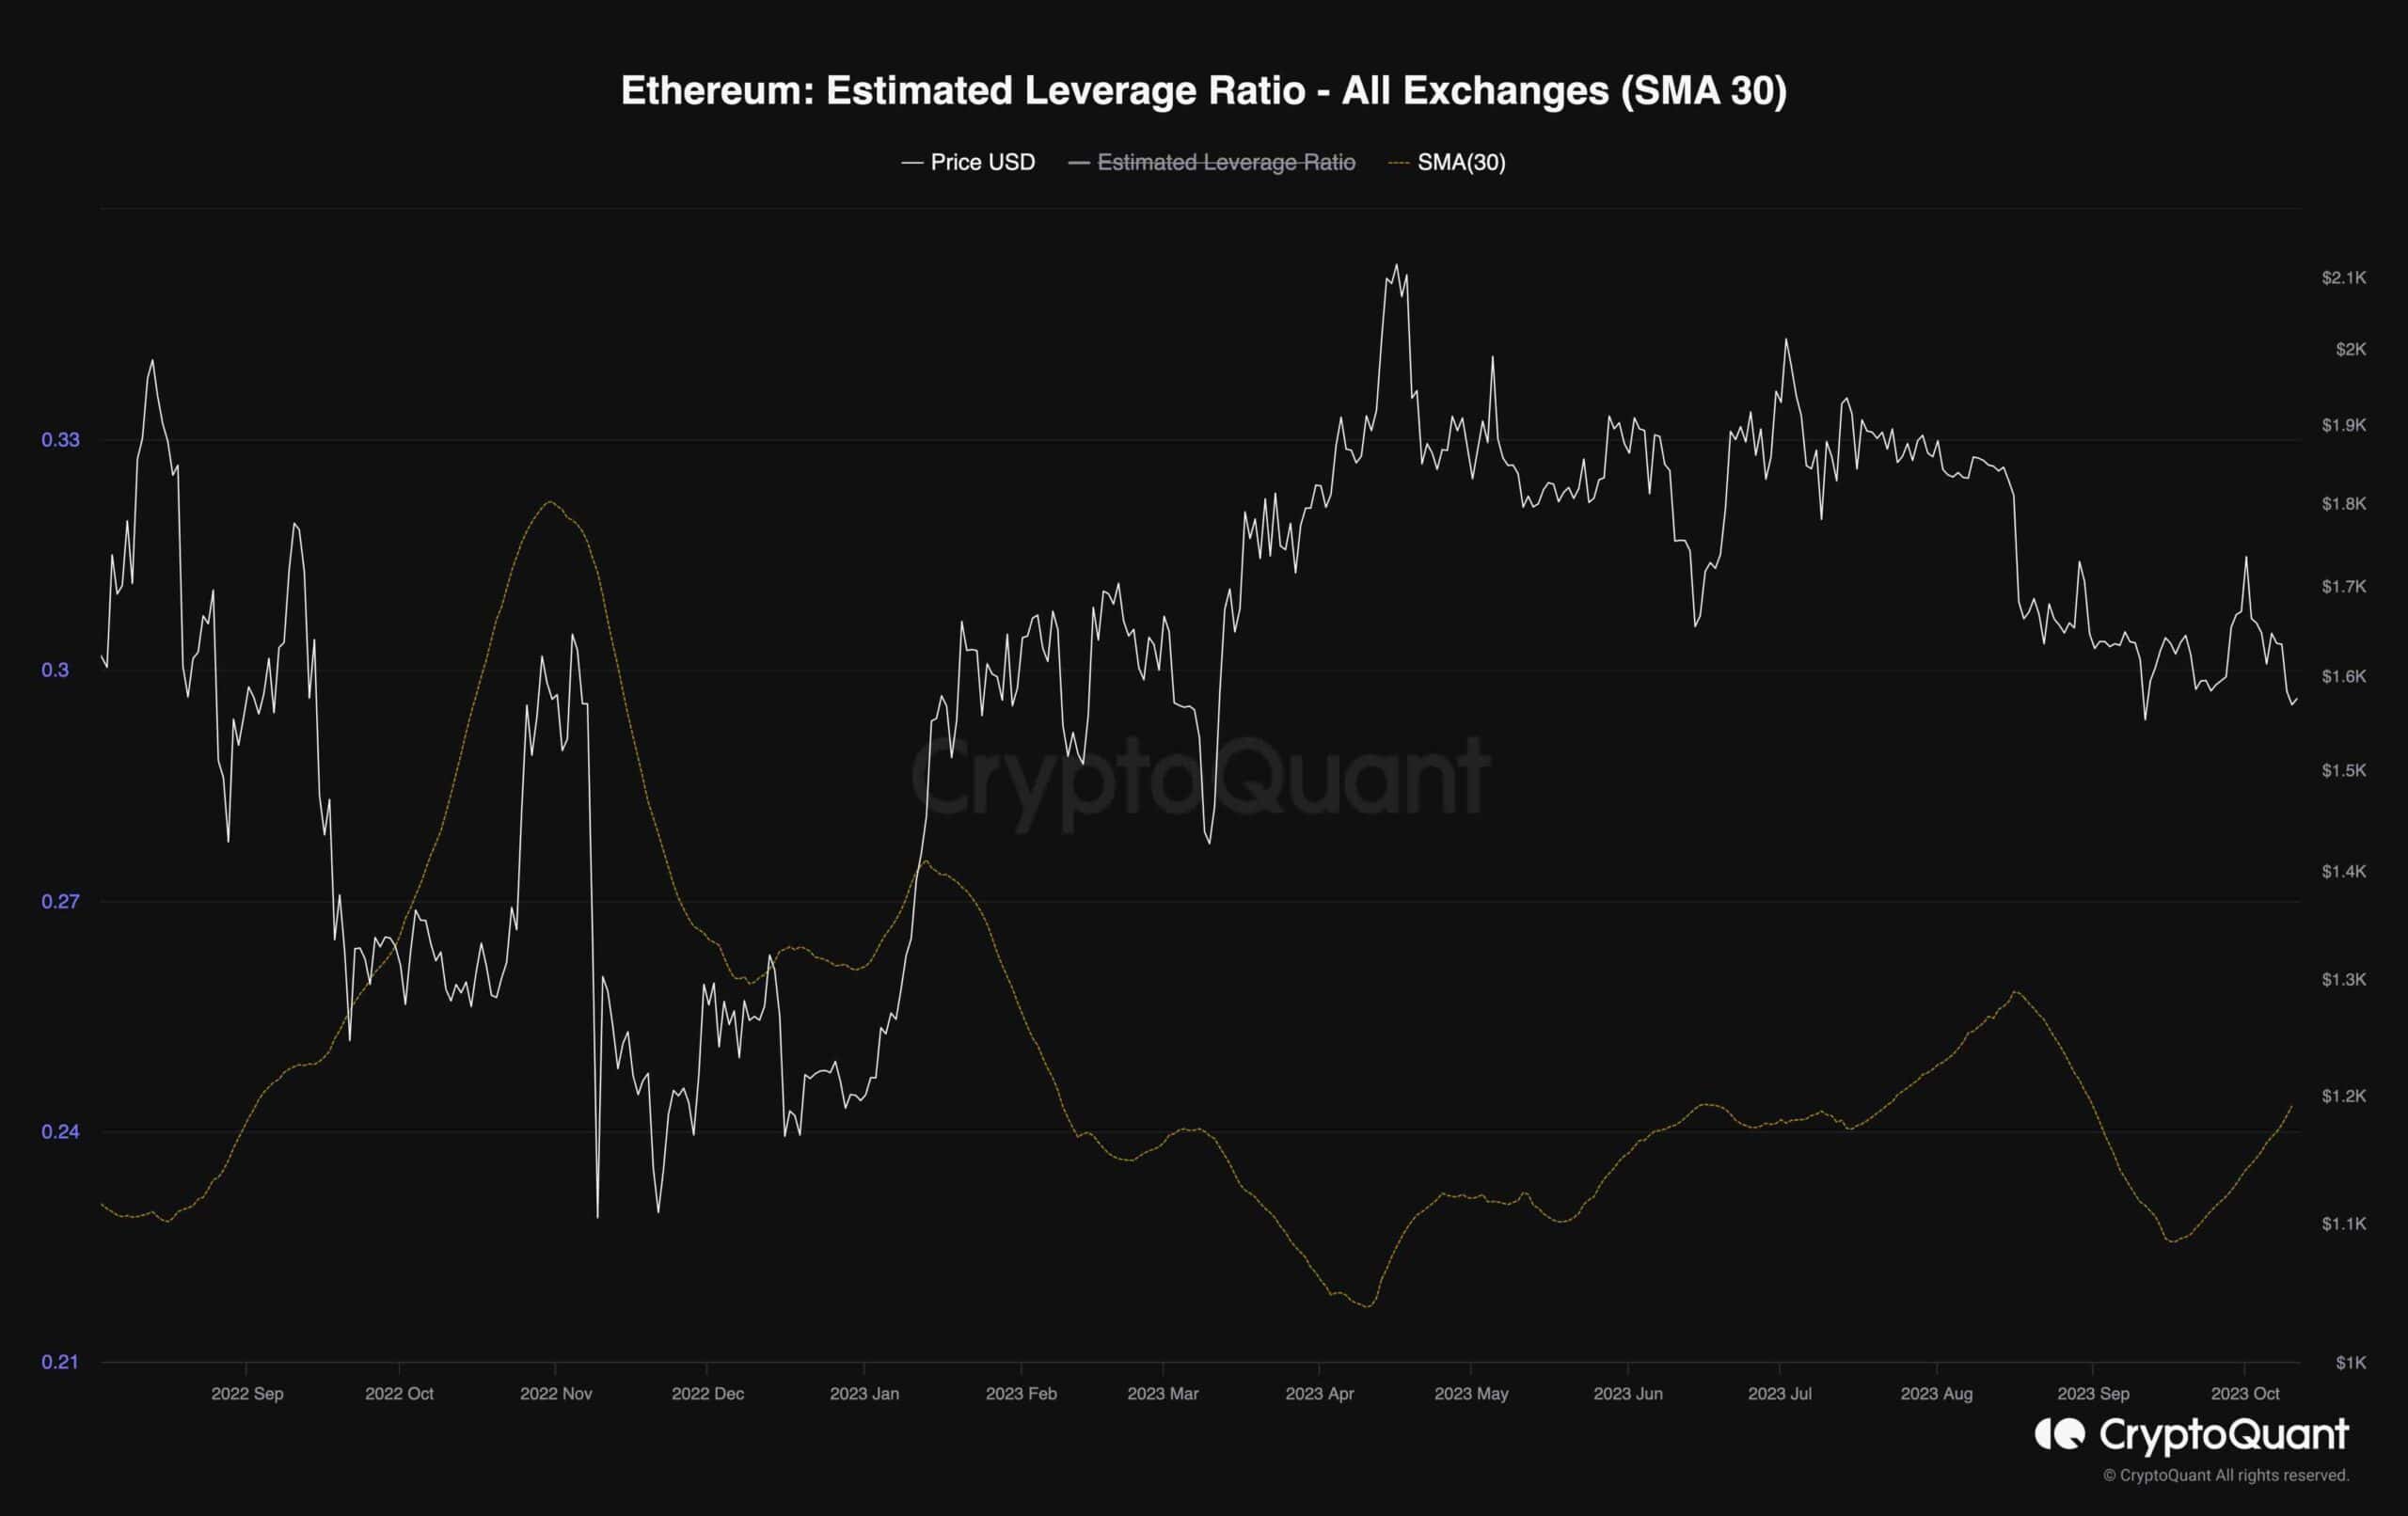
The chart below illustrates the Estimated Leverage Ratio metric in relation to ETH’s price. It provides insights into the average leverage utilized by participants in the futures market. Higher values indicate greater leverage and risk taken by traders in the derivatives market.
Historically, the metric had been in a downtrend, reaching a yearly low. This signaled a period of stability in the futures market, with traders employing lower leverage. However, there has been a notable increase in the Estimated Leverage Ratio in recent weeks. While it hasn’t reached alarming levels yet, this uptick suggests a growing enthusiasm in the futures market, possibly leading to heightened leverage usage.
If this surge is sustained, it could indicate an overheating of the futures market. Although the situation isn’t alarming at the moment, it is important to view the continued elevation of this metric with caution. Further increases could trigger a short or long-squeeze event, resulting in sudden and significant movements in Ethereum’s price.