The cryptocurrency market recently experienced a sudden surge in different assets, including Ethereum, which saw a significant spike.
However, as the price approaches a significant resistance level, there is a possibility of it being rejected.
By Shayan
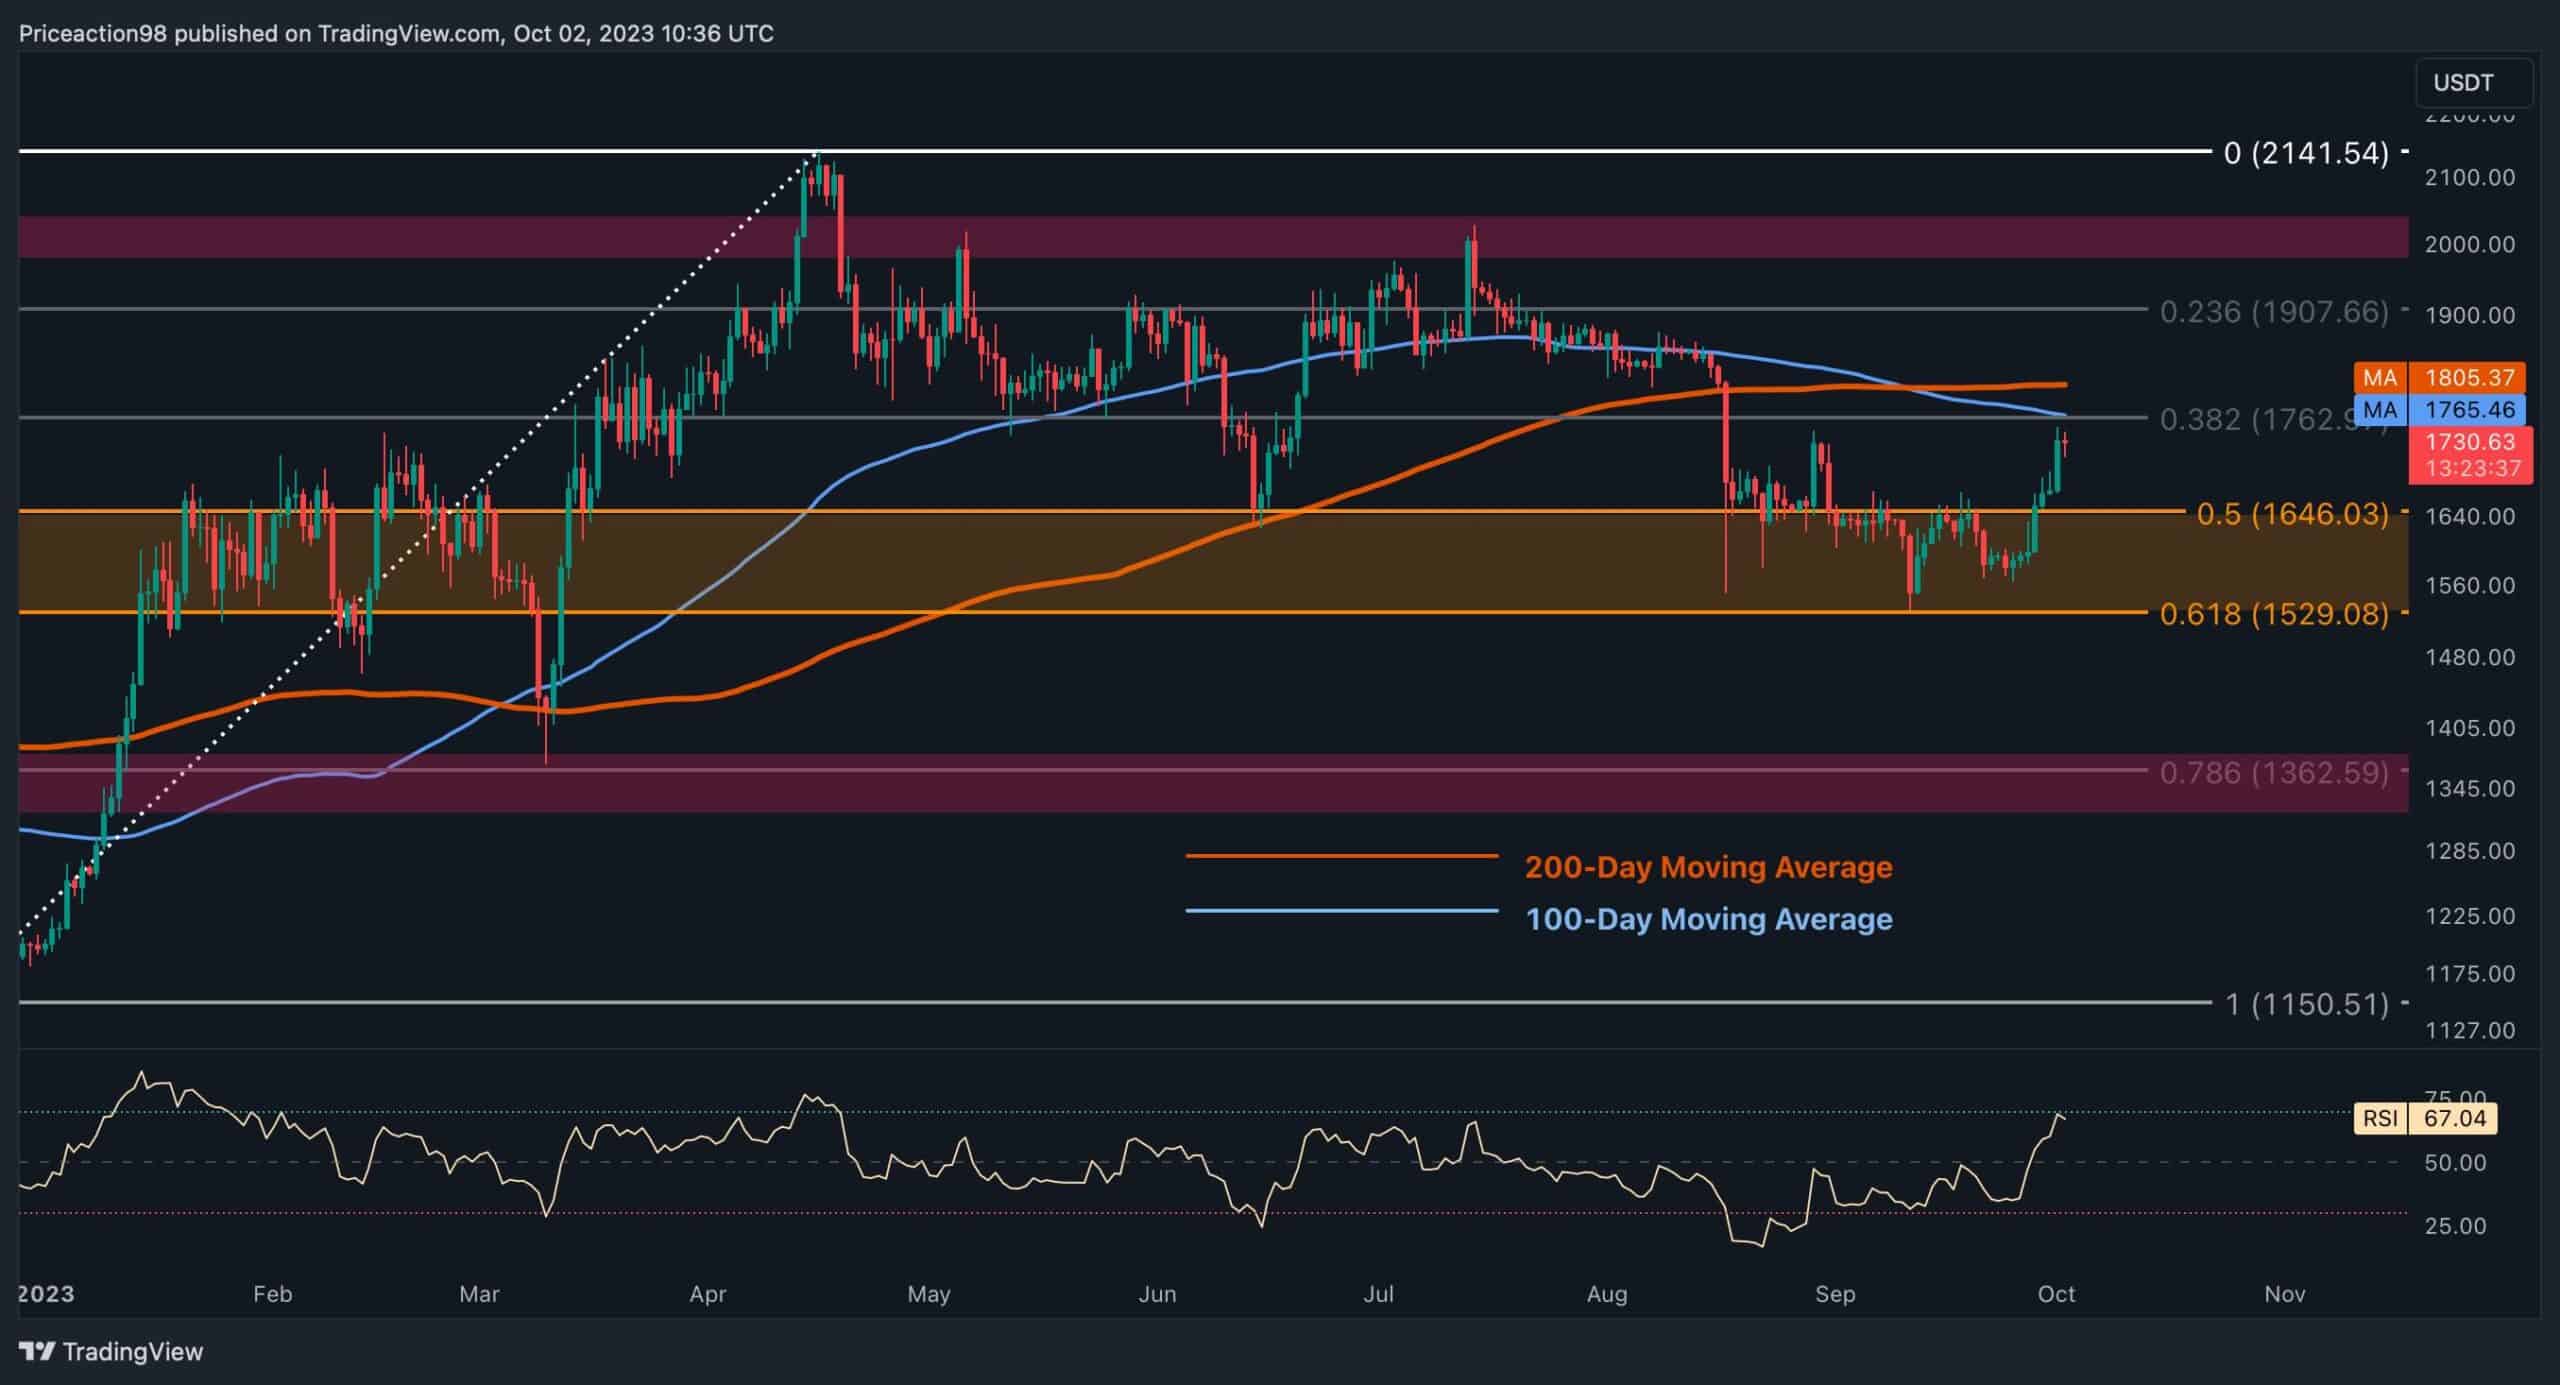
Upon analyzing the daily chart, it is evident that Ethereum experienced an extended consolidation phase near the $1.6K support level. Eventually, with increased buying interest, the price surged towards the 100 and 200-day moving averages, located around $1765 and $1805, respectively.
These moving averages, which Ethereum had previously dropped below in mid-August due to intensified selling pressure, now serve as dynamic solid resistance levels. If the price is rejected within this range, it could indicate a valid pullback, potentially leading to another decline towards the $1.6K support level.
Alternatively, if Ethereum buyers successfully push the price above this crucial region, it could revive bullish sentiment and pave the way for further market appreciation.
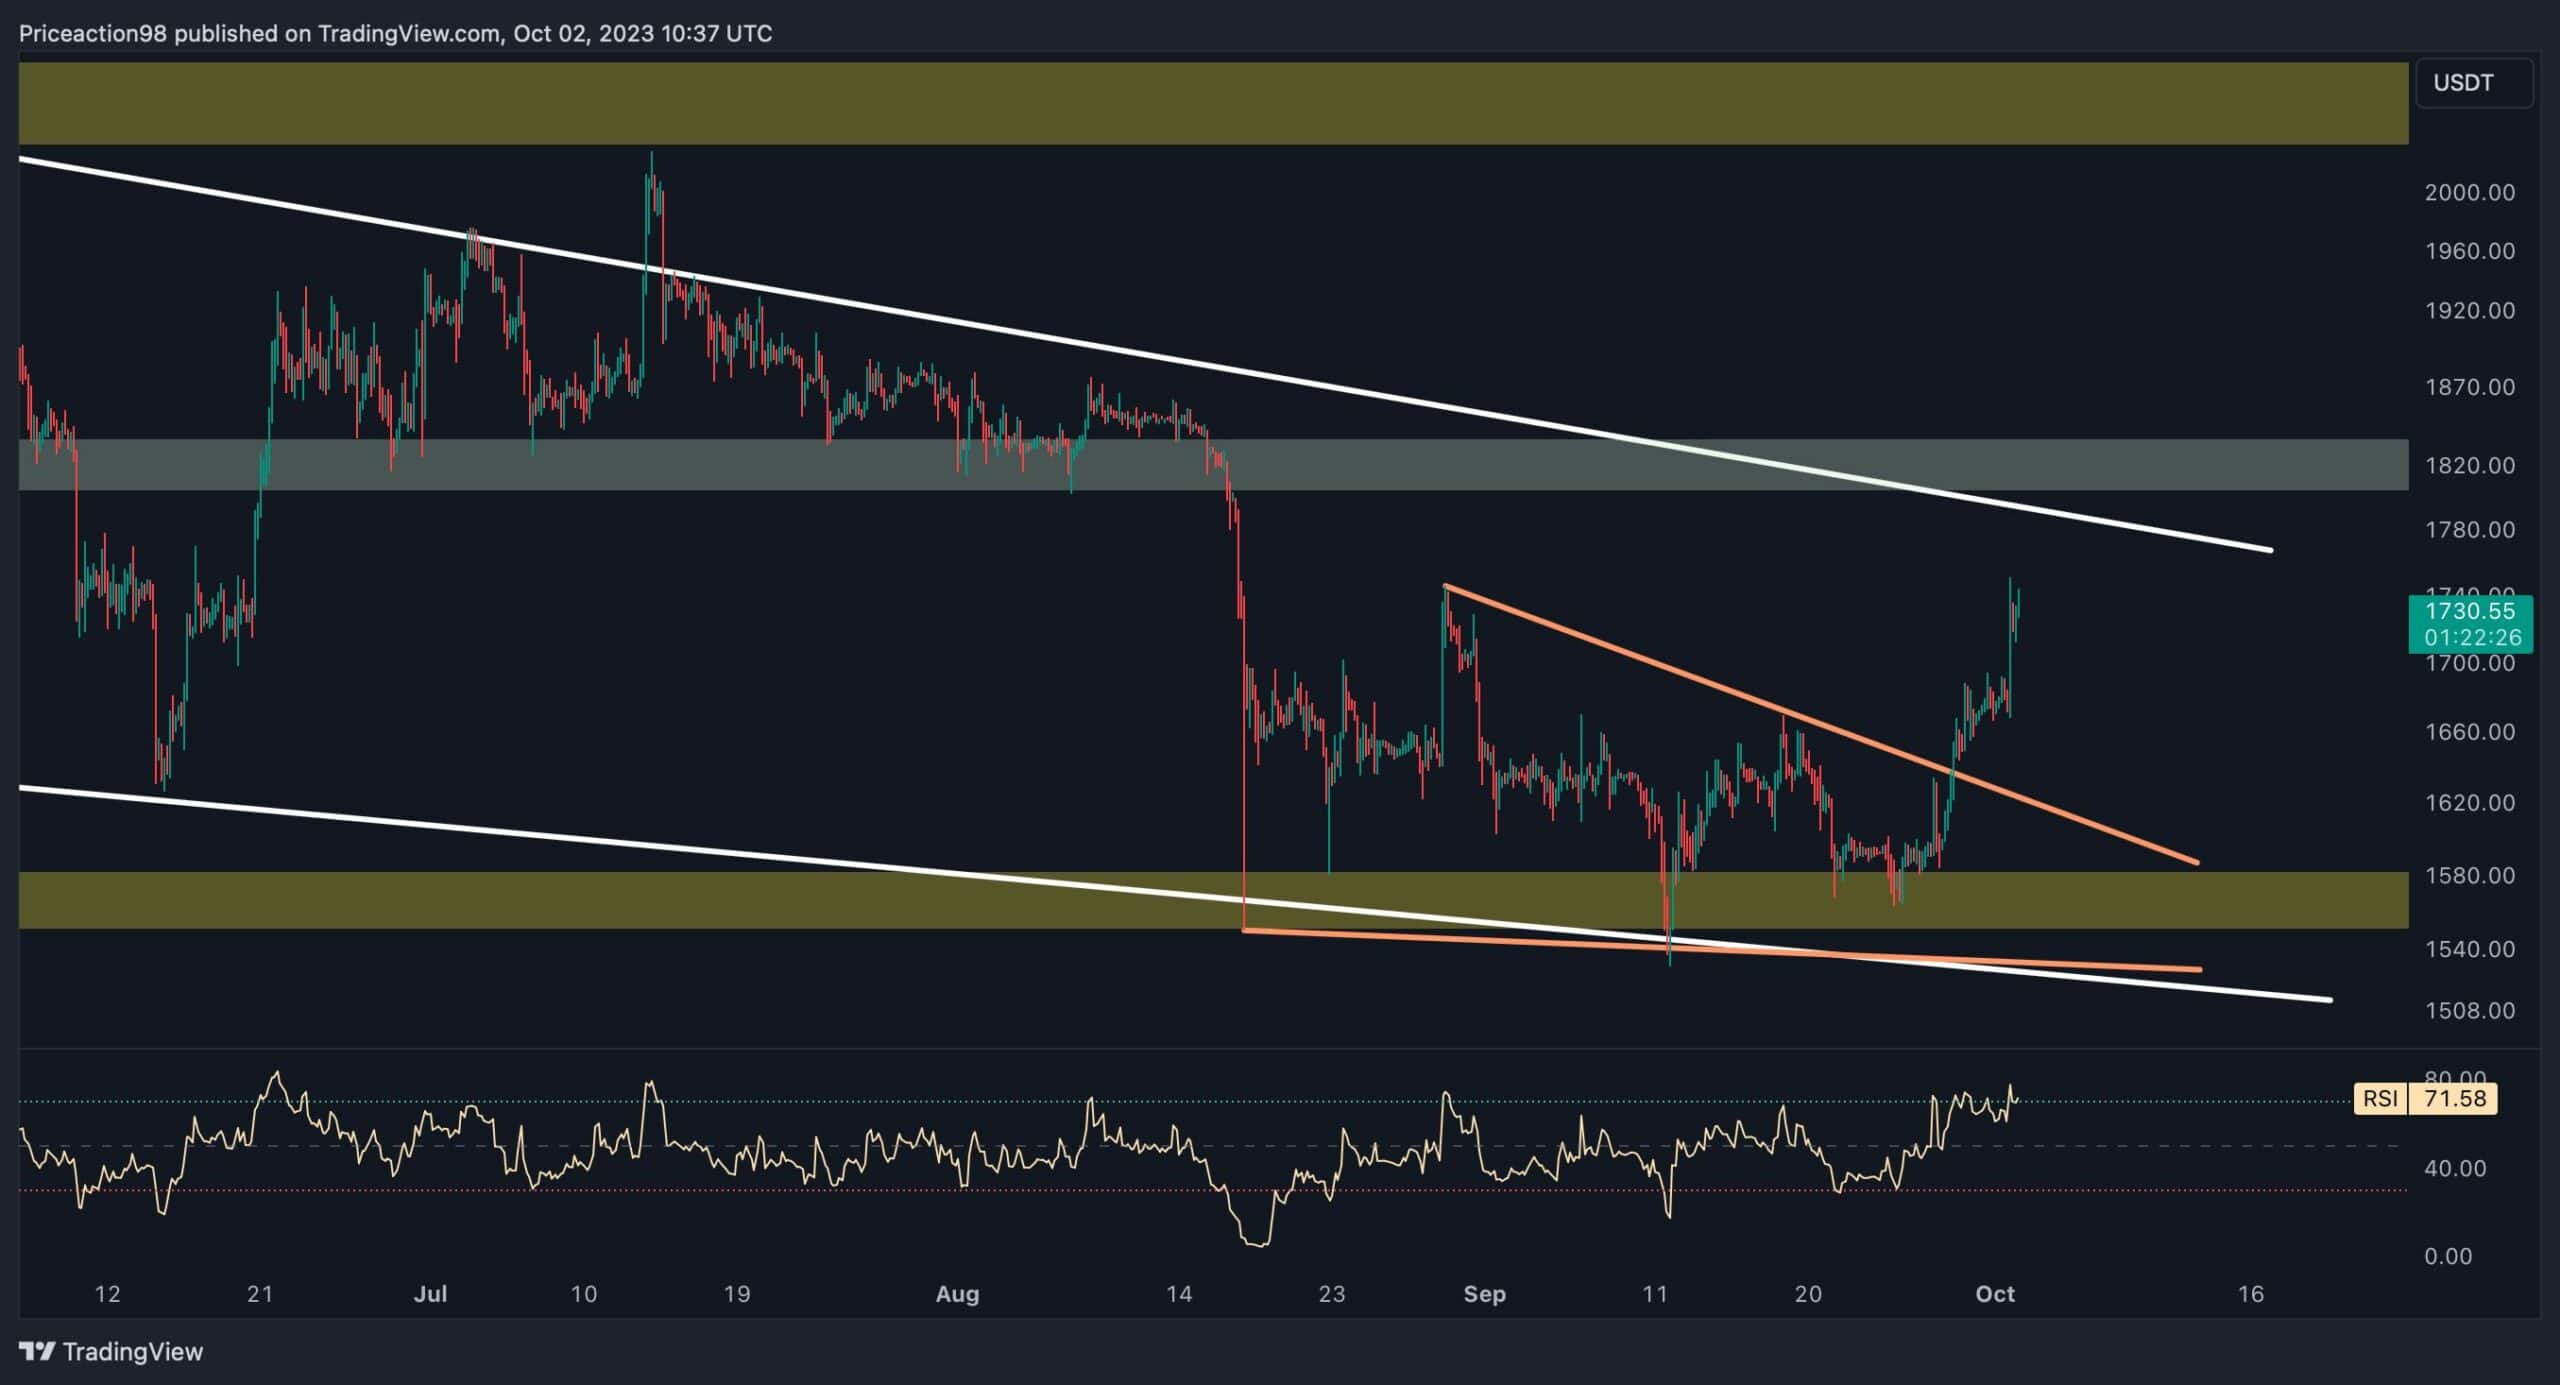
Analyzing the 4-hour chart, the recent action indicates a positive outlook among Ethereum traders and suggests potential future behavior. While consolidating around the $1.6K support region, the price formed a descending wedge pattern (marked by orange trendlines), which is a well-known bullish reversal pattern among technical traders.
With increased buying pressure, the cryptocurrency recently broke above the upper threshold of the wedge and experienced a pullback, indicating a possible upward trajectory for Ethereum in the short term.
However, the recent price spike has brought ETHclose to an important resistance zone. This zone includes the static resistance at $1.8K and the dynamic resistance of the upper boundary of the extended descending wedge (indicated by white lines).
This resistance area could impede the current upward rally due to intensified selling pressure. Nevertheless, considering the active futures market, if the price surpasses this critical range, it would be favorable for Ethereum buyers. It could lead to a surge towards the $2K resistance level. Traders should closely monitor these significant levels to make informed decisions in the market.
By Shayan
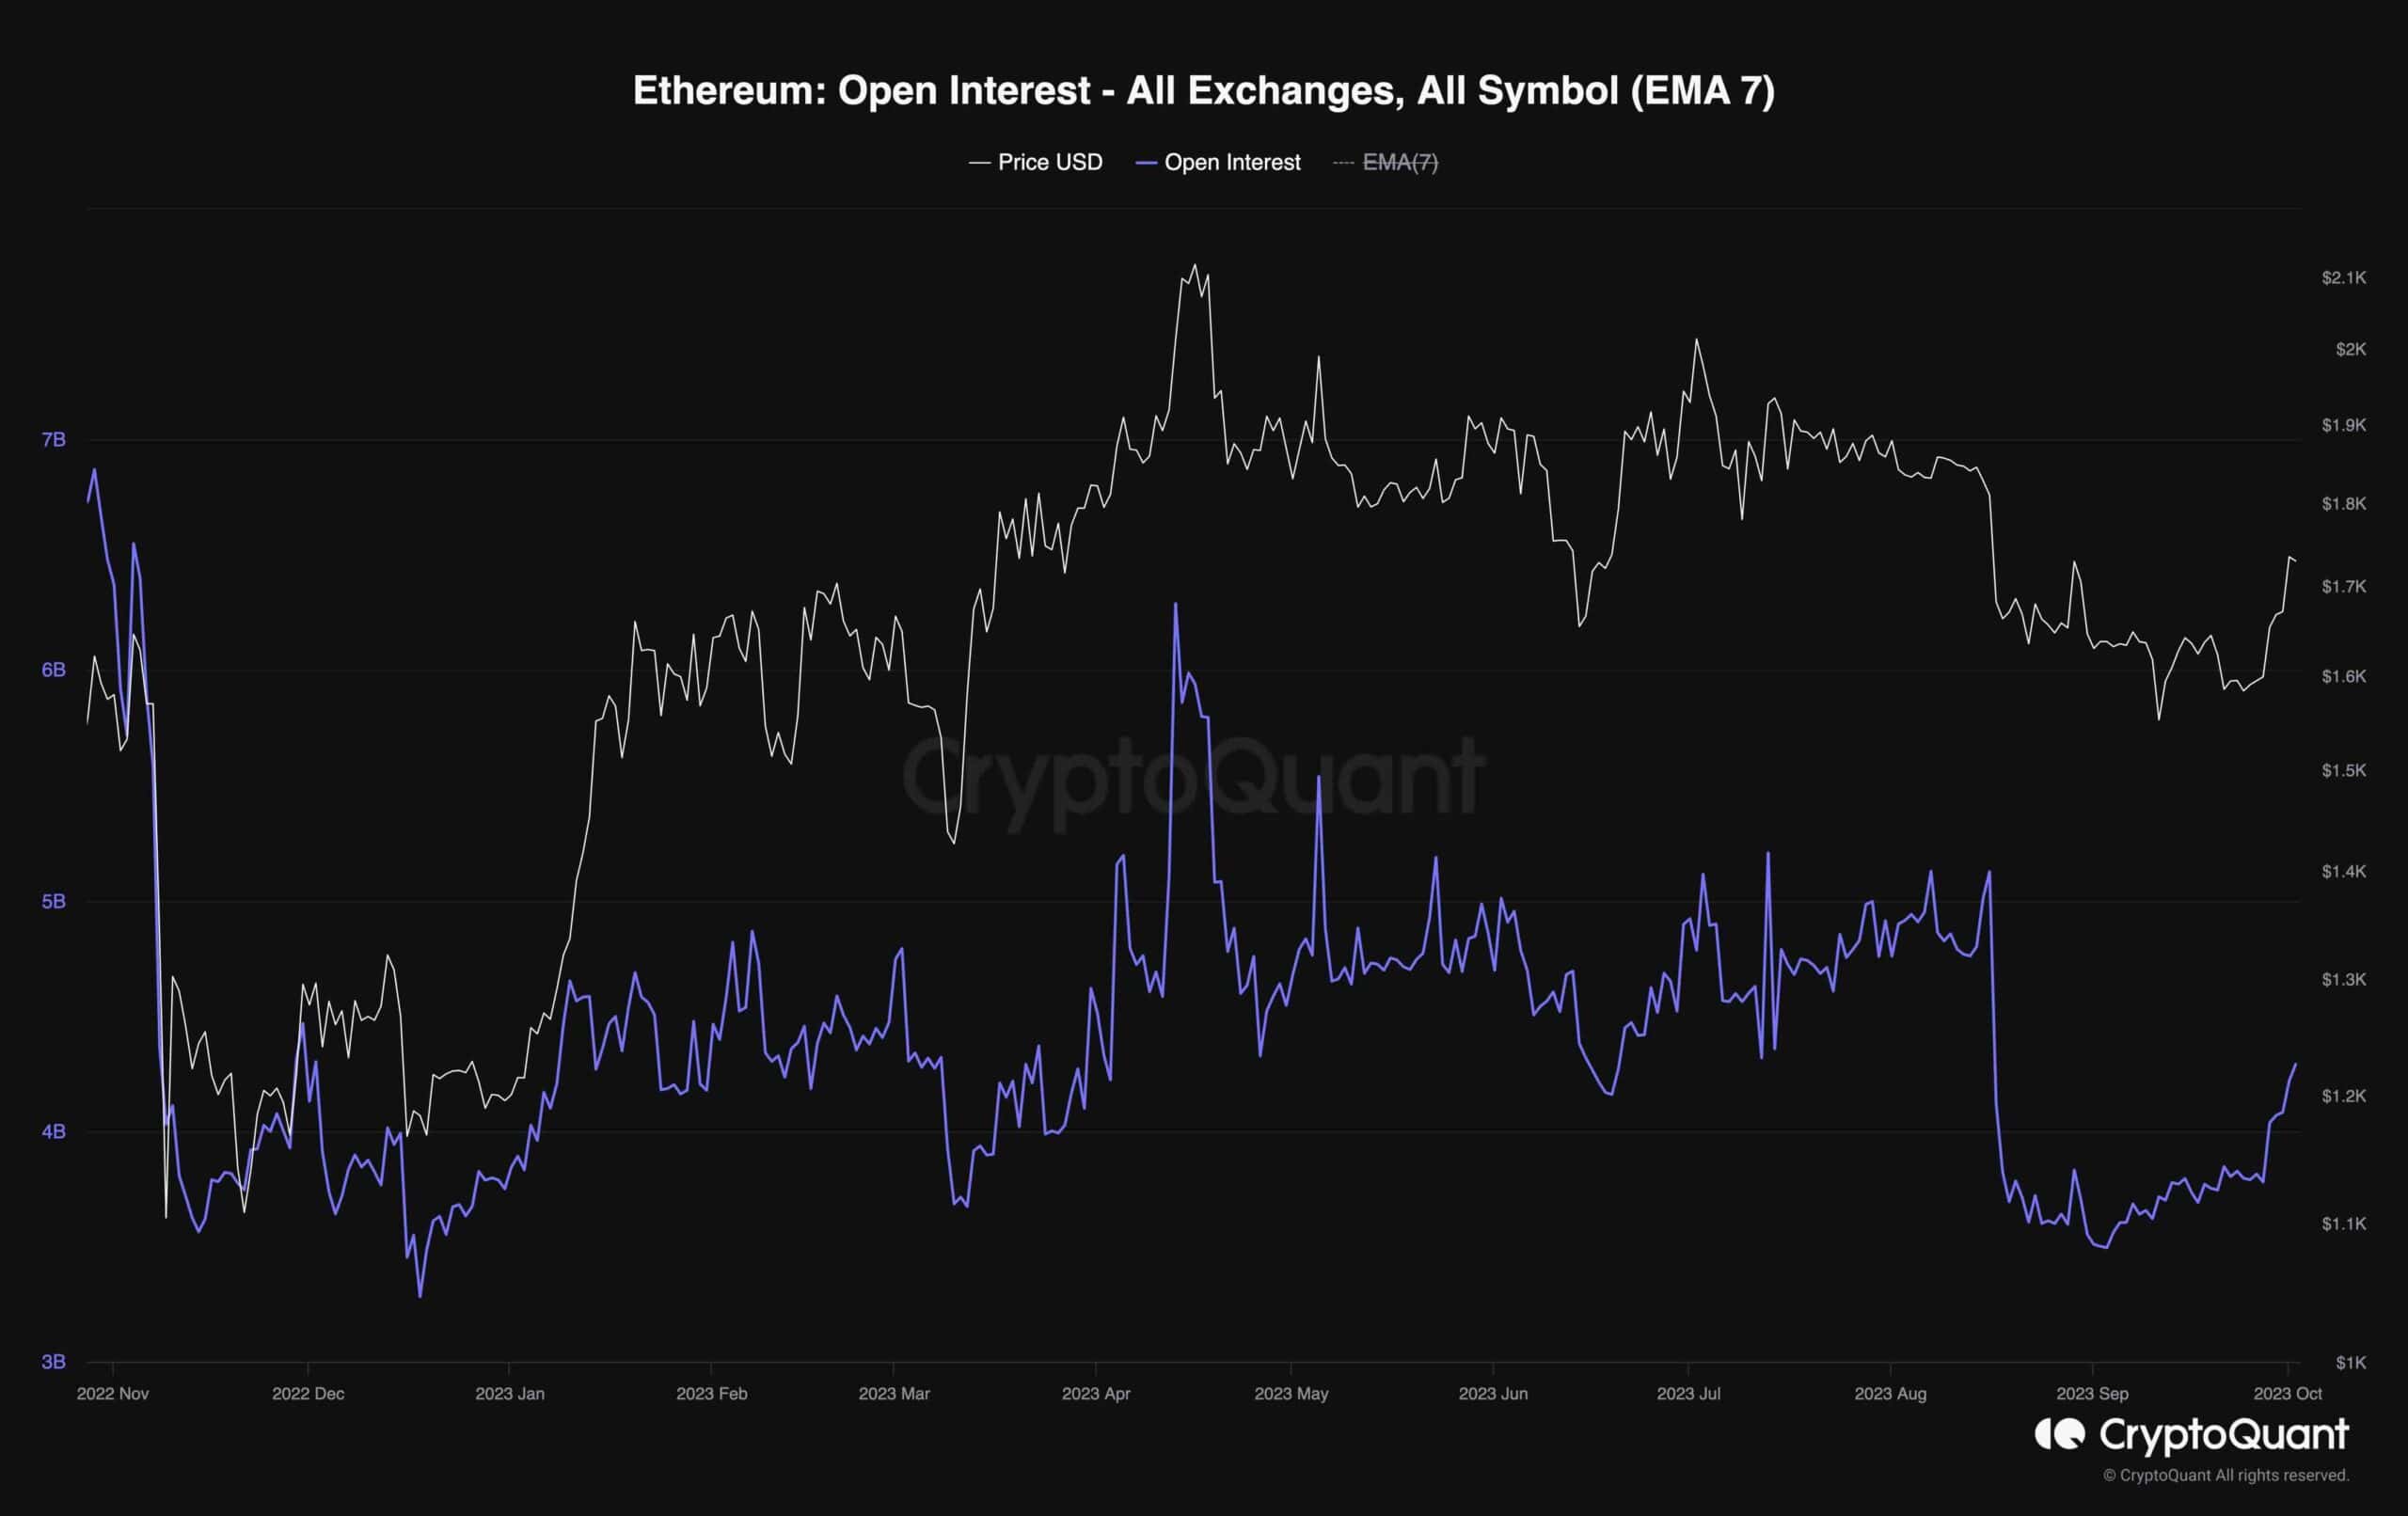
Following a sudden decline in mid-August, there was a corresponding drop in the open interest metric, reaching a multi-month low. However, a recent increase in buying pressure has resulted in a significant price surge. These sudden market movements are often connected to liquidations in the futures market. It is essential to investigate whether this is the case once again.
The chart illustrates the Open Interest metric, representing the total number of open positions in perpetual futures markets. Higher values typically indicate increased market volatility.
The chart shows that the recent price spike coincided with a sharp rise in Open Interest. This suggests that the futures market may have been the driving factor behind the recent bullish rally. The substantial increase in Open Interest suggests that a short liquidation cascade occurred, pushing the market upwards.
However, despite the consistent upward trend in the Open Interest metric, traders should proceed cautiously. While rising values could indicate potential upward market movements, it is crucial to closely monitor this indicator, as high readings might be accompanied by significant liquidations that could lead to unexpected market downturns.