By Shayan
Bitcoin has been displaying a gradual uptrend, surpassing the $35K resistance region. Nevertheless, the price now encounters several resistance zones ahead, while a bullish breakout has the potential to trigger a significant uptrend.
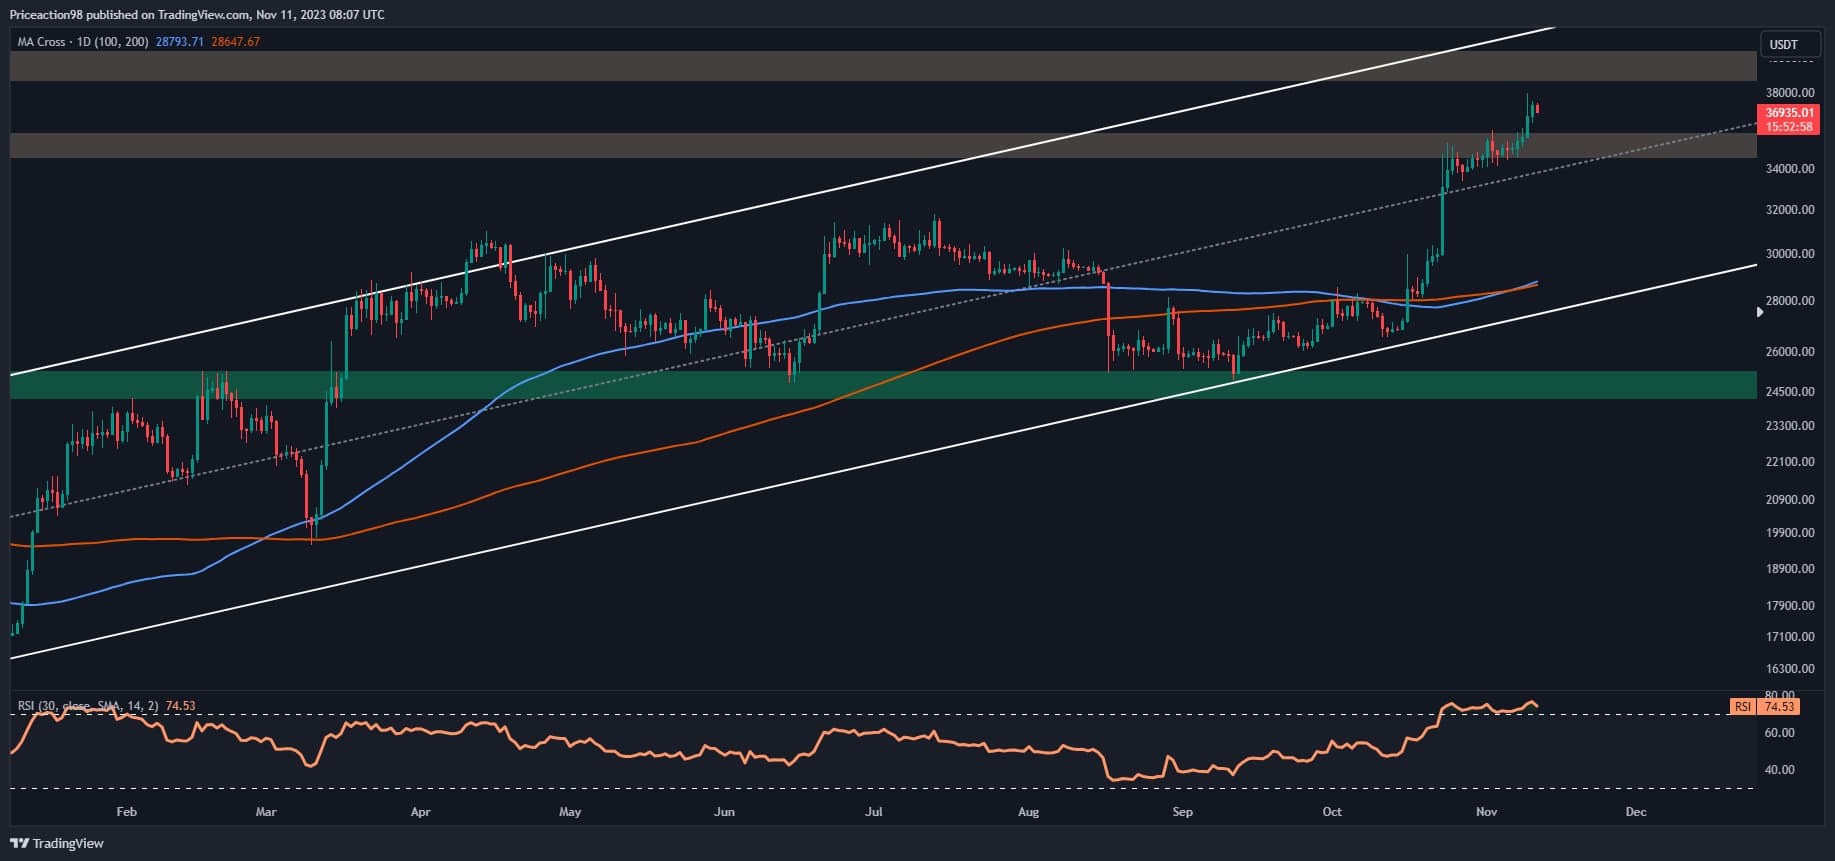
Upon examining the daily chart, Bitcoin has sustained a noticeable uptrend within an ascending channel pattern, ultimately surpassing the $35K resistance region.
In the meantime, a noteworthy development occurred, where the 100-day moving average crossed above the 200-day moving average at $28,500, indicating a golden cross. This golden cross signals prevailing buying pressure and suggests a potential bullish market.
However, the path forward is marked by multiple resistance regions, notably the substantial $40K psychological resistance and the upper trendline of the ascending channel.
A successful rally of this pivotal range by buyers could pave the way for a positive mid-term trend, potentially targeting higher resistance zones. Despite this, considering the overheated futures market, a consolidation correction phase with minor retracements remains likely. In such a scenario, the middle boundary of the ascending channel and the $35K support zone would provide initial support for buyers.
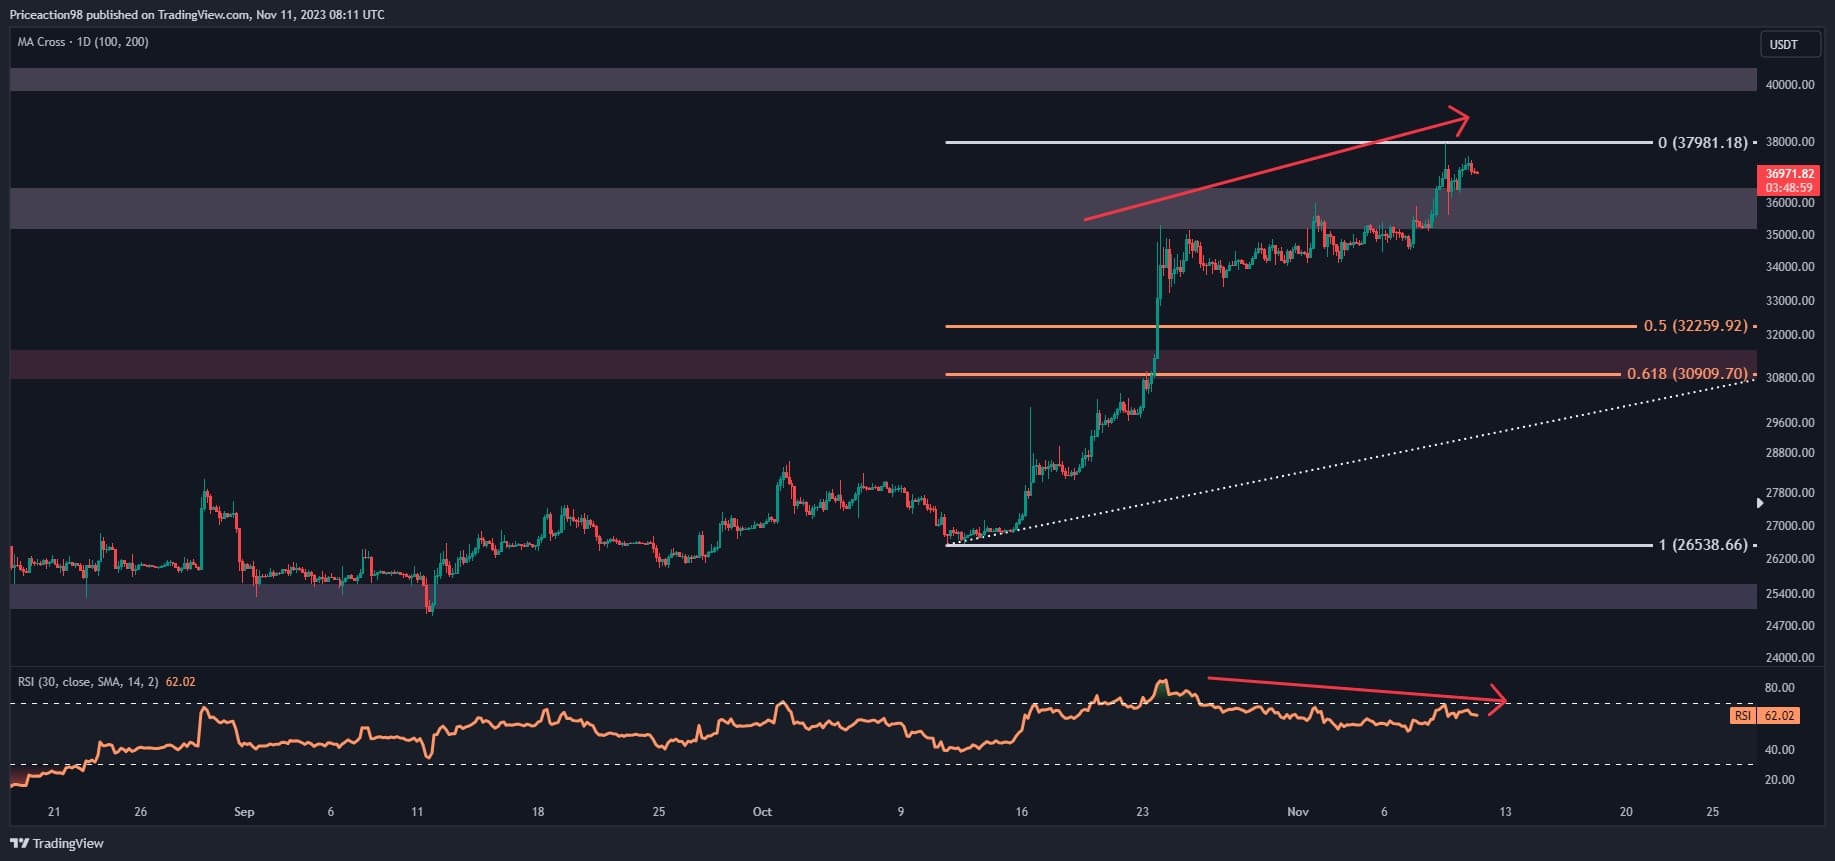
On the 4-hour chart, it is evident that Bitcoin has maintained robust upward momentum over the past months. The recent breakout above the decisive $35K resistance, while emphasizing market demand, is accompanied by low momentum, raising the possibility of a fakeout.
Additionally, a bearish divergence between the price and the RSI indicator also suggests the potential for a short-term retracement. If sellers outpace buyers, a long squeeze event could occur, with key support levels at the substantial $35K support and the 0.5 Fibonacci retracement level at $32,300. Conversely, if demand surpasses supply and market momentum intensifies, an imminent breakout will likely lead to a robust price surge.
By Shayan
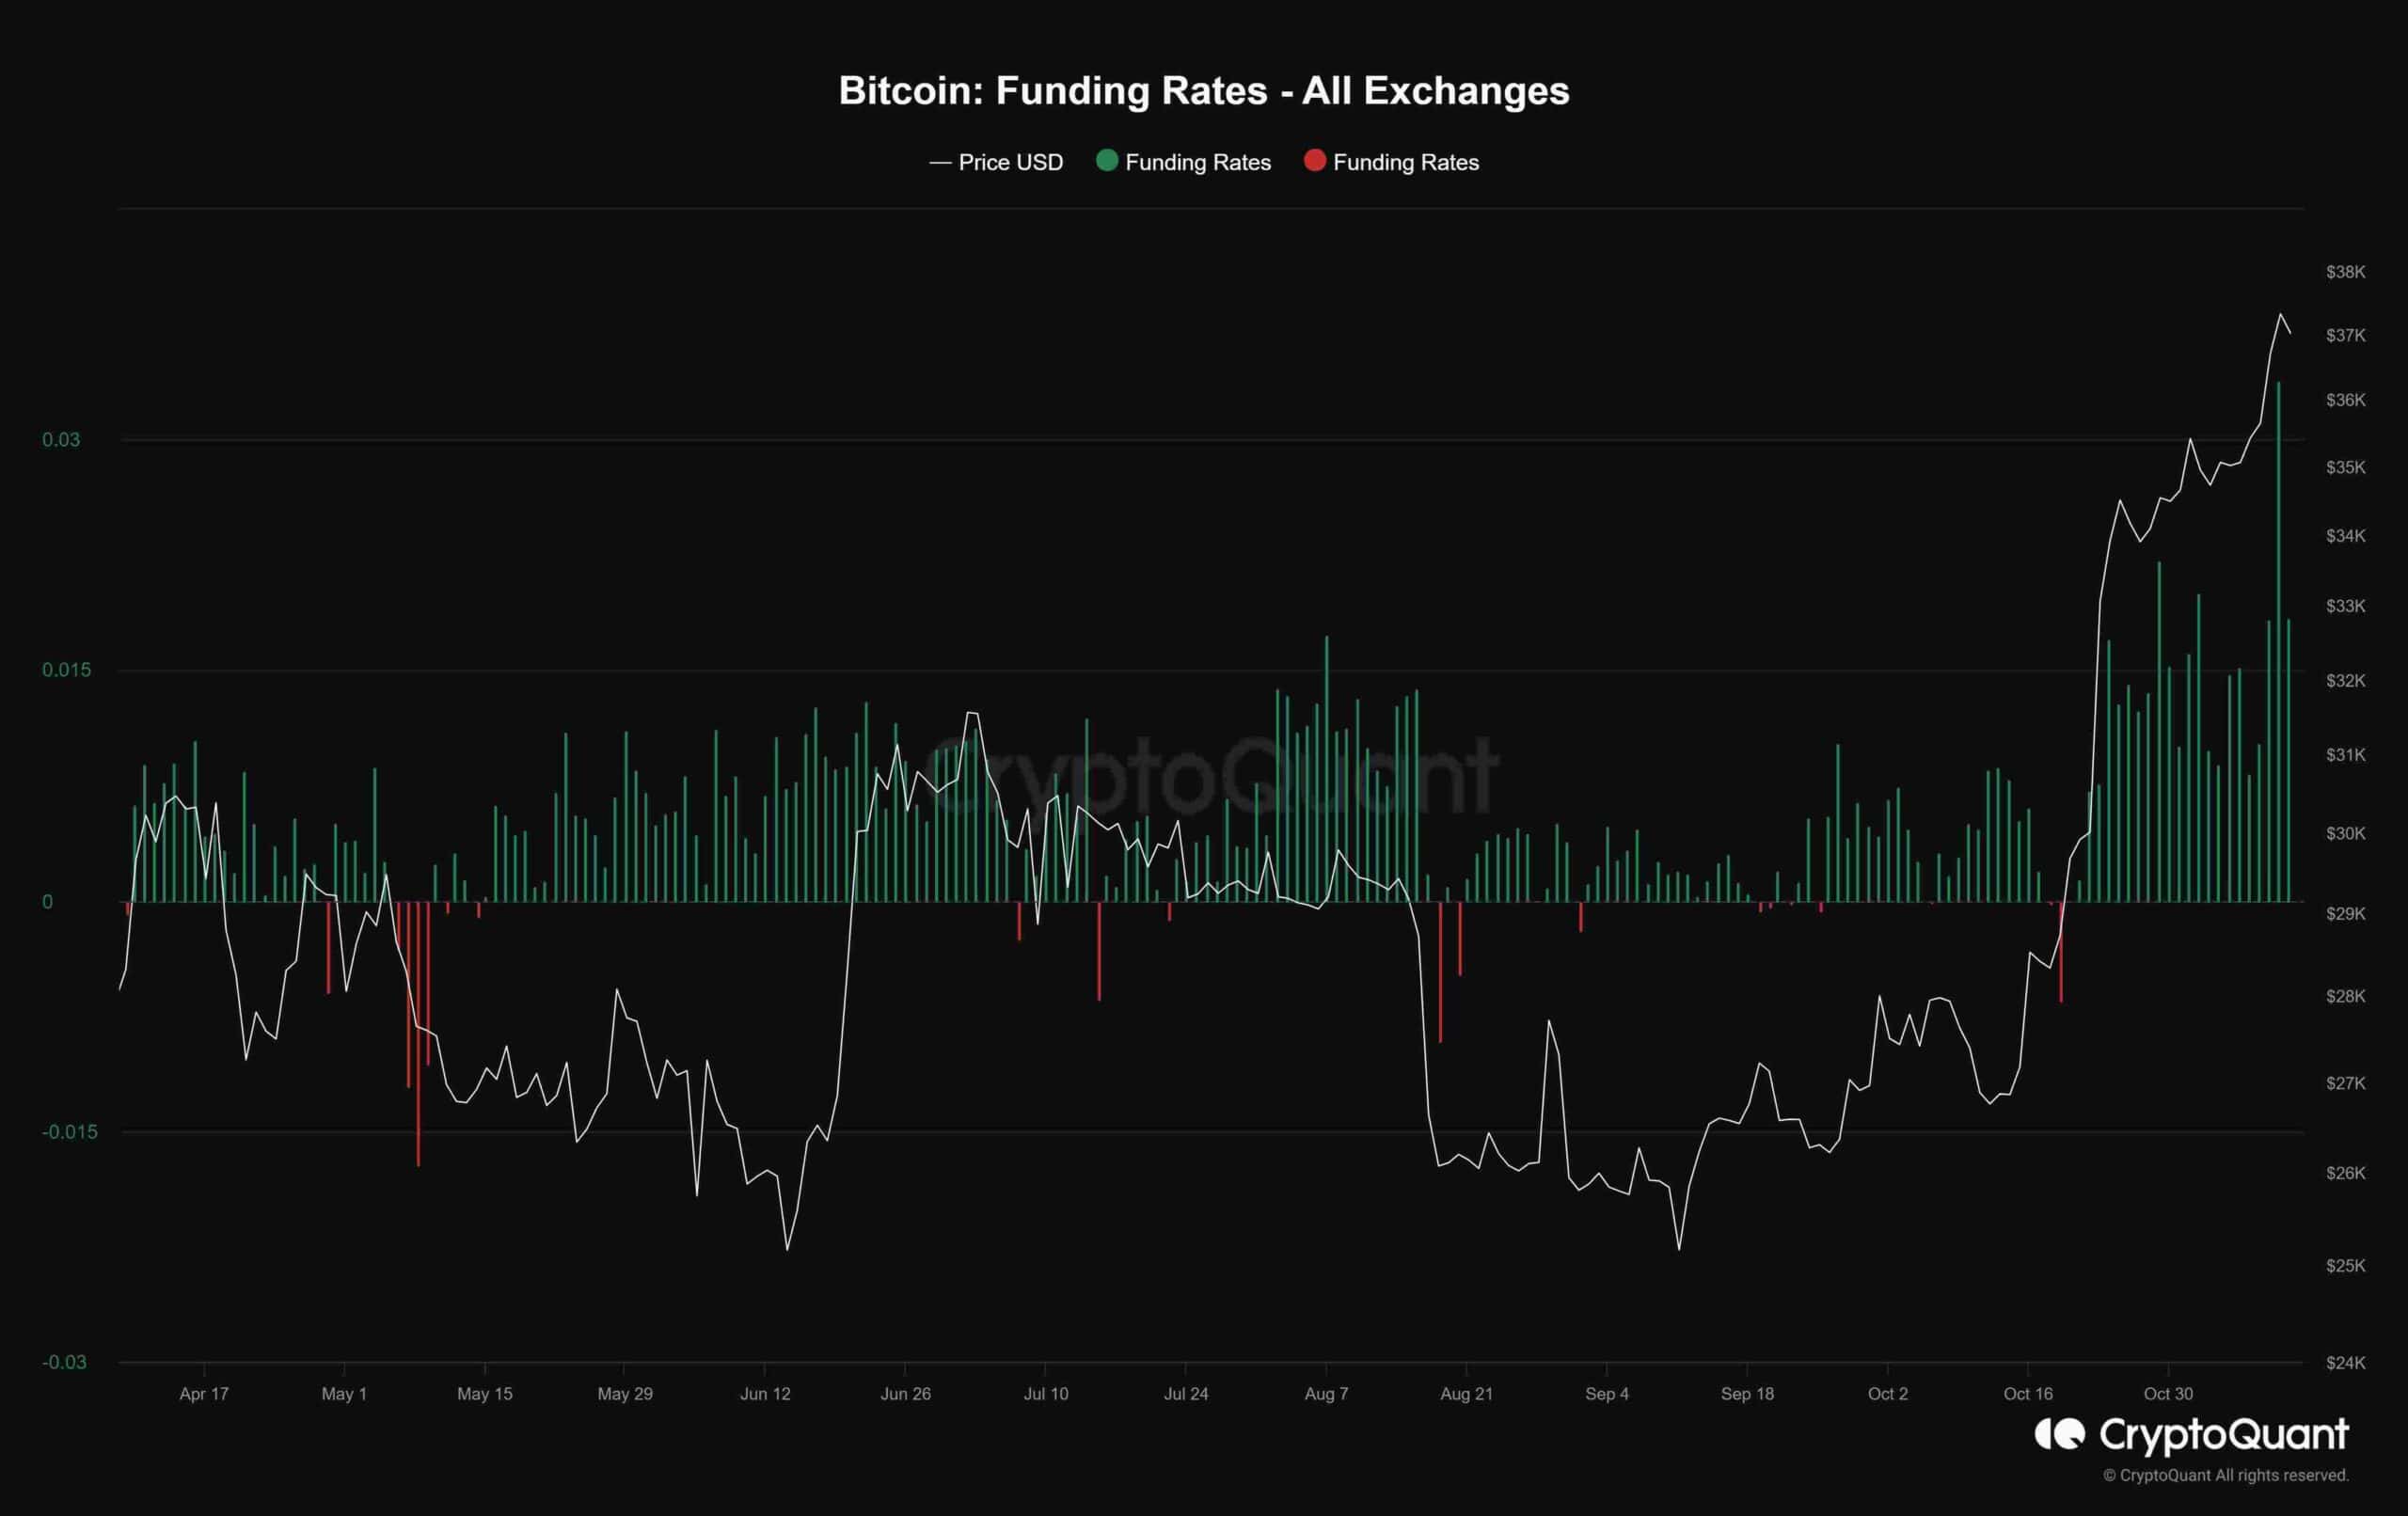
The chart illustrates the funding rates, which are periodic payments to traders based on the disparity between perpetual contract markets and spot prices. These rates offer insights into trader sentiment in the perpetual futures market and are proportionate to the number of contracts.
Recently, the metric has seen a notable surge in tandem with an uptrend in the price, reaching its highest level since October 2021, coinciding with Bitcoin’s last historic price peak. This elevated value indicates prevailing optimism in the market, with a substantial number of futures contracts betting on a price increase.
However, this scenario carries a potential risk as it reflects excessively bullish sentiment. In such cases, a price contraction could trigger a cascade of liquidations, leading to a possible long-squeeze event. This occurrence might unexpectedly result in a significant downturn for Bitcoin as traders hurriedly exit their long positions.