As in crypto, always expect the unexpected. Back in 2018, when everyone, besides us, was sure that Bitcoin would be holding up forever the bear market’s bottom at $6000, we all know how it ended up. For those who have a short memory, following the breakdown of $6000, Bitcoin had lost nearly 50%, in its way to the lowest price of the current bear market at $3120 (Bitstamp).
Back to our times: When everyone was sure we are at least going to visit the $3000 area one more time, or this bear market will only recover somewhere during 2020 – 2021, then it came: an explosion: In a matter of hours, Bitcoin gained 22%.
Personally, I didn’t expect such a sharp bullish move. In my opinion, until we get a clear sign, whether it’s fundamental or technical (a Golden Cross), the status of the market stays the same.
However, one thing could have given some clues about the coming up BTC move we just saw, and it’s the BTC dominance. This was written just three days ago, on our last price analysis:
“Like any technical data, the 50% dominance mark should be a strong resistance level, in my opinion. It’s likely that either BTC will fire its engines or will get dumped, which will cause the altcoins, that had seen fabulous gains over the past month, to dump more whereas the dominance will raise.”
Total Market Cap: $175 Billion
Bitcoin Market Cap: $88.25 Billion
BTC Dominance: 50.3%
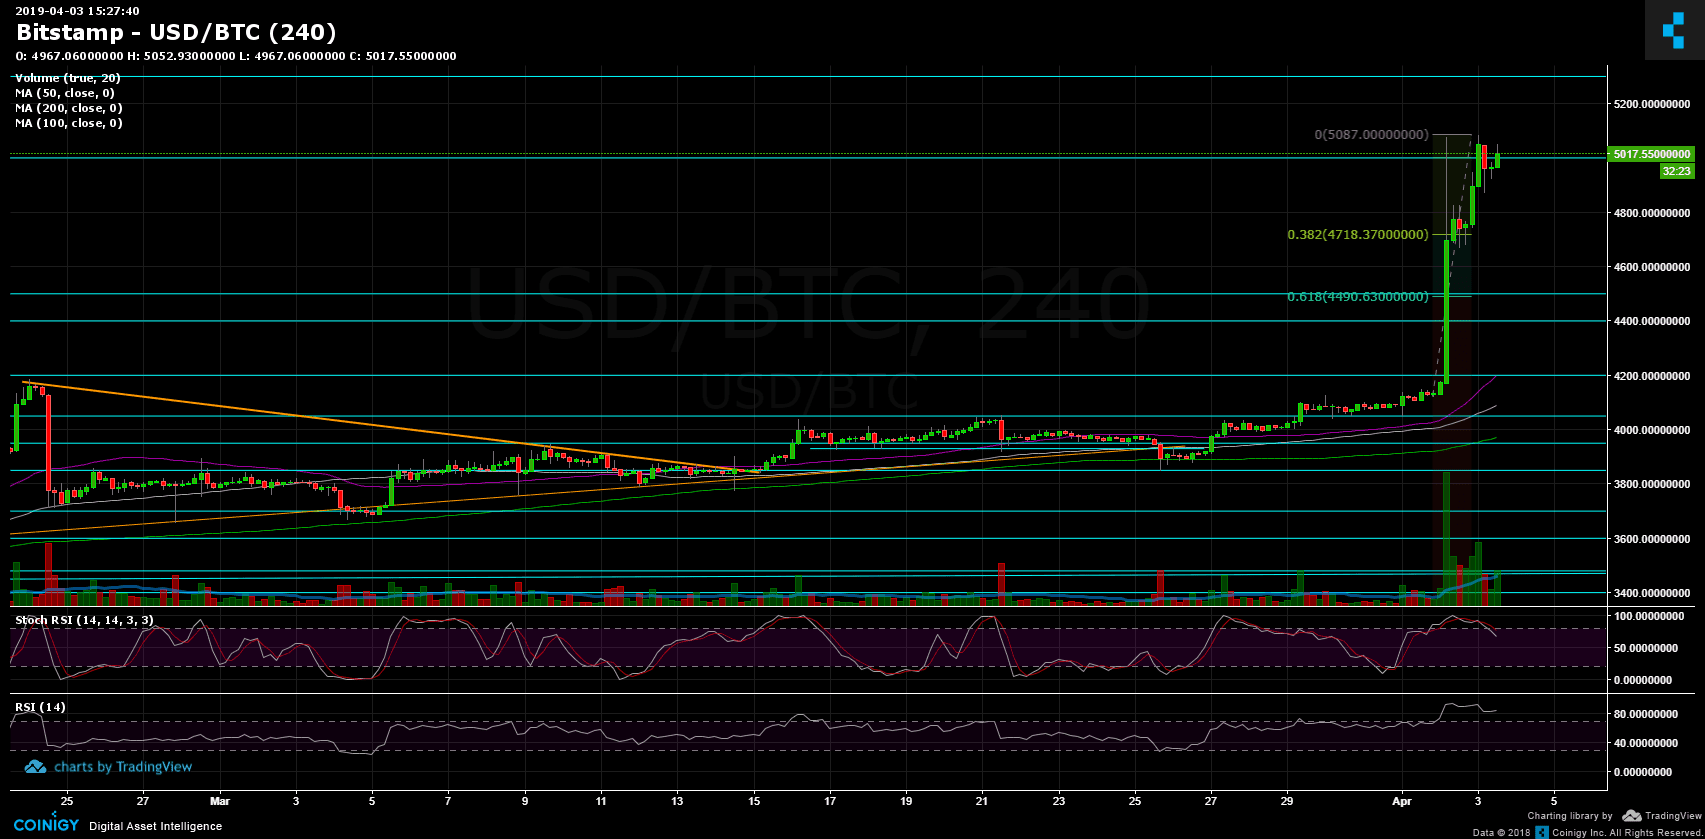
Following the surge, Bitcoin is now facing the $5000 resistance area. Despite the intra-day correction of yesterday down to $4700, the RSI is stretched into the bullish zone. Actually, the RSI is almost touching the 90 levels. This level is the highest since the end of 2017, and we all remember what had happened at that time with the Bitcoin’s price.
– Support/Resistance: The $5000 is indeed a tough resistance area. In case Bitcoin manages to overcome the $5K, we should expect the next resistance to be $5100 before reaching the significant resistance area of $5300.
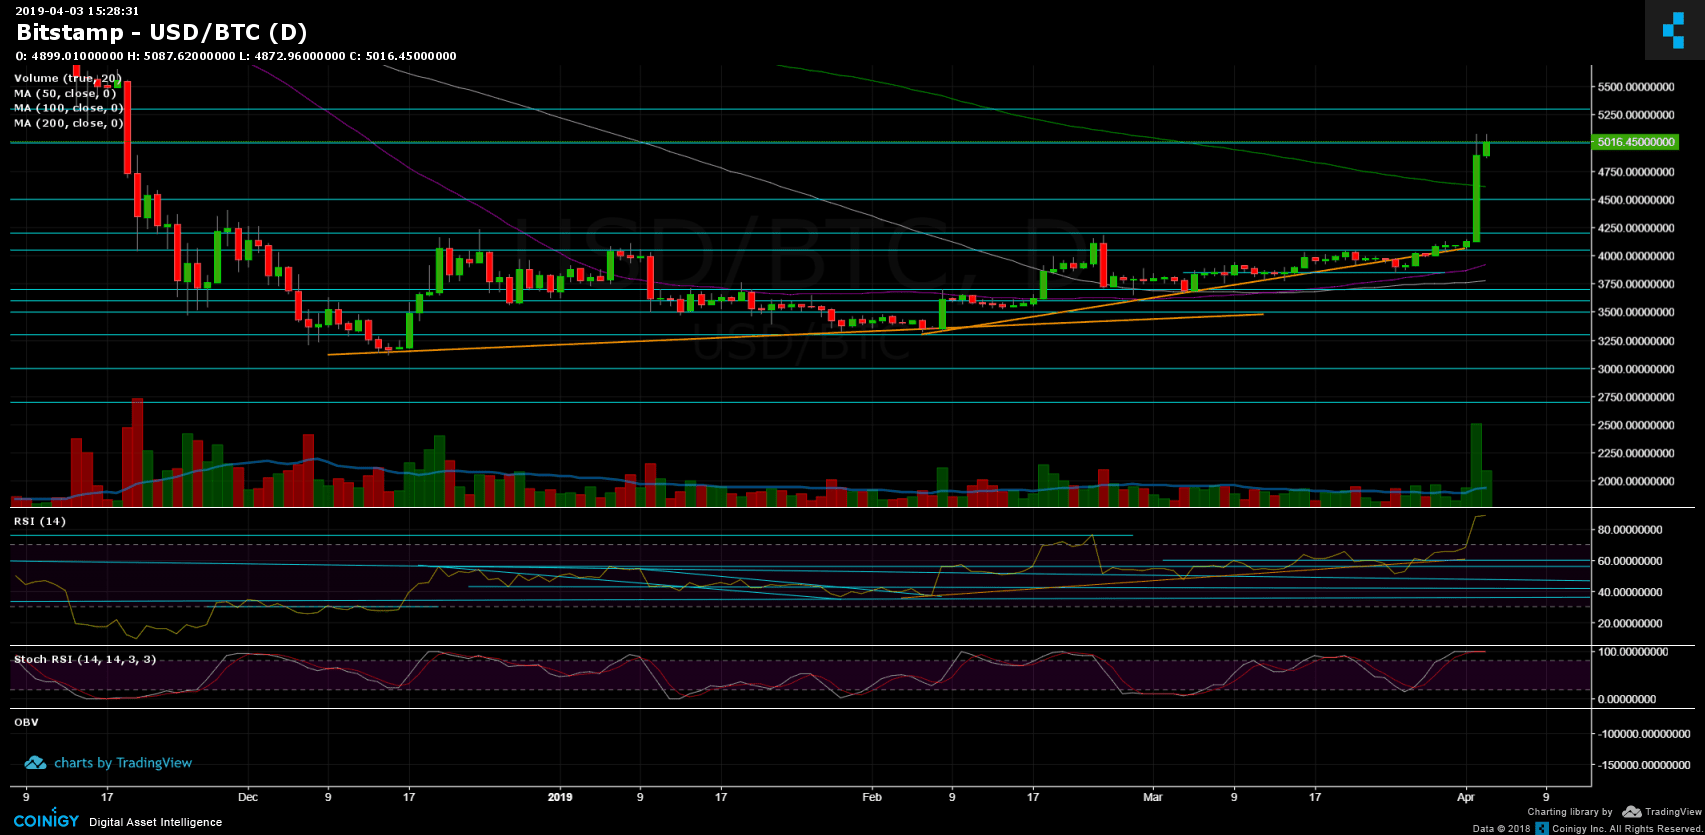
From below, there is strong support around $4700 (38.2% Fibonacci retracement level) and even stronger support around $4600, where lies the 200-days moving average line of the daily chart (marked in light green). Below lies resistance turned support levels of $4500 and $4400.
– The daily trading volume: The breakout was followed by massive amount of volume on all exchanges, especially on Binance. This is a very bullish sign for the next future of BTC.
– BitFinex open short positions: The spike in Bitcoin had caused lots of short positions’ liquidations. Looking at the short positions chart, it’s incredible how the number quickly dropped to 17K and regained spot to where it stands now – 20.8K. As a reminder, 17K is the lowest number of open shorts since February 2018.