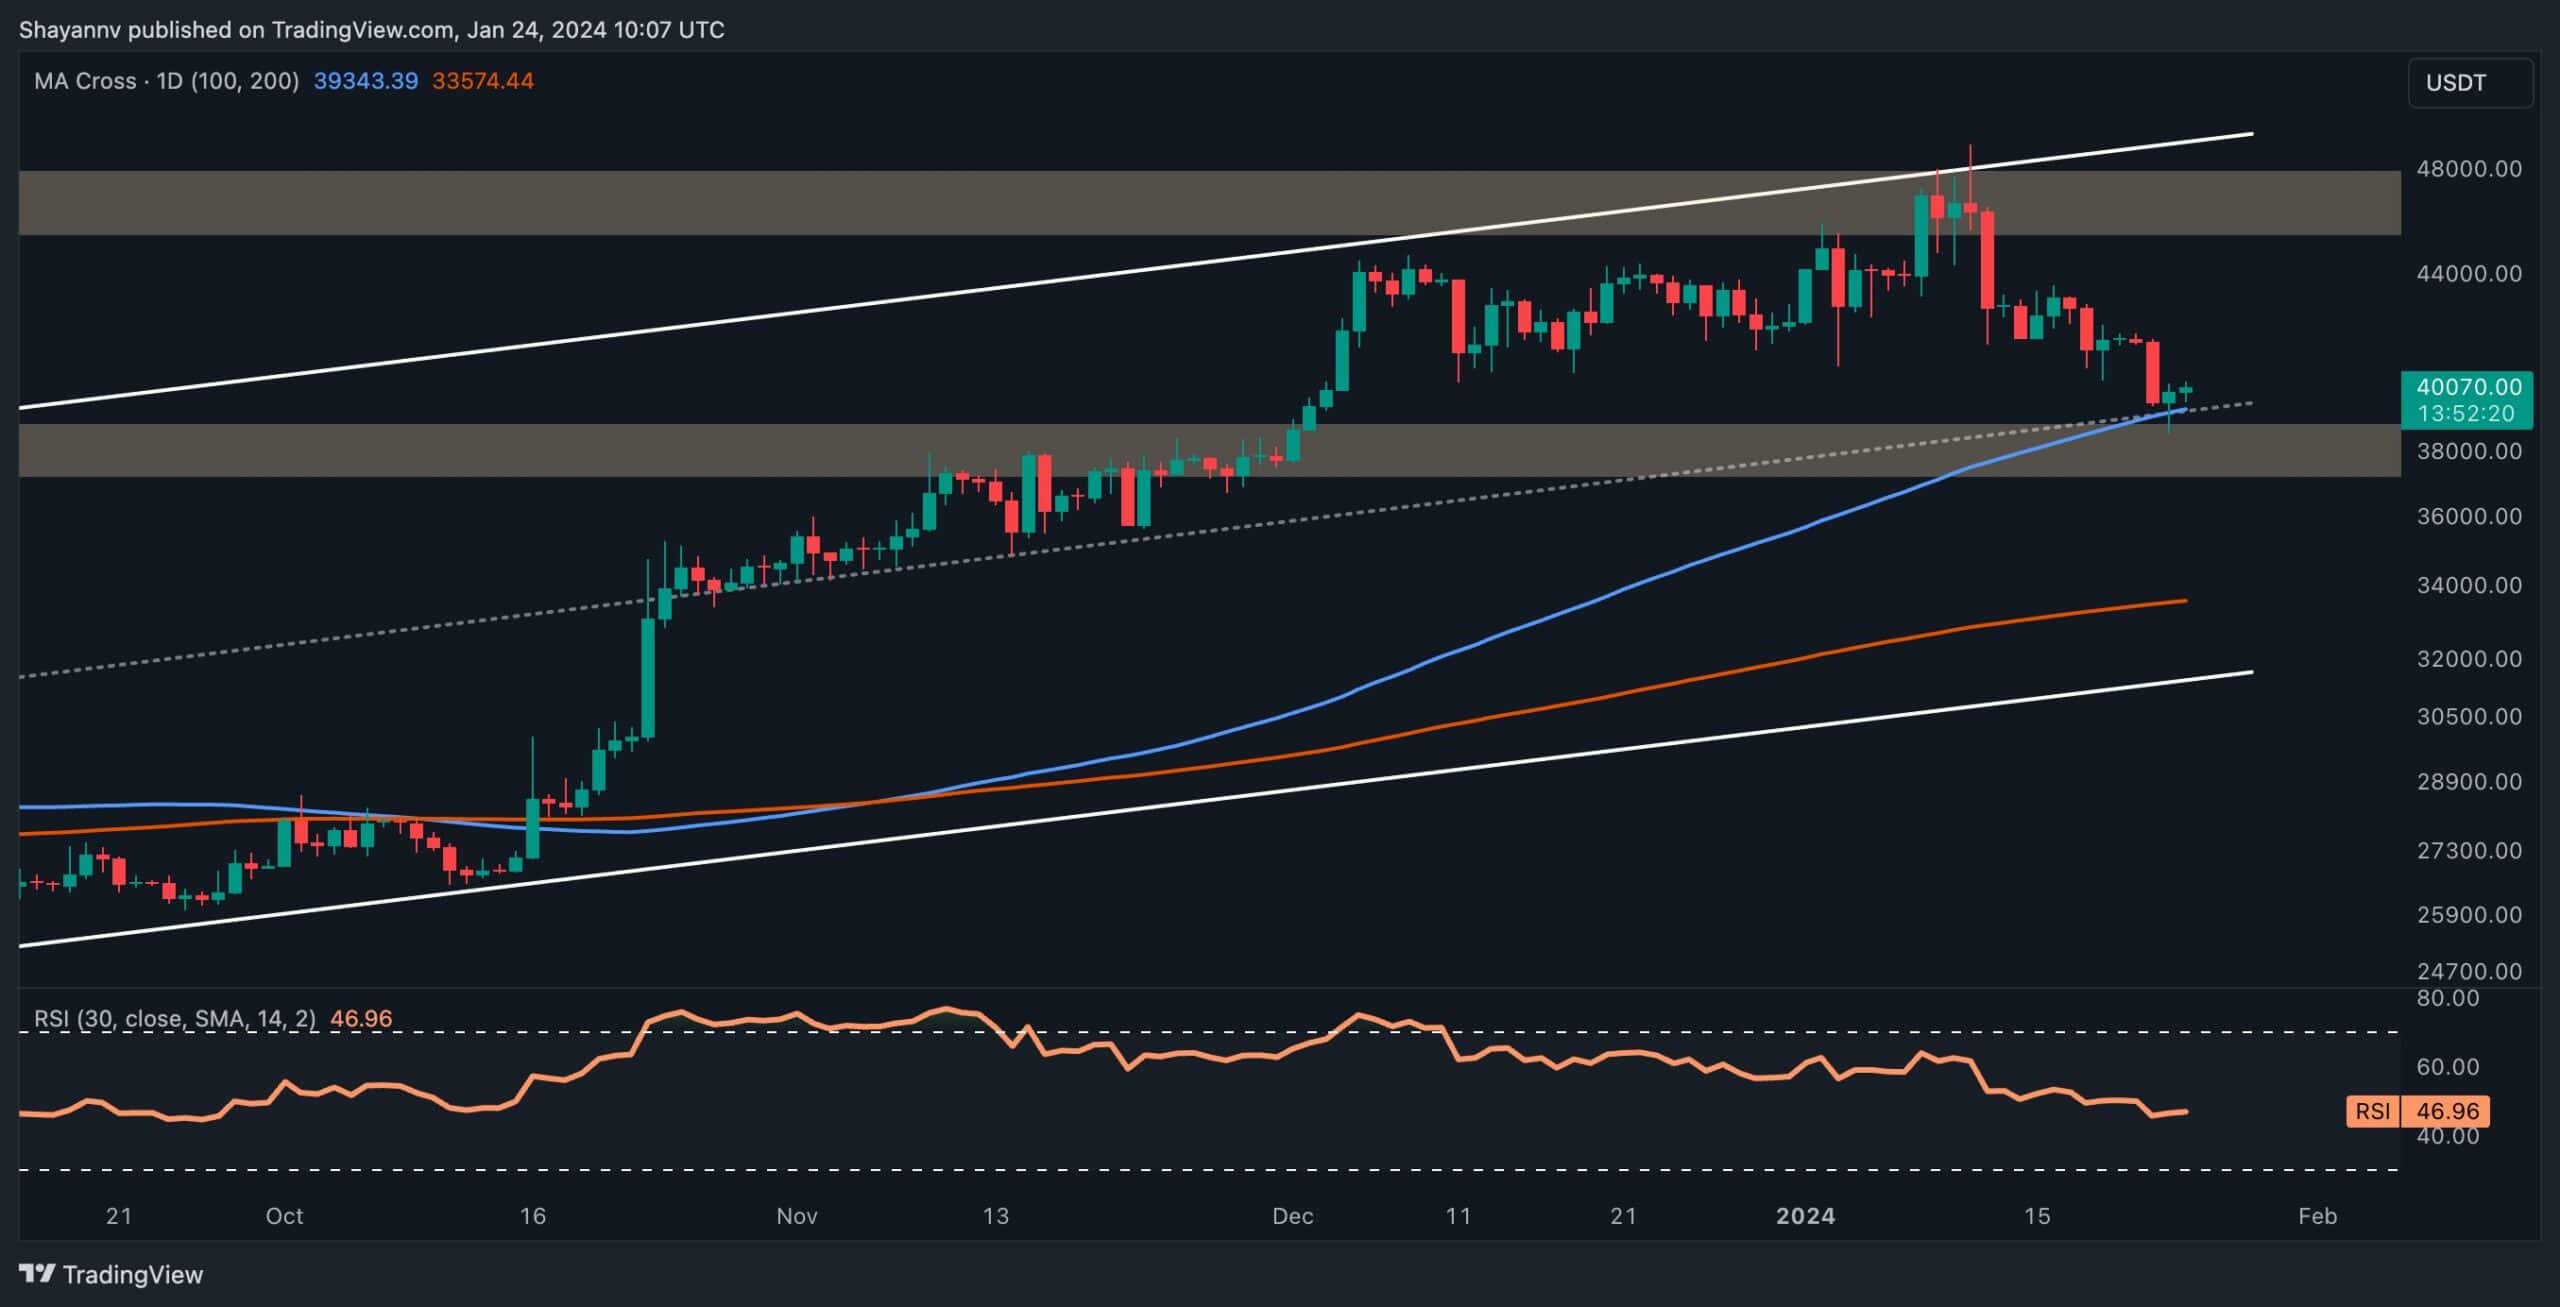
Bitcoin’s retracement has expanded, driven by heightened selling pressure, pushing the price toward a pivotal and decisive support region that includes the critical 200-day moving average and the middle boundary of the ascending channel.
The price action within this significant range holds paramount importance in shaping Bitcoin’s future trajectory.
By Shayan
Upon analyzing the daily chart, it becomes evident that Bitcoin’s recent correction has extended, resulting in a notable decline. However, the retracement’s downward momentum has been temporarily halted upon reaching a crucial support range, marked by the middle boundary of the ascending channel and the pivotal 200-day moving average at $39K, providing robust support for buyers.
Given the strength of this support range and the potential presence of significant demand, it seems likely that the price will find support for the time being, leading to a phase of sideways consolidation. In this scenario, the recent downturn will serve as a necessary correction stage, laying the foundation for a renewed bullish surge.
Nevertheless, an unforeseen break below the 200-day moving average could trigger a cascade effect, reintroducing fear into the market. However, Bitcoin’s price action within this pivotal zone remains crucial for anticipating the cryptocurrency’s mid-term prospects.
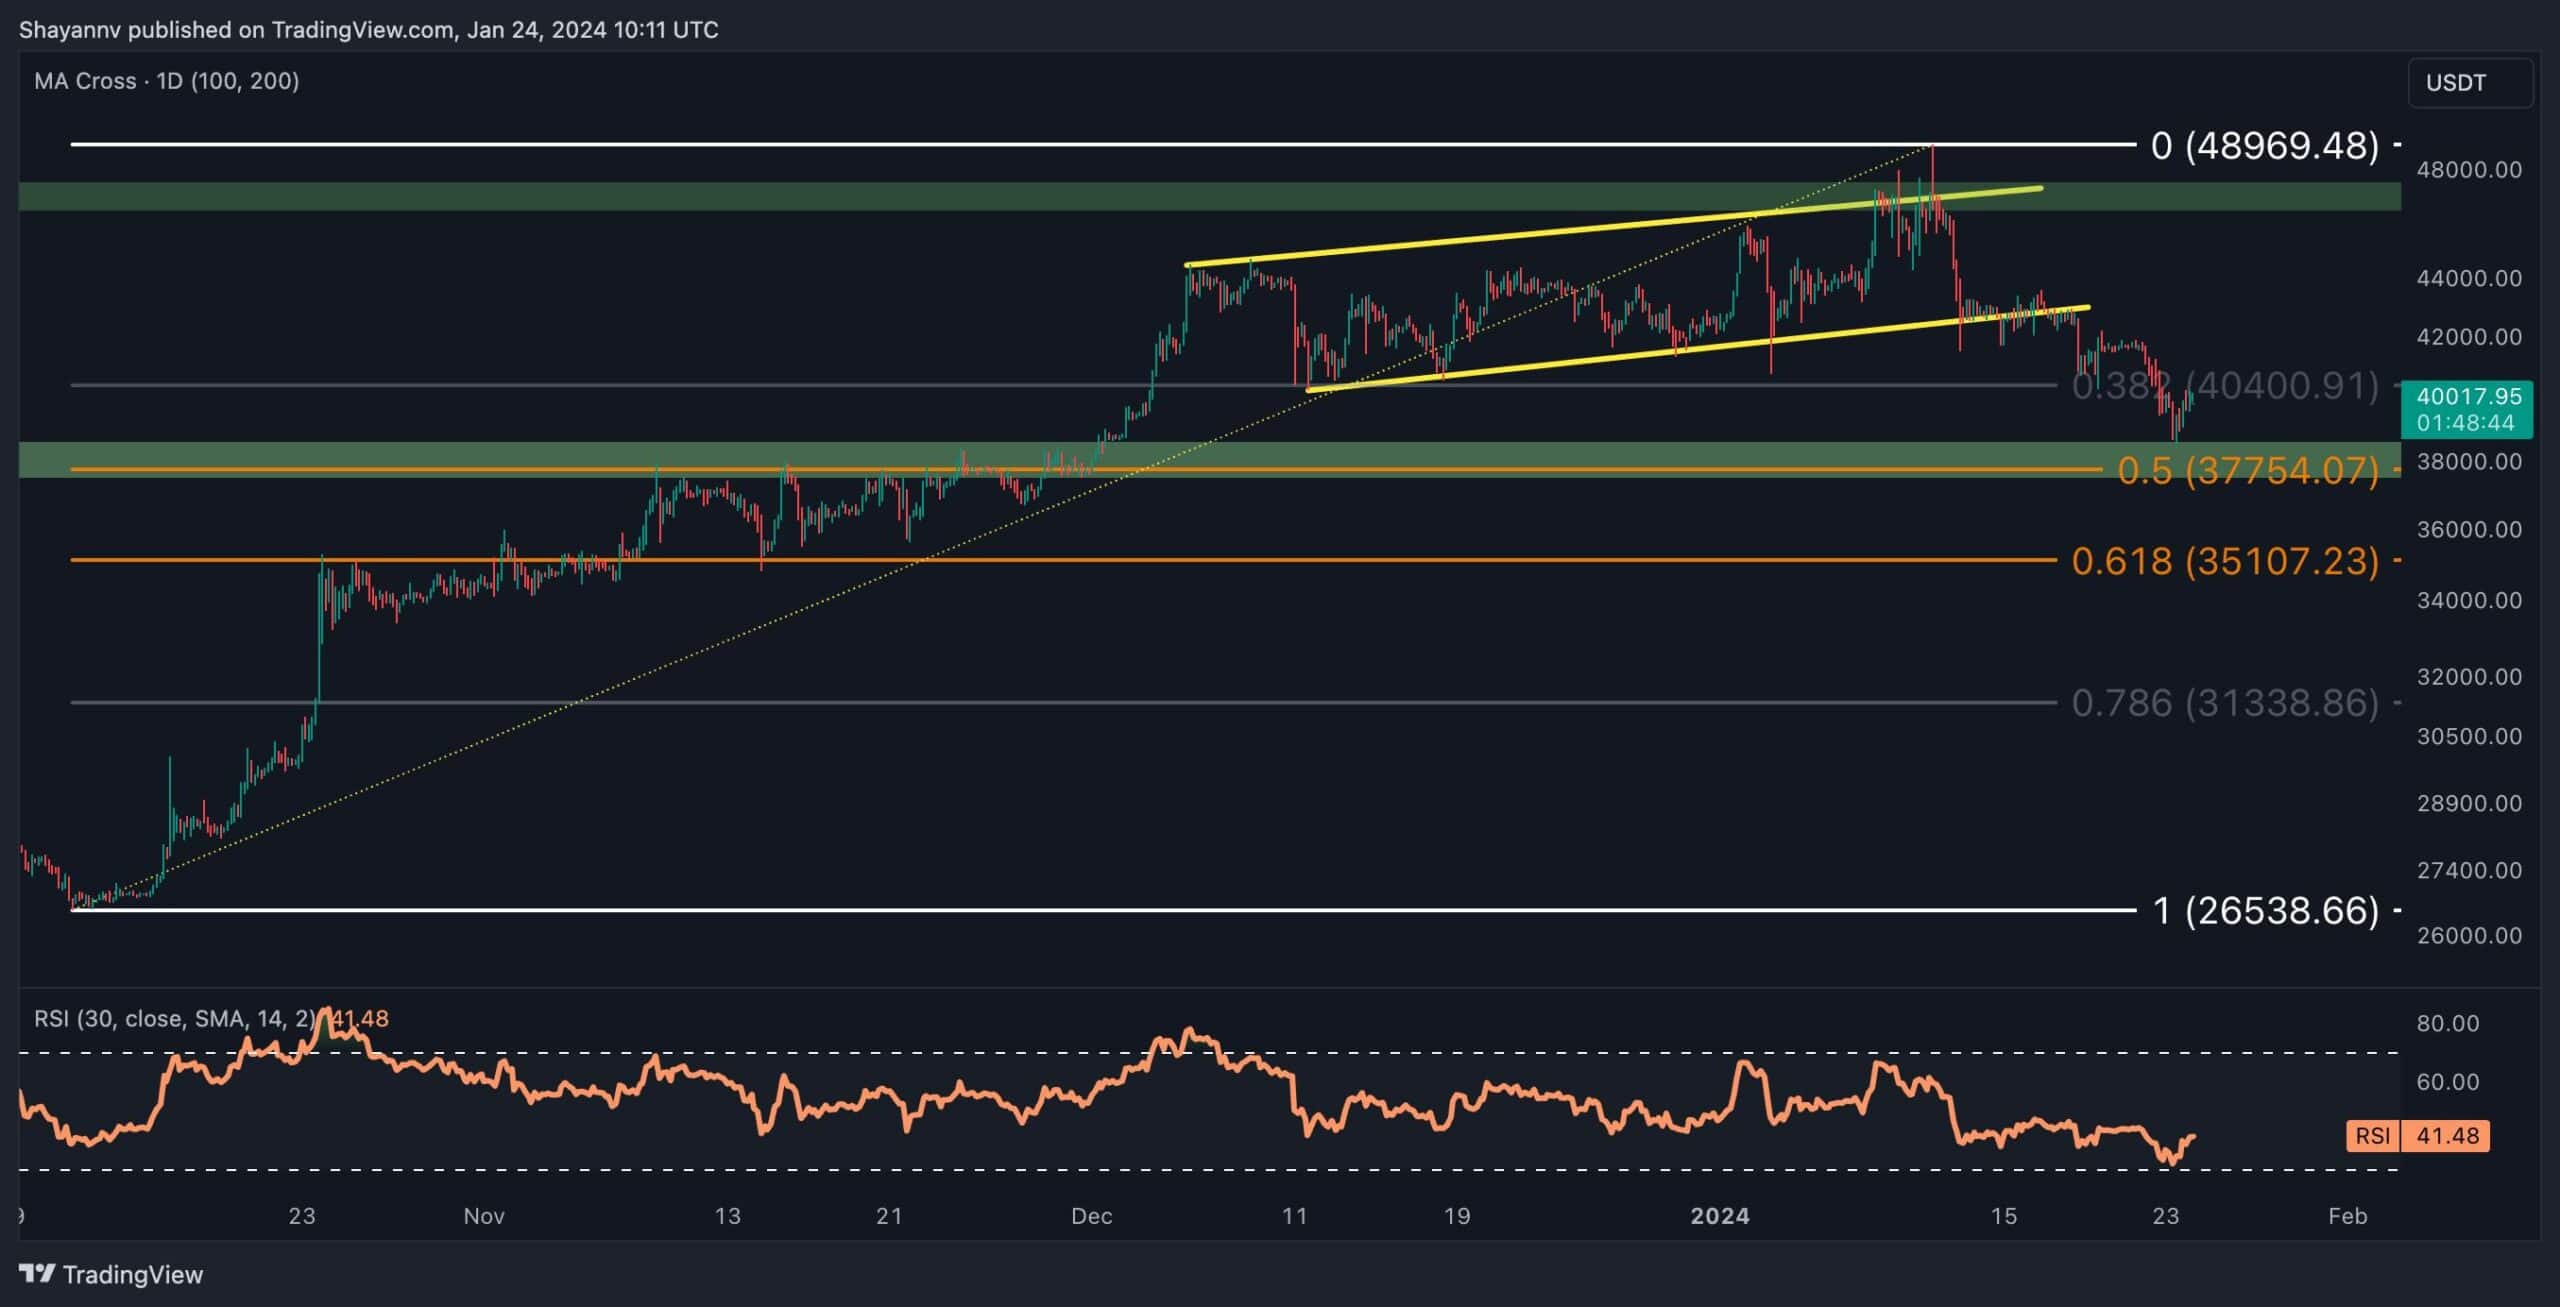
Examining the 4-hour chart reveals that the rejection from the $48K resistance zone prompted the price to breach the lower boundary of the ascending flag, signaling the prevailing bearish sentiment in the market. Following a successful pullback to the broken level, the price initiated another significant bearish leg, suggesting a distribution behavior among market participants, particularly smart money.
Despite these bearish signals, Bitcoin has reached a critical and substantial support region, encompassing the static support of $39K and aligning with the significant 0.5 level of Fibonacci retracement, acting as a formidable barrier against sellers’ downward attempts.
Consequently, the most probable short-term scenario involves a resurgence in buying pressure, supporting the price and initiating a bullish retracement. However, a sudden break below this crucial support will open the path for the continuation of the recent decline toward the 61.8% level of the Fibonacci retracement at $35.1K.
By Shayan
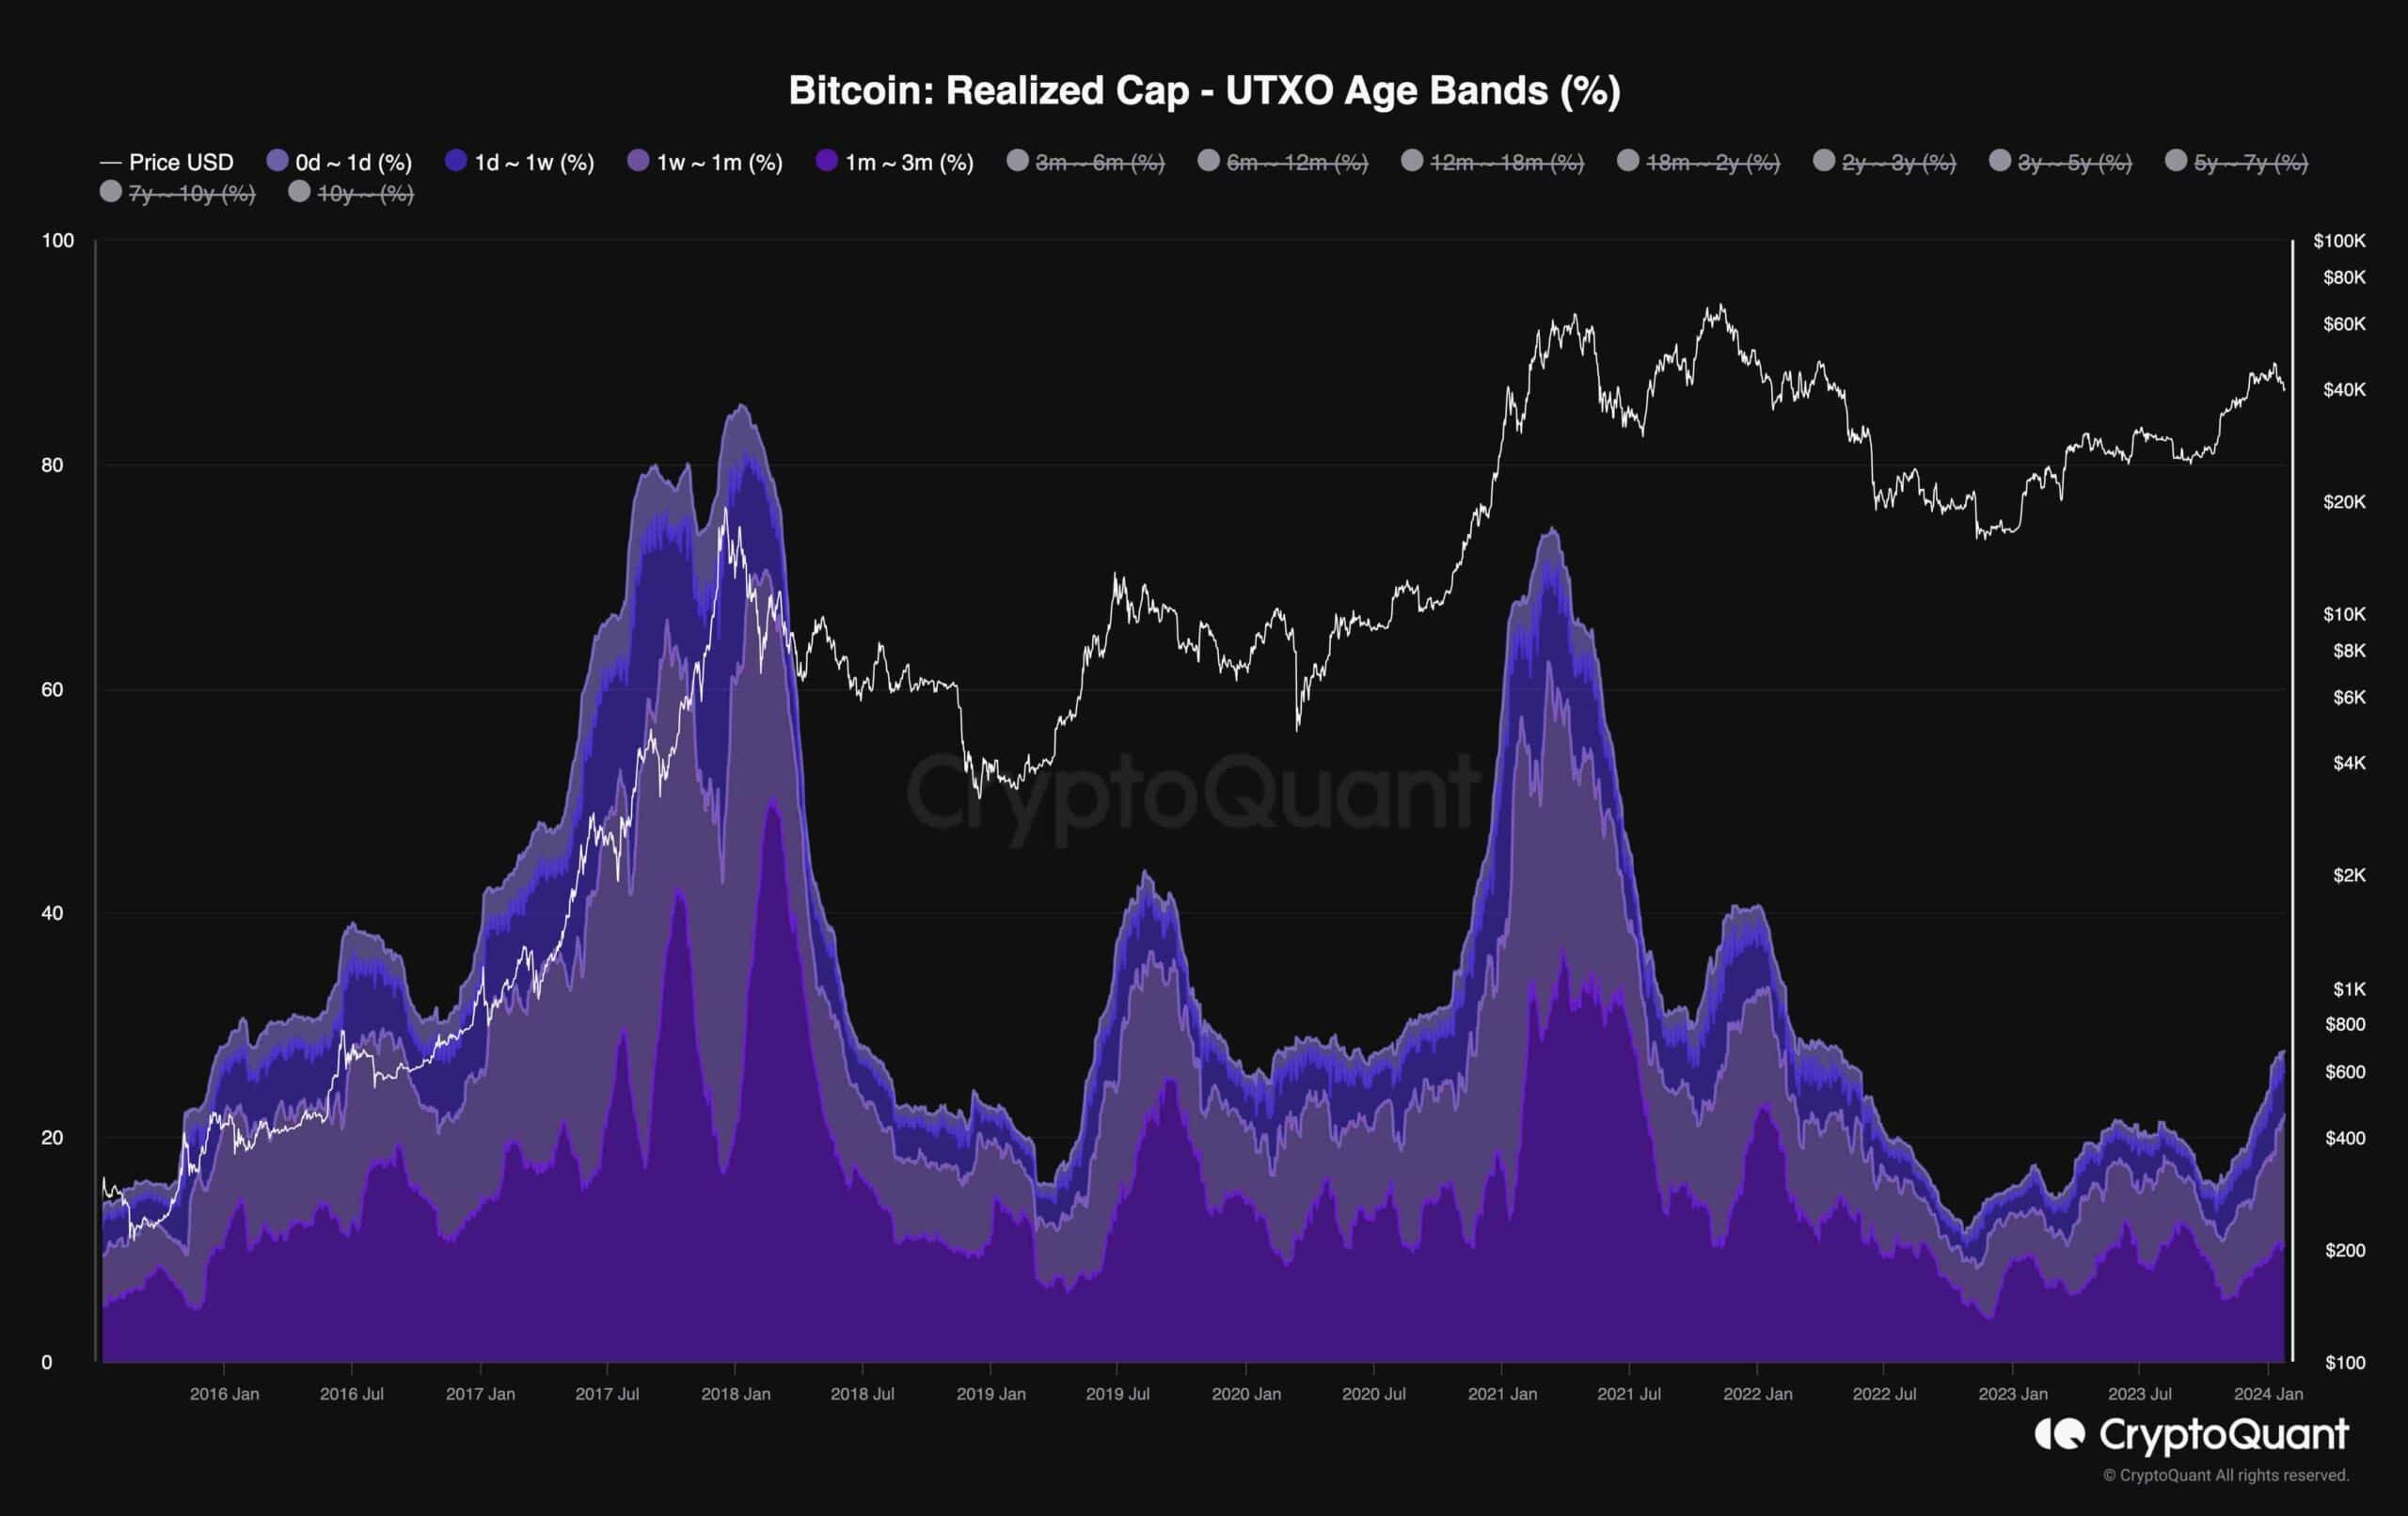
The Realized Cap, as gauged through UTXO Age Bands, offers valuable insights into the distribution of realized capitalization based on the age of unspent transaction outputs (UTXOs). Each distinct band denotes the share of Realized Cap associated with UTXOs that were last utilized within a specific timeframe. Essentially, upswings in these age bands point to periods marked by HODLing and accumulation within the Bitcoin market, while downturns suggest heightened selling and distribution activities.
Presently, following a noteworthy upward trend, Bitcoin has transitioned into a corrective phase owing to the selling pressure stemming from spot ETFs and the recent impulsive surge in its price.
Despite the ongoing correction, an analysis of the percentage of volume acquired within a span of fewer than three months indicates that Bitcoin has yet to approach its yearly peak. Accordingly, it seems premature for the market-leading whales to conclude their bullish trajectory. Nevertheless, following a 1-2 month adjustment period, there is a high probability that the price will experience a renewed surge, aiming to mark a new ATH.