Bitcoin’s recent price spikes underline the demand and confidence in the crypto market. This resulted in a significant surge in many cryptocurrencies. However, the price still faces a critical resistance level of $25K before calling the bear market over.
By Shayan
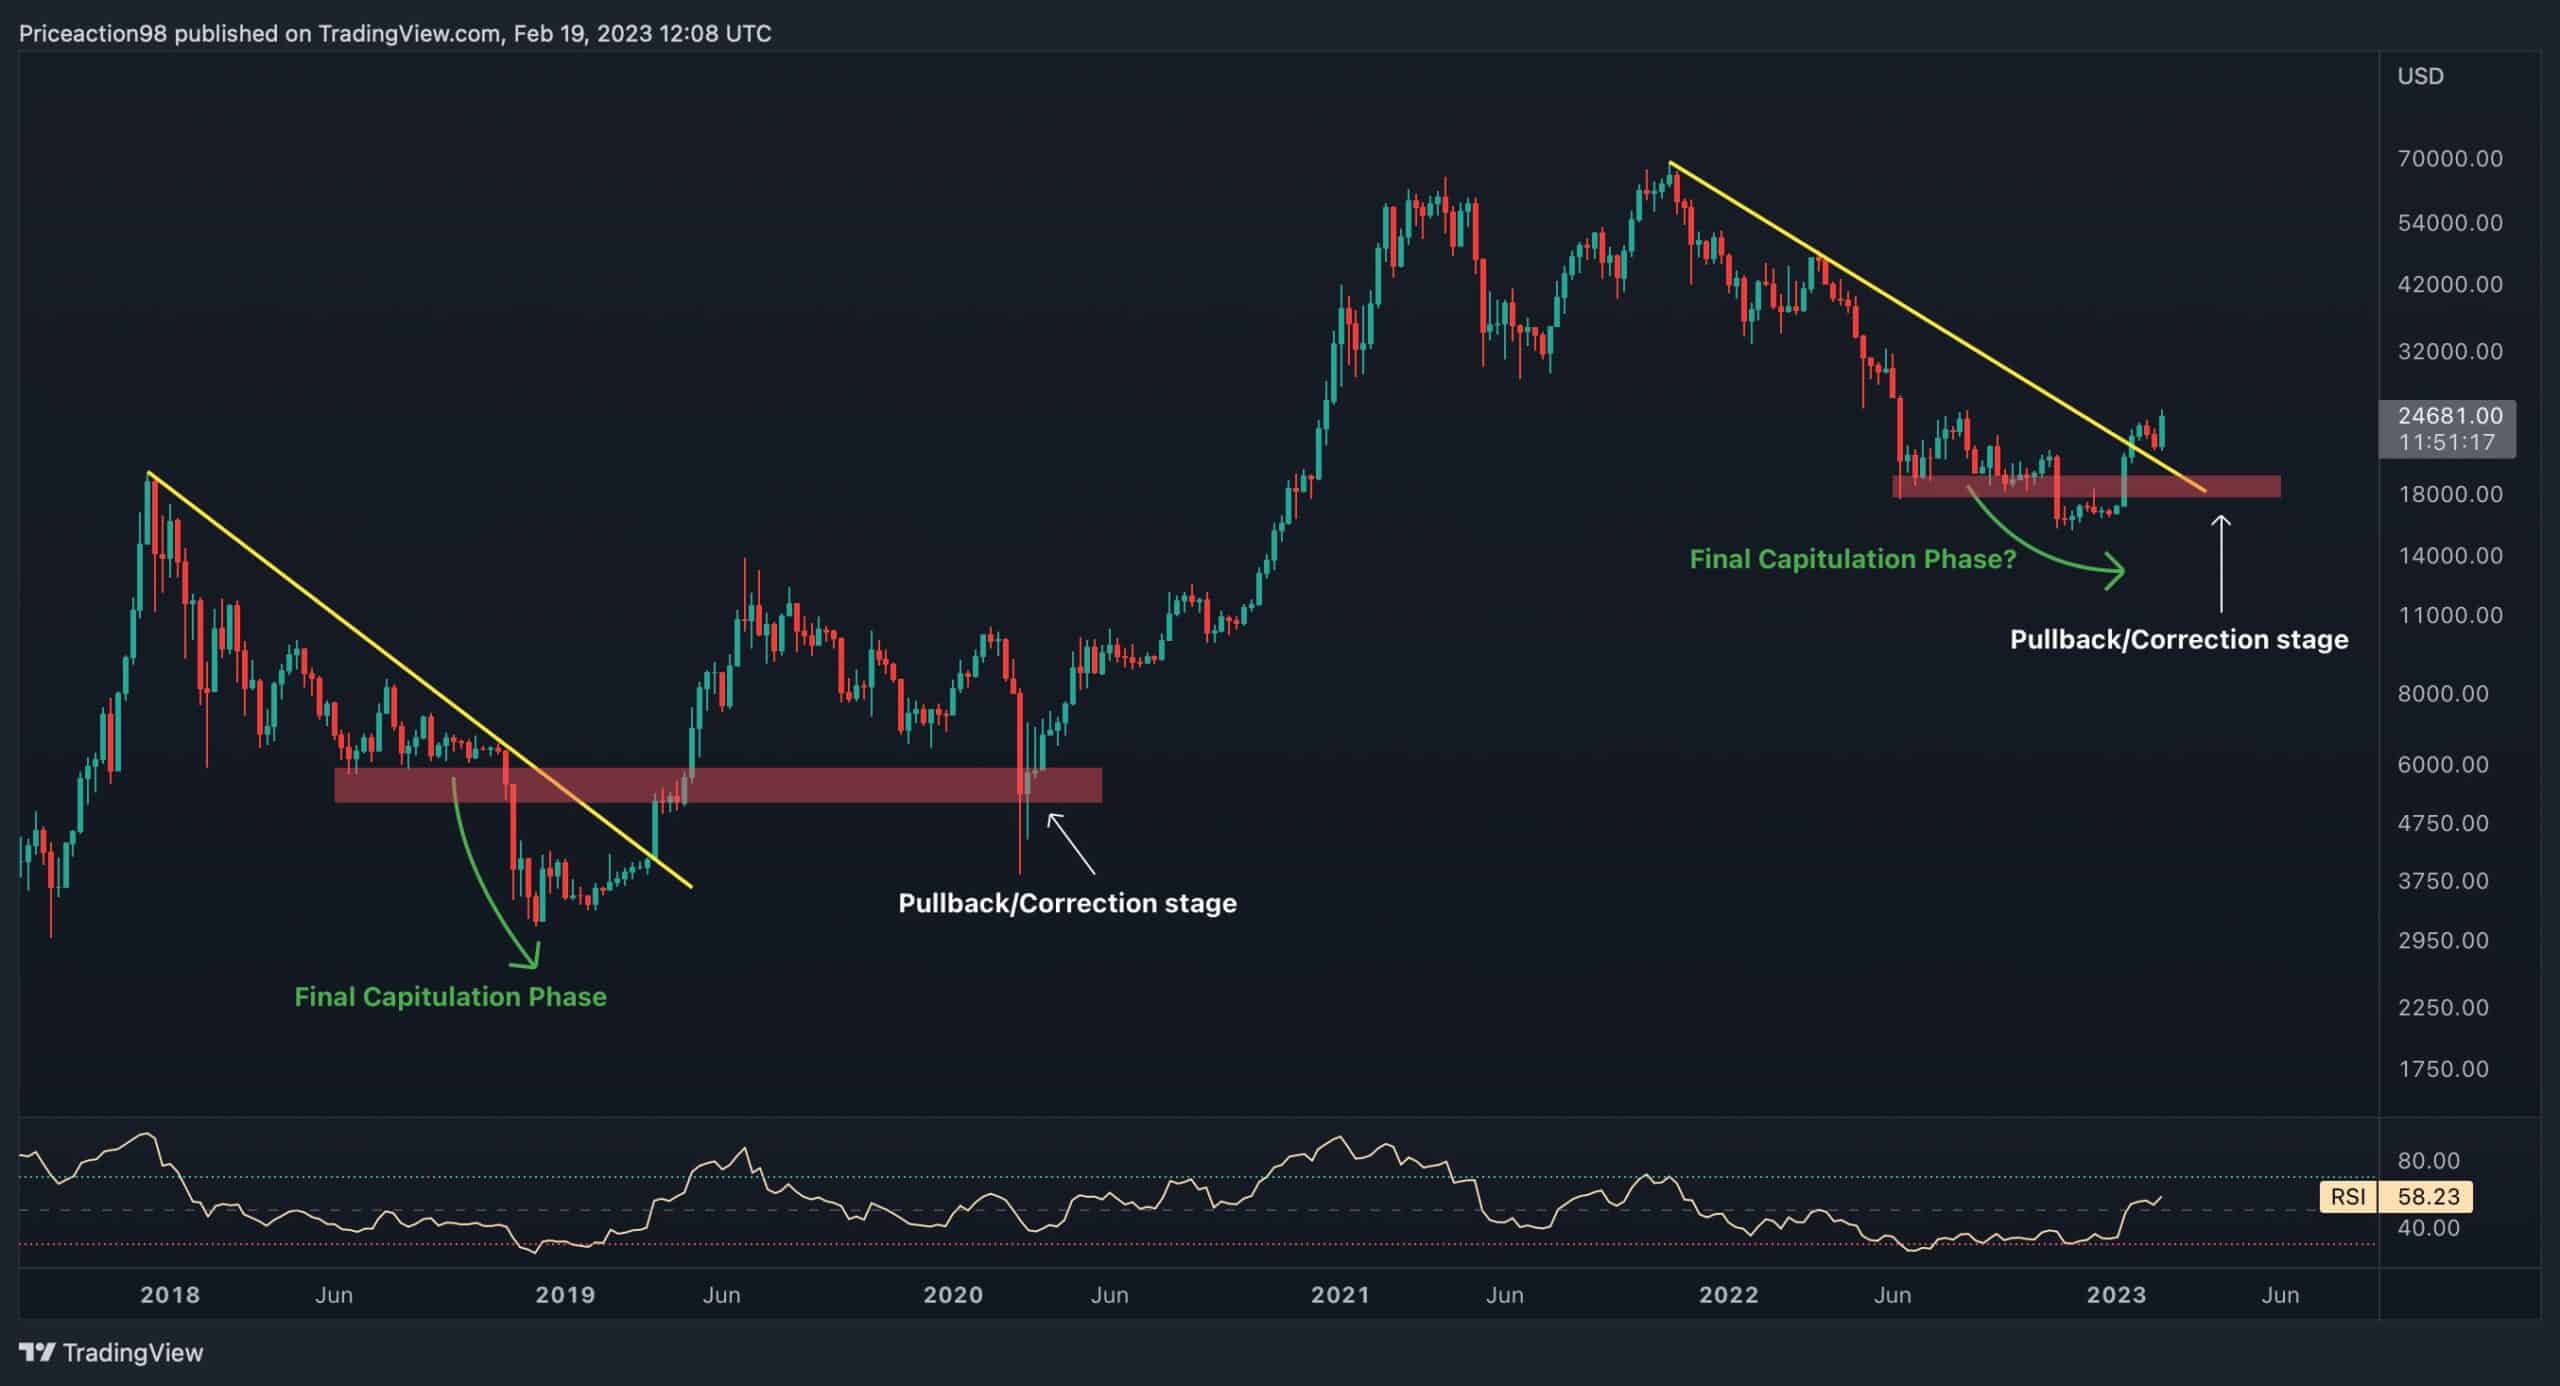
Looking at a bigger picture of Bitcoin’s price using the weekly timeframe, the price action looks similar to the final capitulation stage of the 2018 bear market. During the final phase of the 2018 bear market, Bitcoin’s price declined significantly and experienced a 50% plummet. As a result, many market participants capitulated and realized substantial losses. Then, Bitcoin found its bottom and surged unexpectedly, initiating the 2019 bull run.
The same structure is occurring now; after a massive downtrend, declining to the $15K level, the market experienced a series of capitulation events. It has recently begun an uptrend, surpassing many essential resistance levels.
Despite the portrayed resemblances, it might be soon to call it a bull market as it requires more consideration.
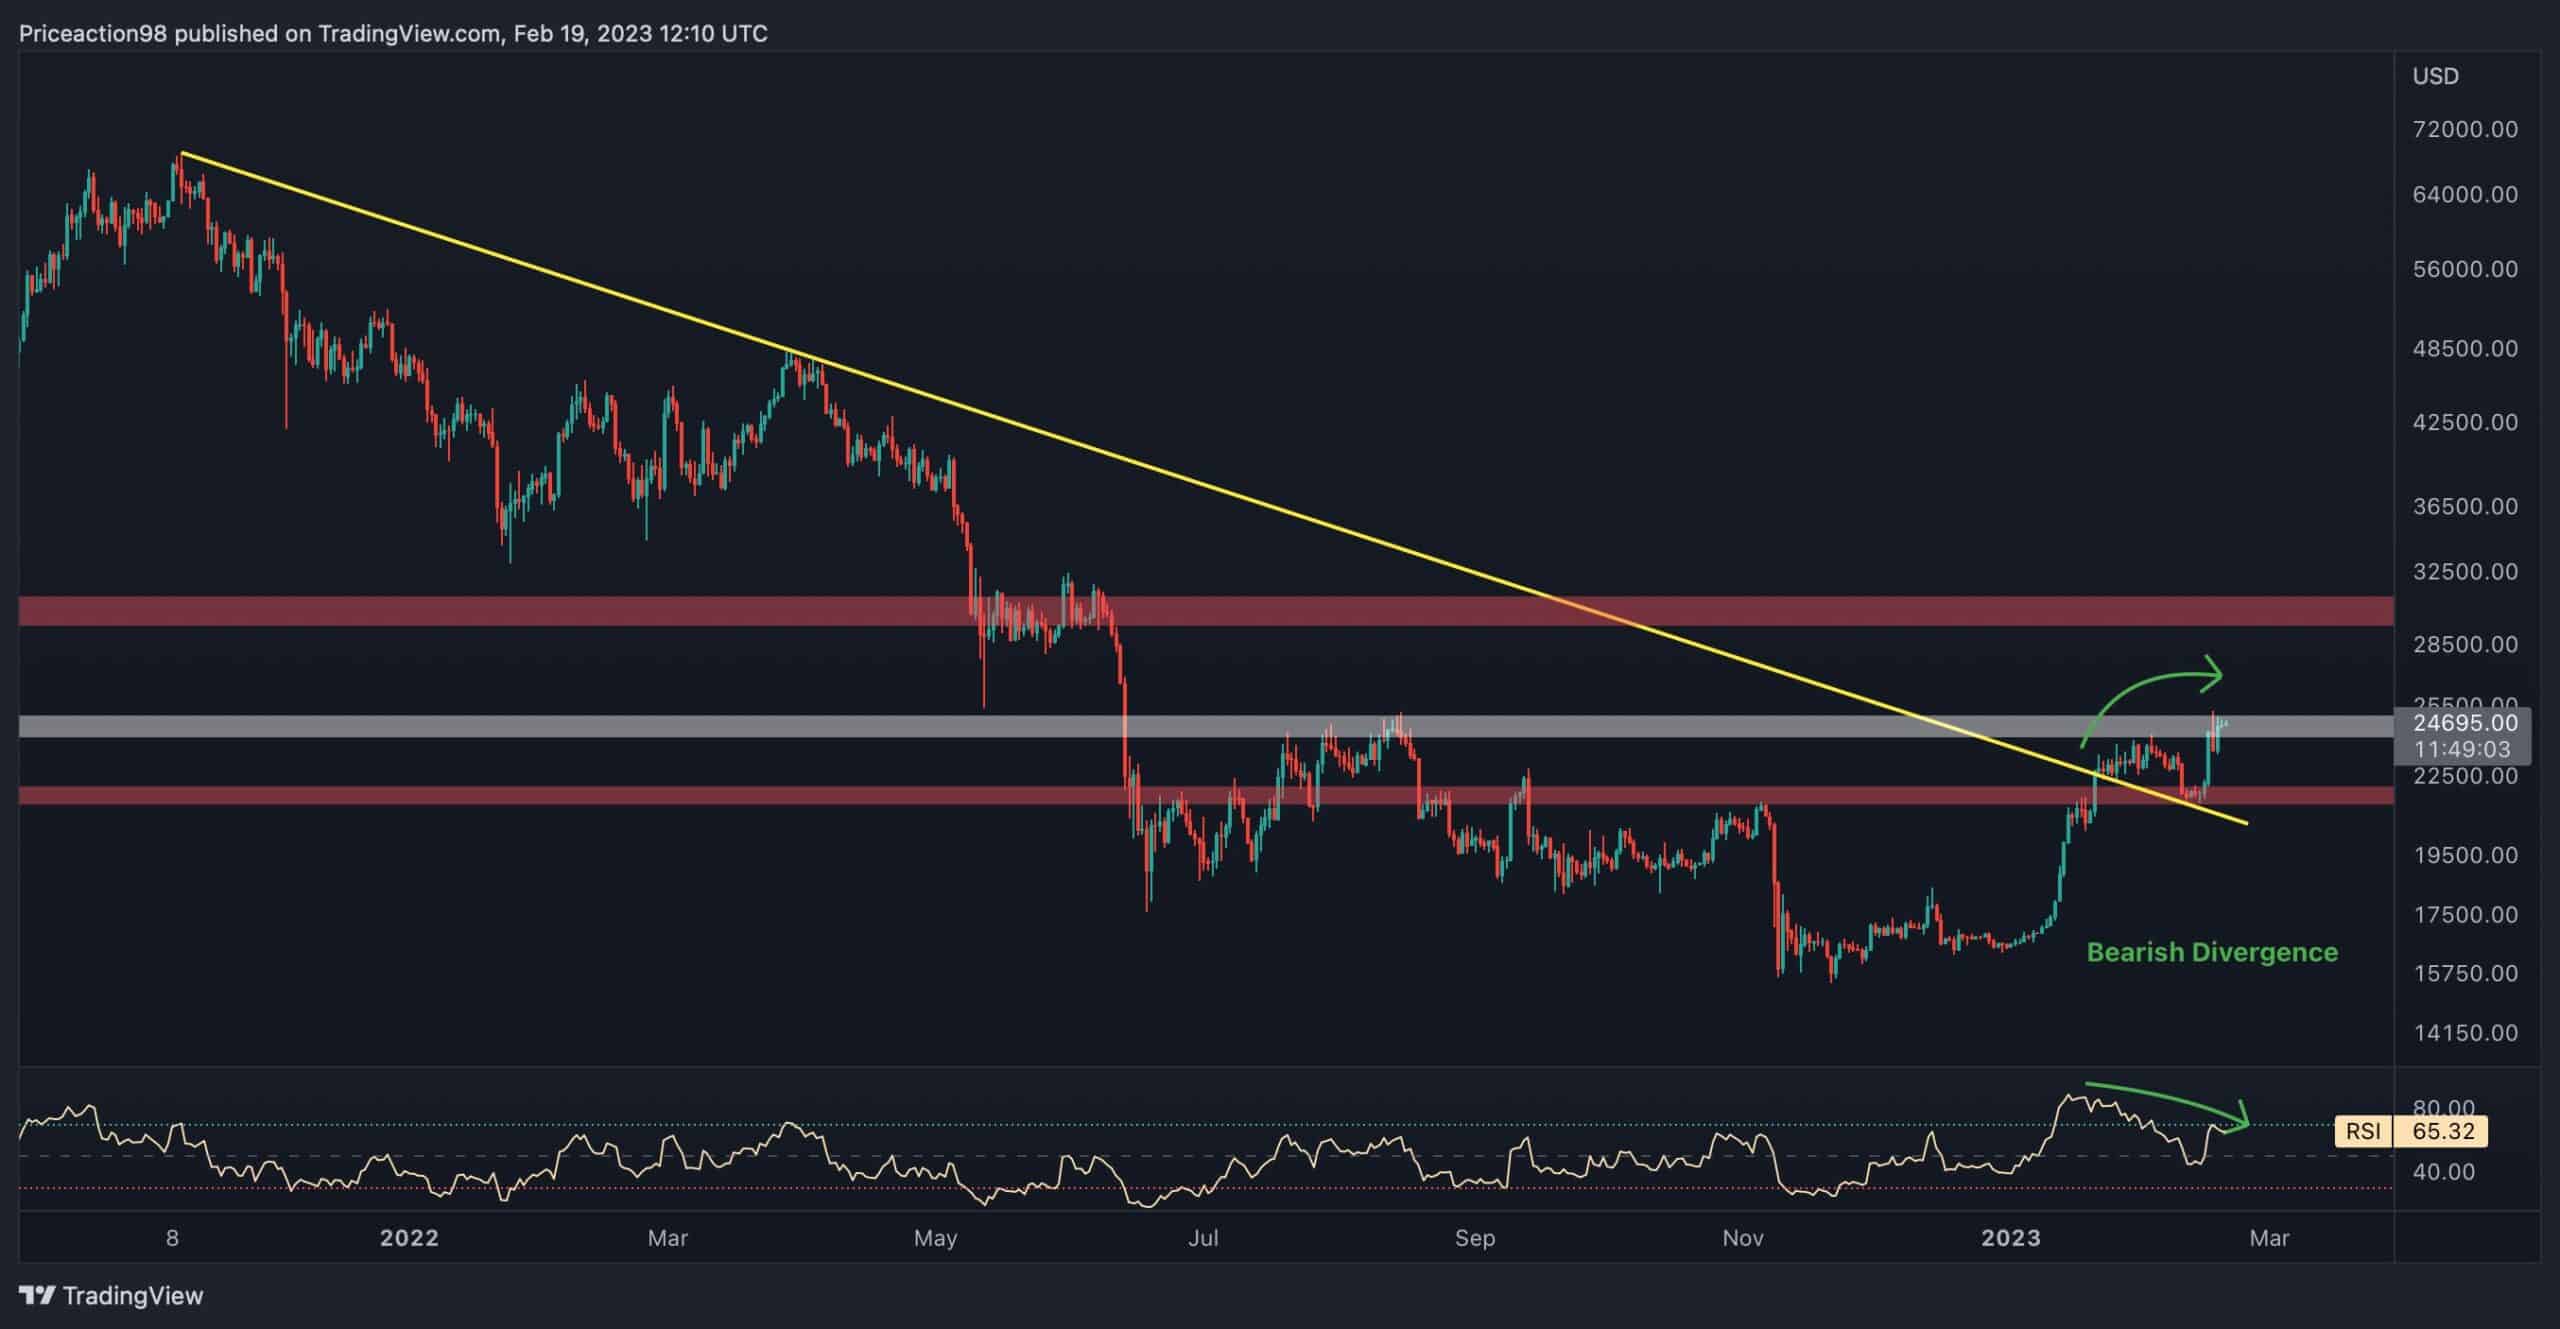
On the daily timeframe, it is evident that the price surpassed the multi-month descending trendline, entered a correction phase, and formed a pullback. During the correction stage, the price retested the broken trendline and was supported by the $22K support level.
However, Bitcoin has reached a crucial and decisive resistance level of $25K. It is a technical and psychological barrier and has been the main one to the price since mid-June 2022. Yet, if BTC surpasses this level, an impulsive surge toward the next resistance region, the $30K level, will be more likely.
Nevertheless, a bearish divergence exists between the price and the RSI indicator, which might lead to a short-term correction for the price before attempting to break the $25K level.
By Shayan
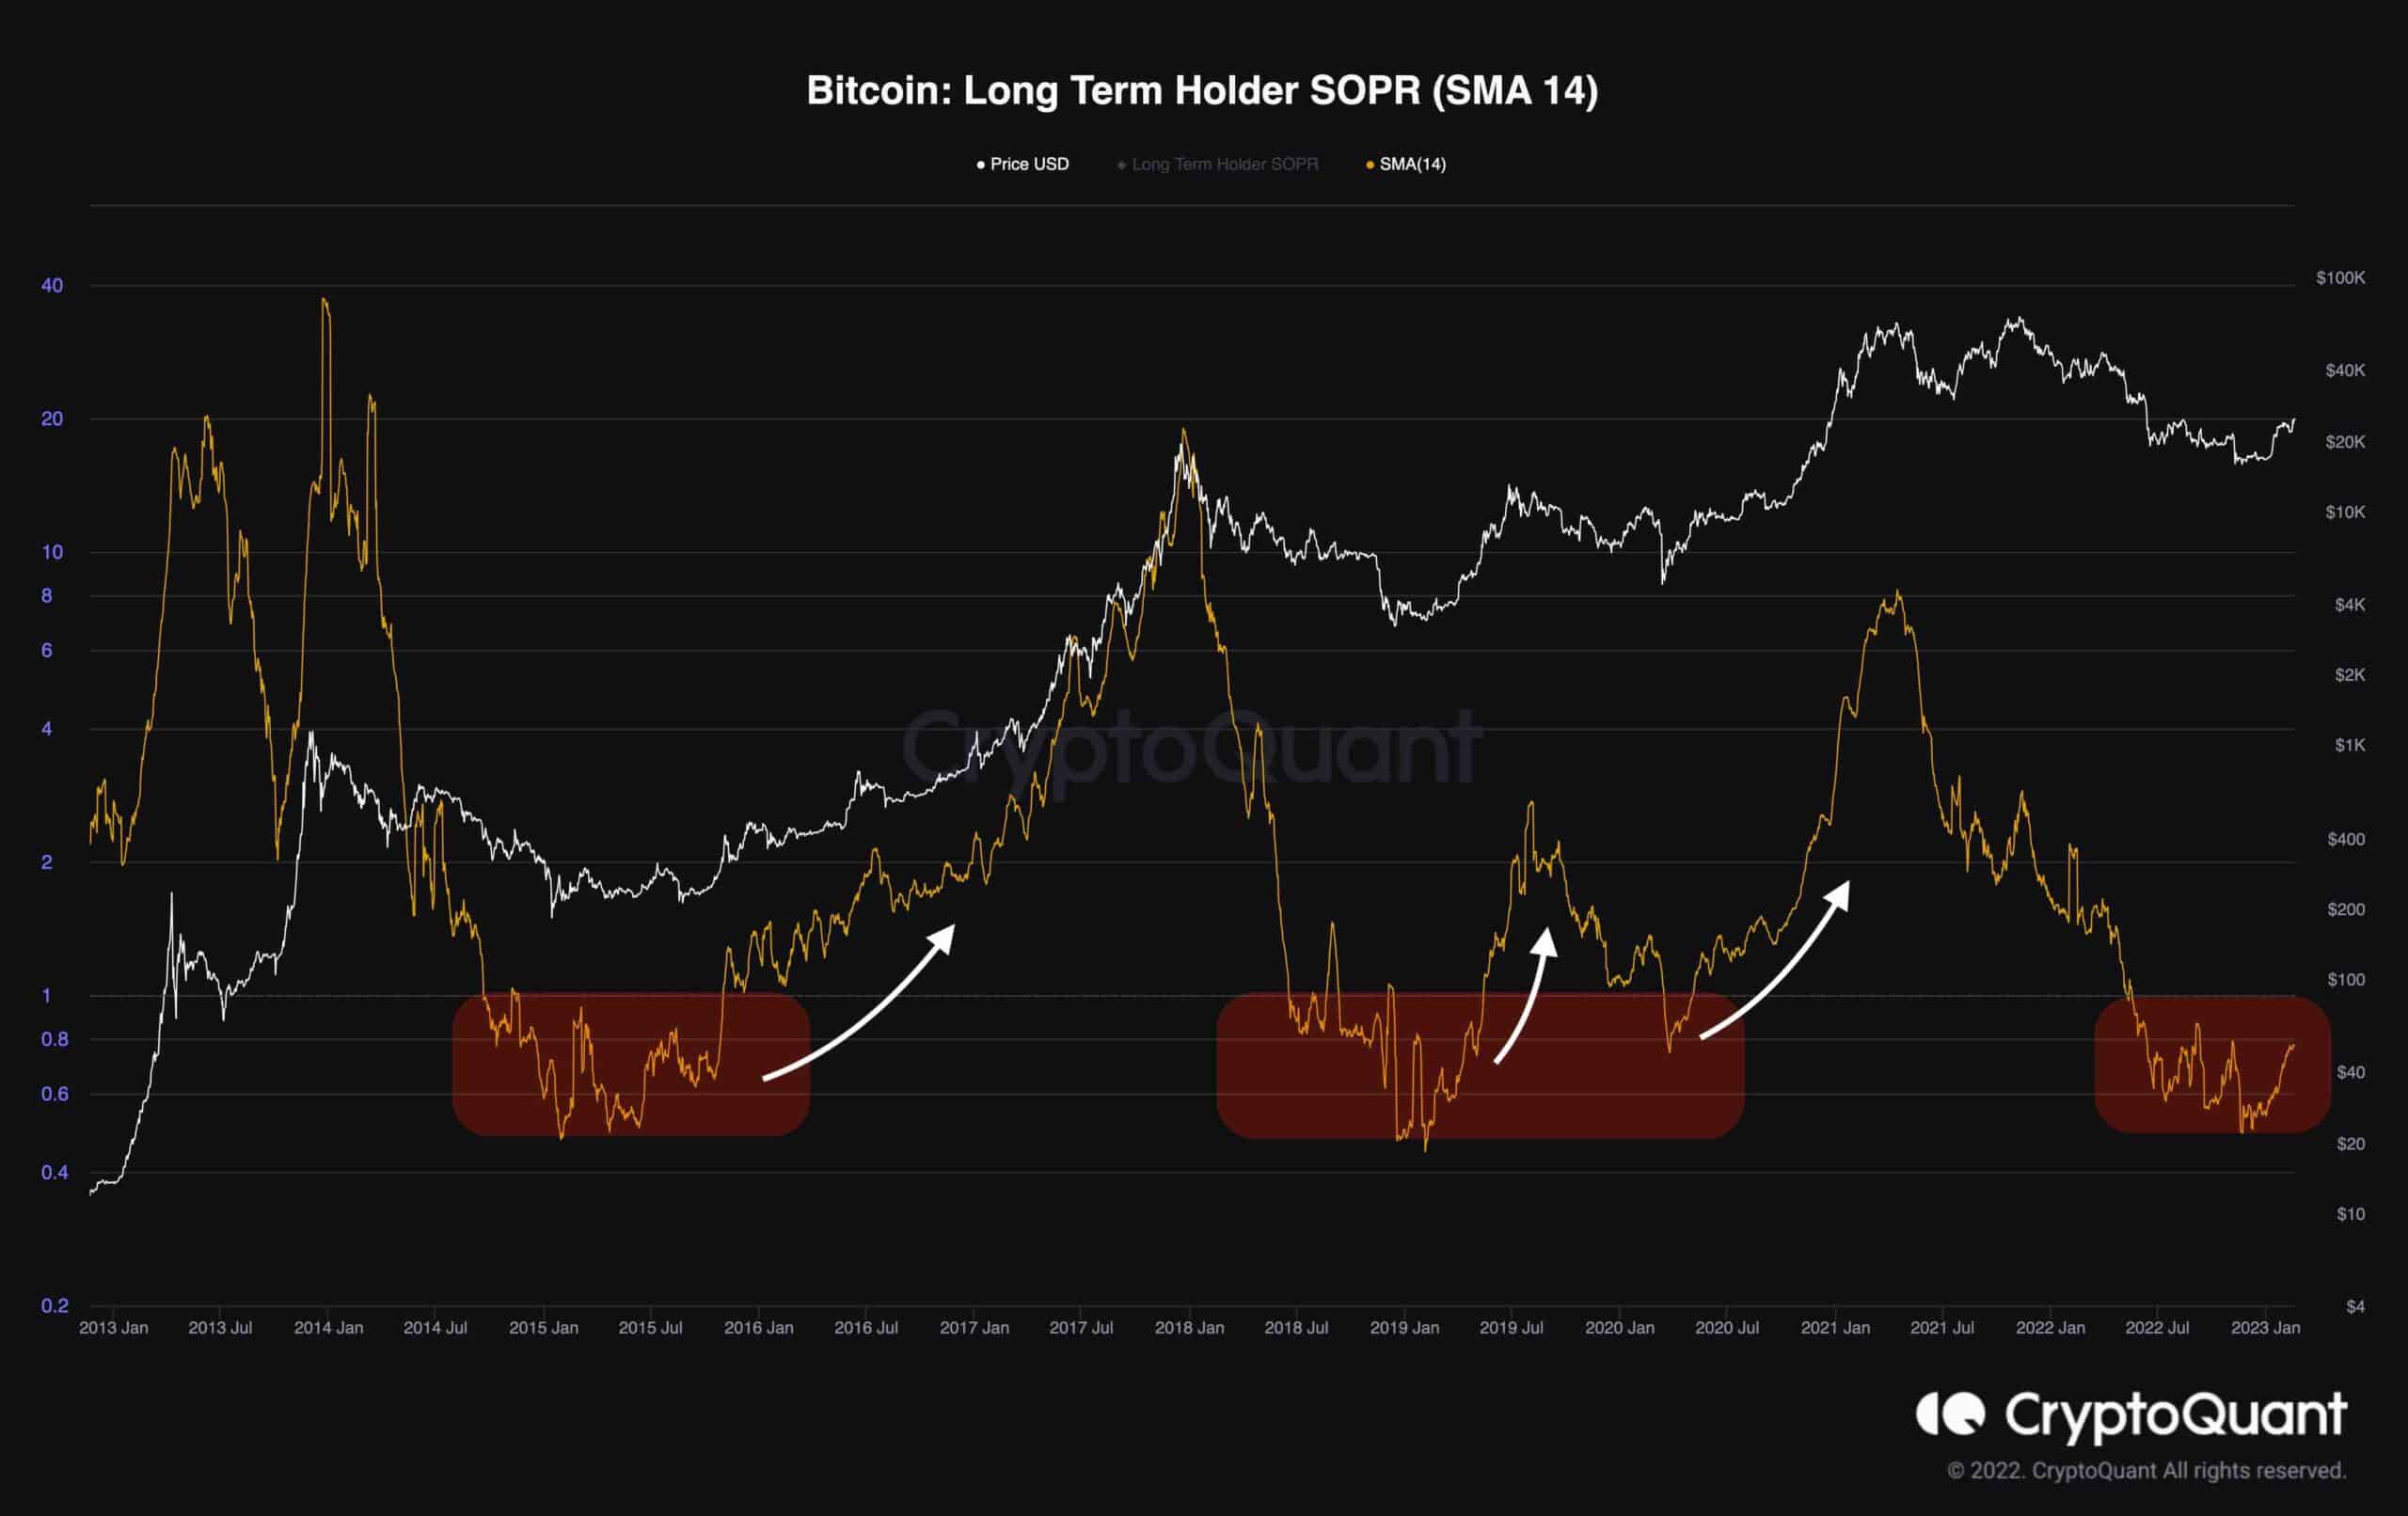
The bitcoin bear market has resulted in huge losses for all participants in recent months. Even long-term investors, who usually spend their coins in profit, are now experiencing losses. It is common for long-term holders to act this way during the late phase of a bear market when all market participants panic sell or “capitulate.”
A long-term holder’s SOPR metric measures how much profit or loss they realize. Since late May 2022, this metric has trended below one, indicating that long-term holders are losing money.
Historically, the bull market’s beginning was simultaneous with the metric crossing above one. Most recently, the metric started recovering and slightly increased due to the uptrend in Bitcoin’s price.
Yet, it is still too early to name the $15.5K level the bear market’s bottom, as the recent impulsive rally could be a bull trap. It is important to closely watch the long-term holders’ SOPR metric in the short term to anticipate the price direction.