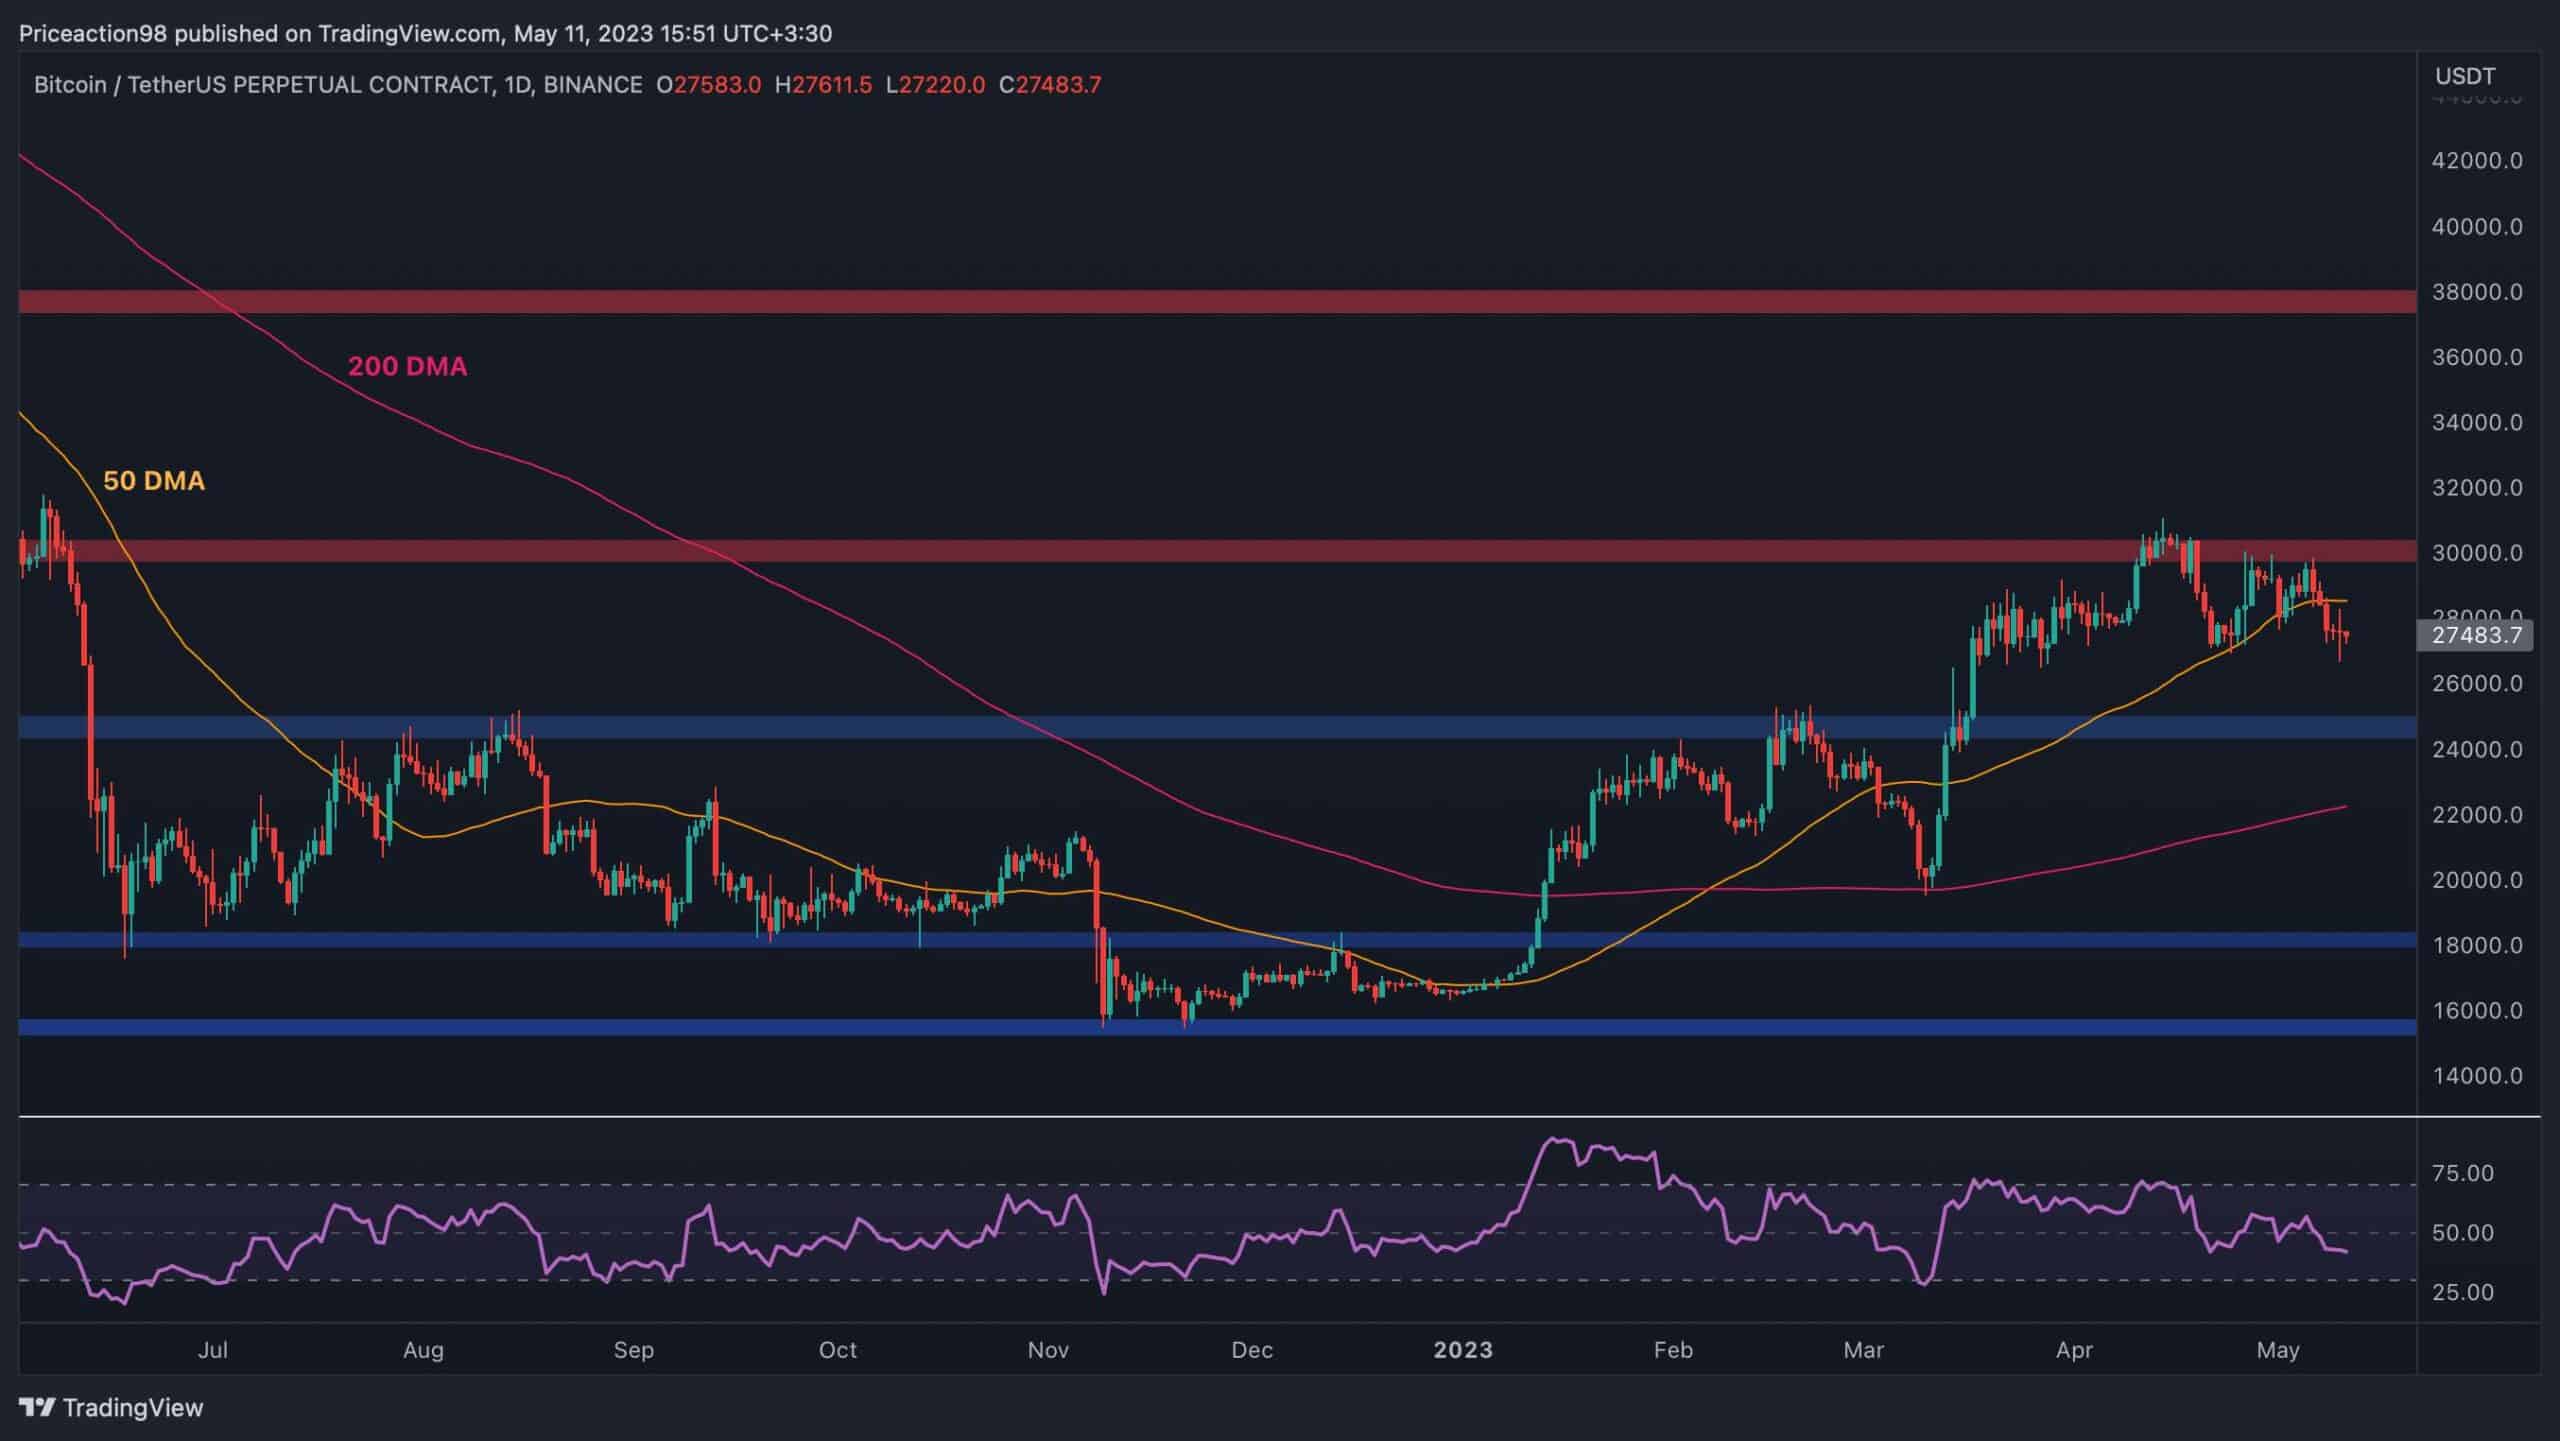
Bitcoin has been showing relatively bearish price action after a decisive rejection from the $30K resistance level, while also losing key support recently. Yet, there are still multiple crucial zones for the price to rely on.
By: Edris
The price has been consolidating below the $30K resistance level following a failed breakout earlier in April. The 50-day moving average has also been broken to the downside around the $28K mark as a result of the bearish pressure in the last few days.
The $25K support area could be the next target, followed by the critical 200-day moving average, located around the $22K level. Both are significantly important, and a break below them would be disastrous for buyers seeking an upward trend.
On the other hand, another break above the 50-day moving average would likely sabotage the bearish scenario, and the price would probably get past the $30K level this time around.
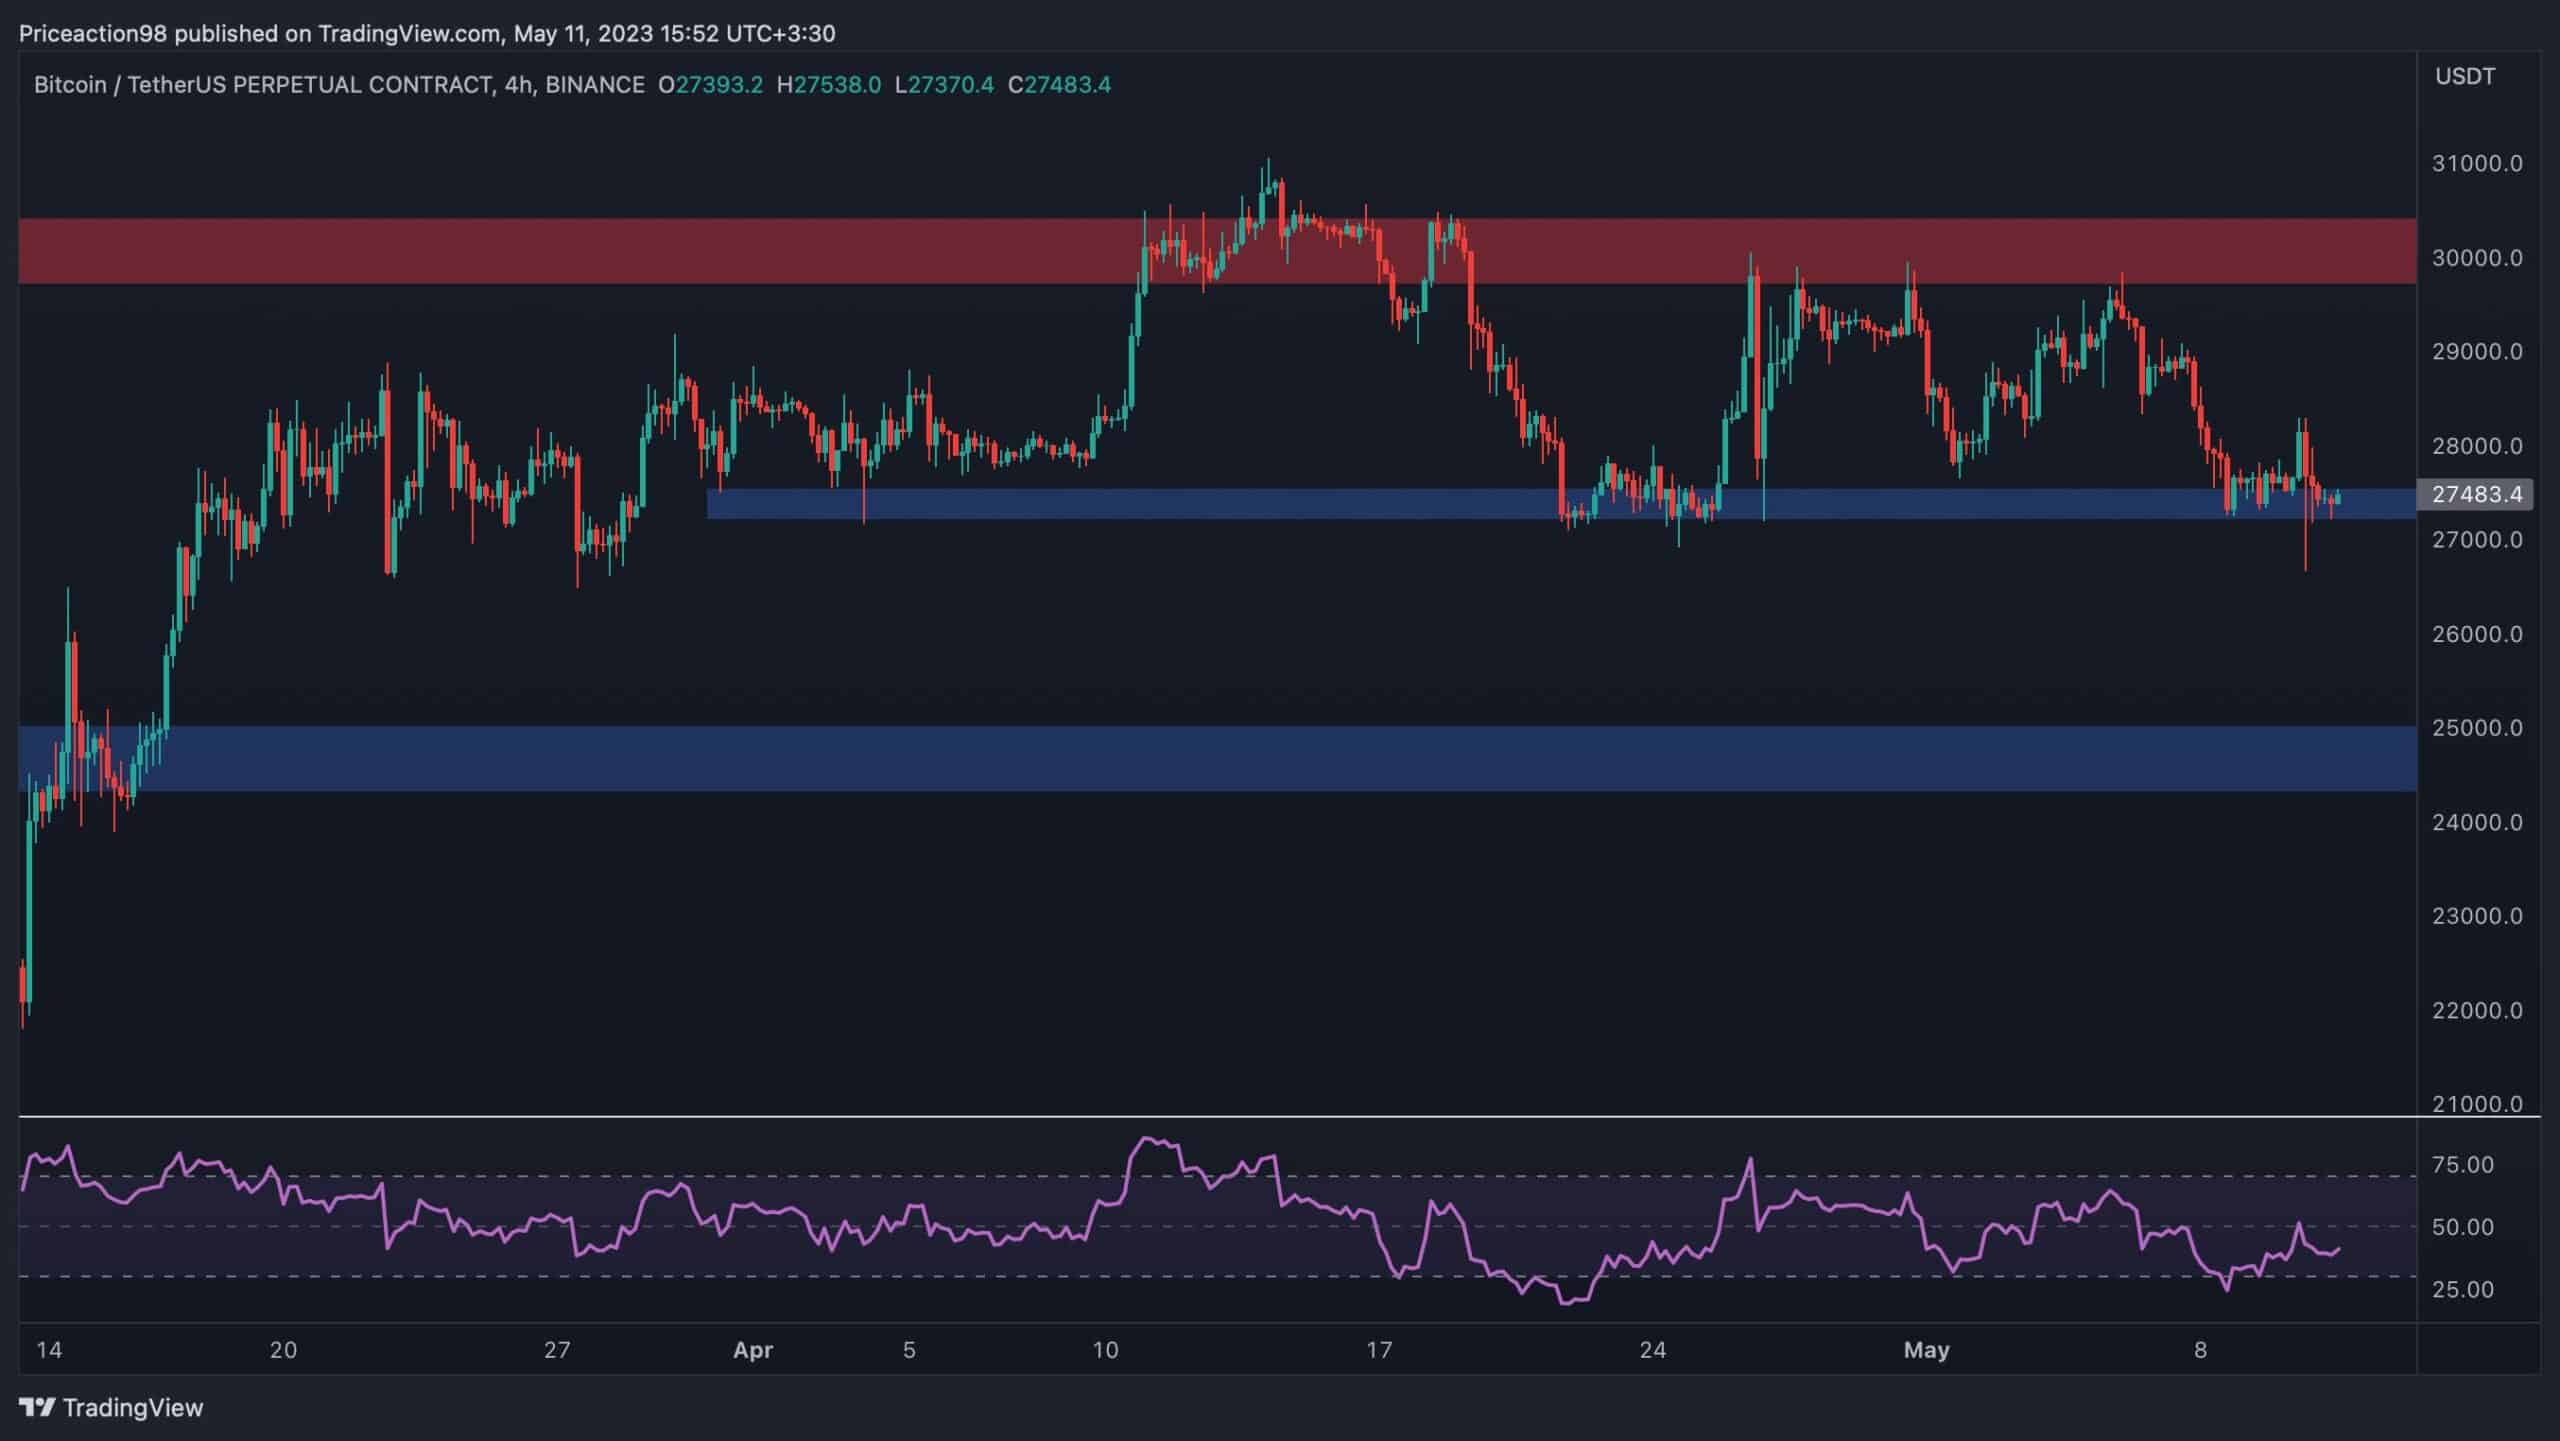
Looking at the 4-hour timeframe, the recent consolidation becomes more clear as the price has evidently been oscillating between the $30K and $27,500 levels for the past few weeks.
The $27,500 level, which is a significant support zone that has previously held the market on multiple occasions, is currently under fire, and a breakdown would result in a deeper drop toward the $25K range in the short term.
The RSI also shows values below 50%, which points to the bearish momentum in this timeframe. This further boosts the probability of a lower bearish continuation in the coming weeks.
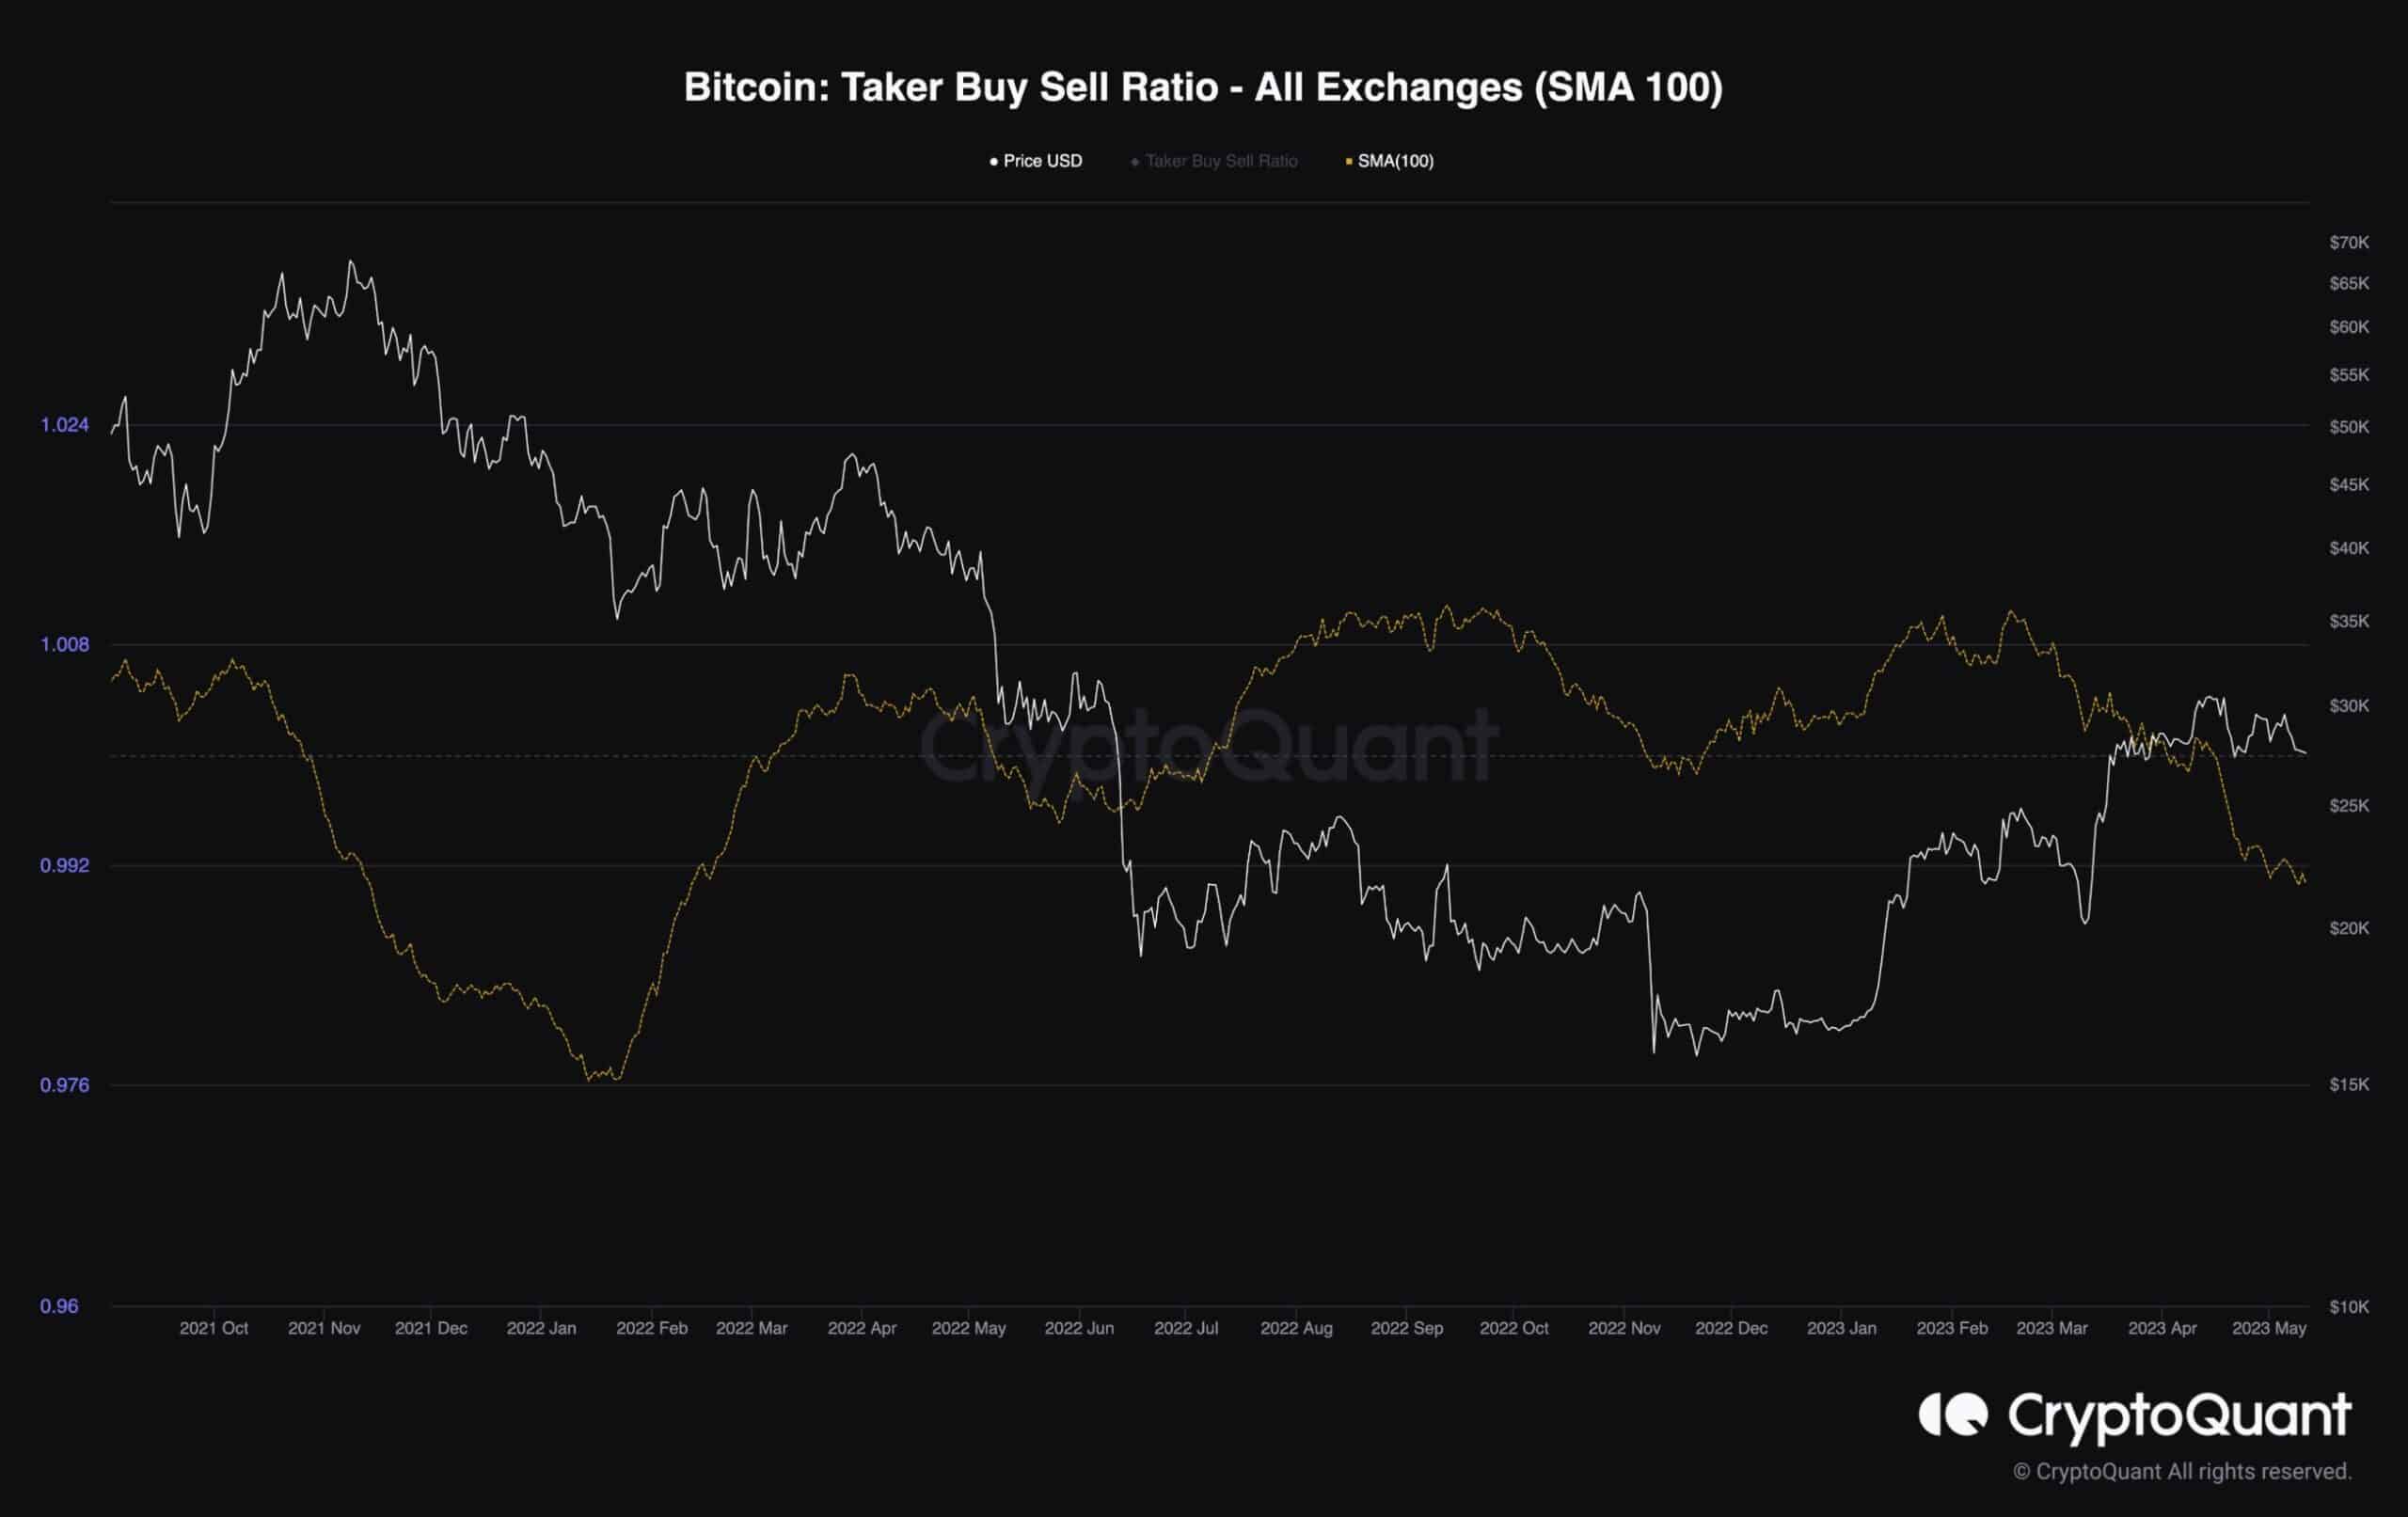
Bitcoin’s price has been consolidating below the key $30K resistance level, following a rally since the beginning of 2023. The recent indecisiveness shown by the price has led many investors to wonder whether the bear market is really over or whether the price will be able to make it past the $30K mark. Therefore, analyzing the futures market sentiment could provide helpful insights.
This chart demonstrates the Taker Buy Sell Ratio metric, which determines whether the bulls or the bears are dominant. Values above 1 indicate that long traders are executing more aggressively, and conversely, values below 1 point to the bear’s dominance.
Looking at the chart, it is clear that this metric has been trending below 1 over the last few months, and it could be one of the main reasons why BTC has failed to break above $30K. This aggressive selling pressure could reverse the trend and push the price lower if things remain the same.
So, while BTC has rebounded substantially since the beginning of the year, the bear market may still not be over.