XRP Analysis
2 months ago

Here’s How Low XRP Can Go if $0.6 Fails (Ripple Price Analysis)

CryptoVizArt Mar 18, 2024 14:09

Ripple’s price has been trending lower against both the USDT and BTC. Yet, market participants can still be optimistic as significant support levels are available.

Technical Analysis

By TradingRage

The USDT Paired Chart

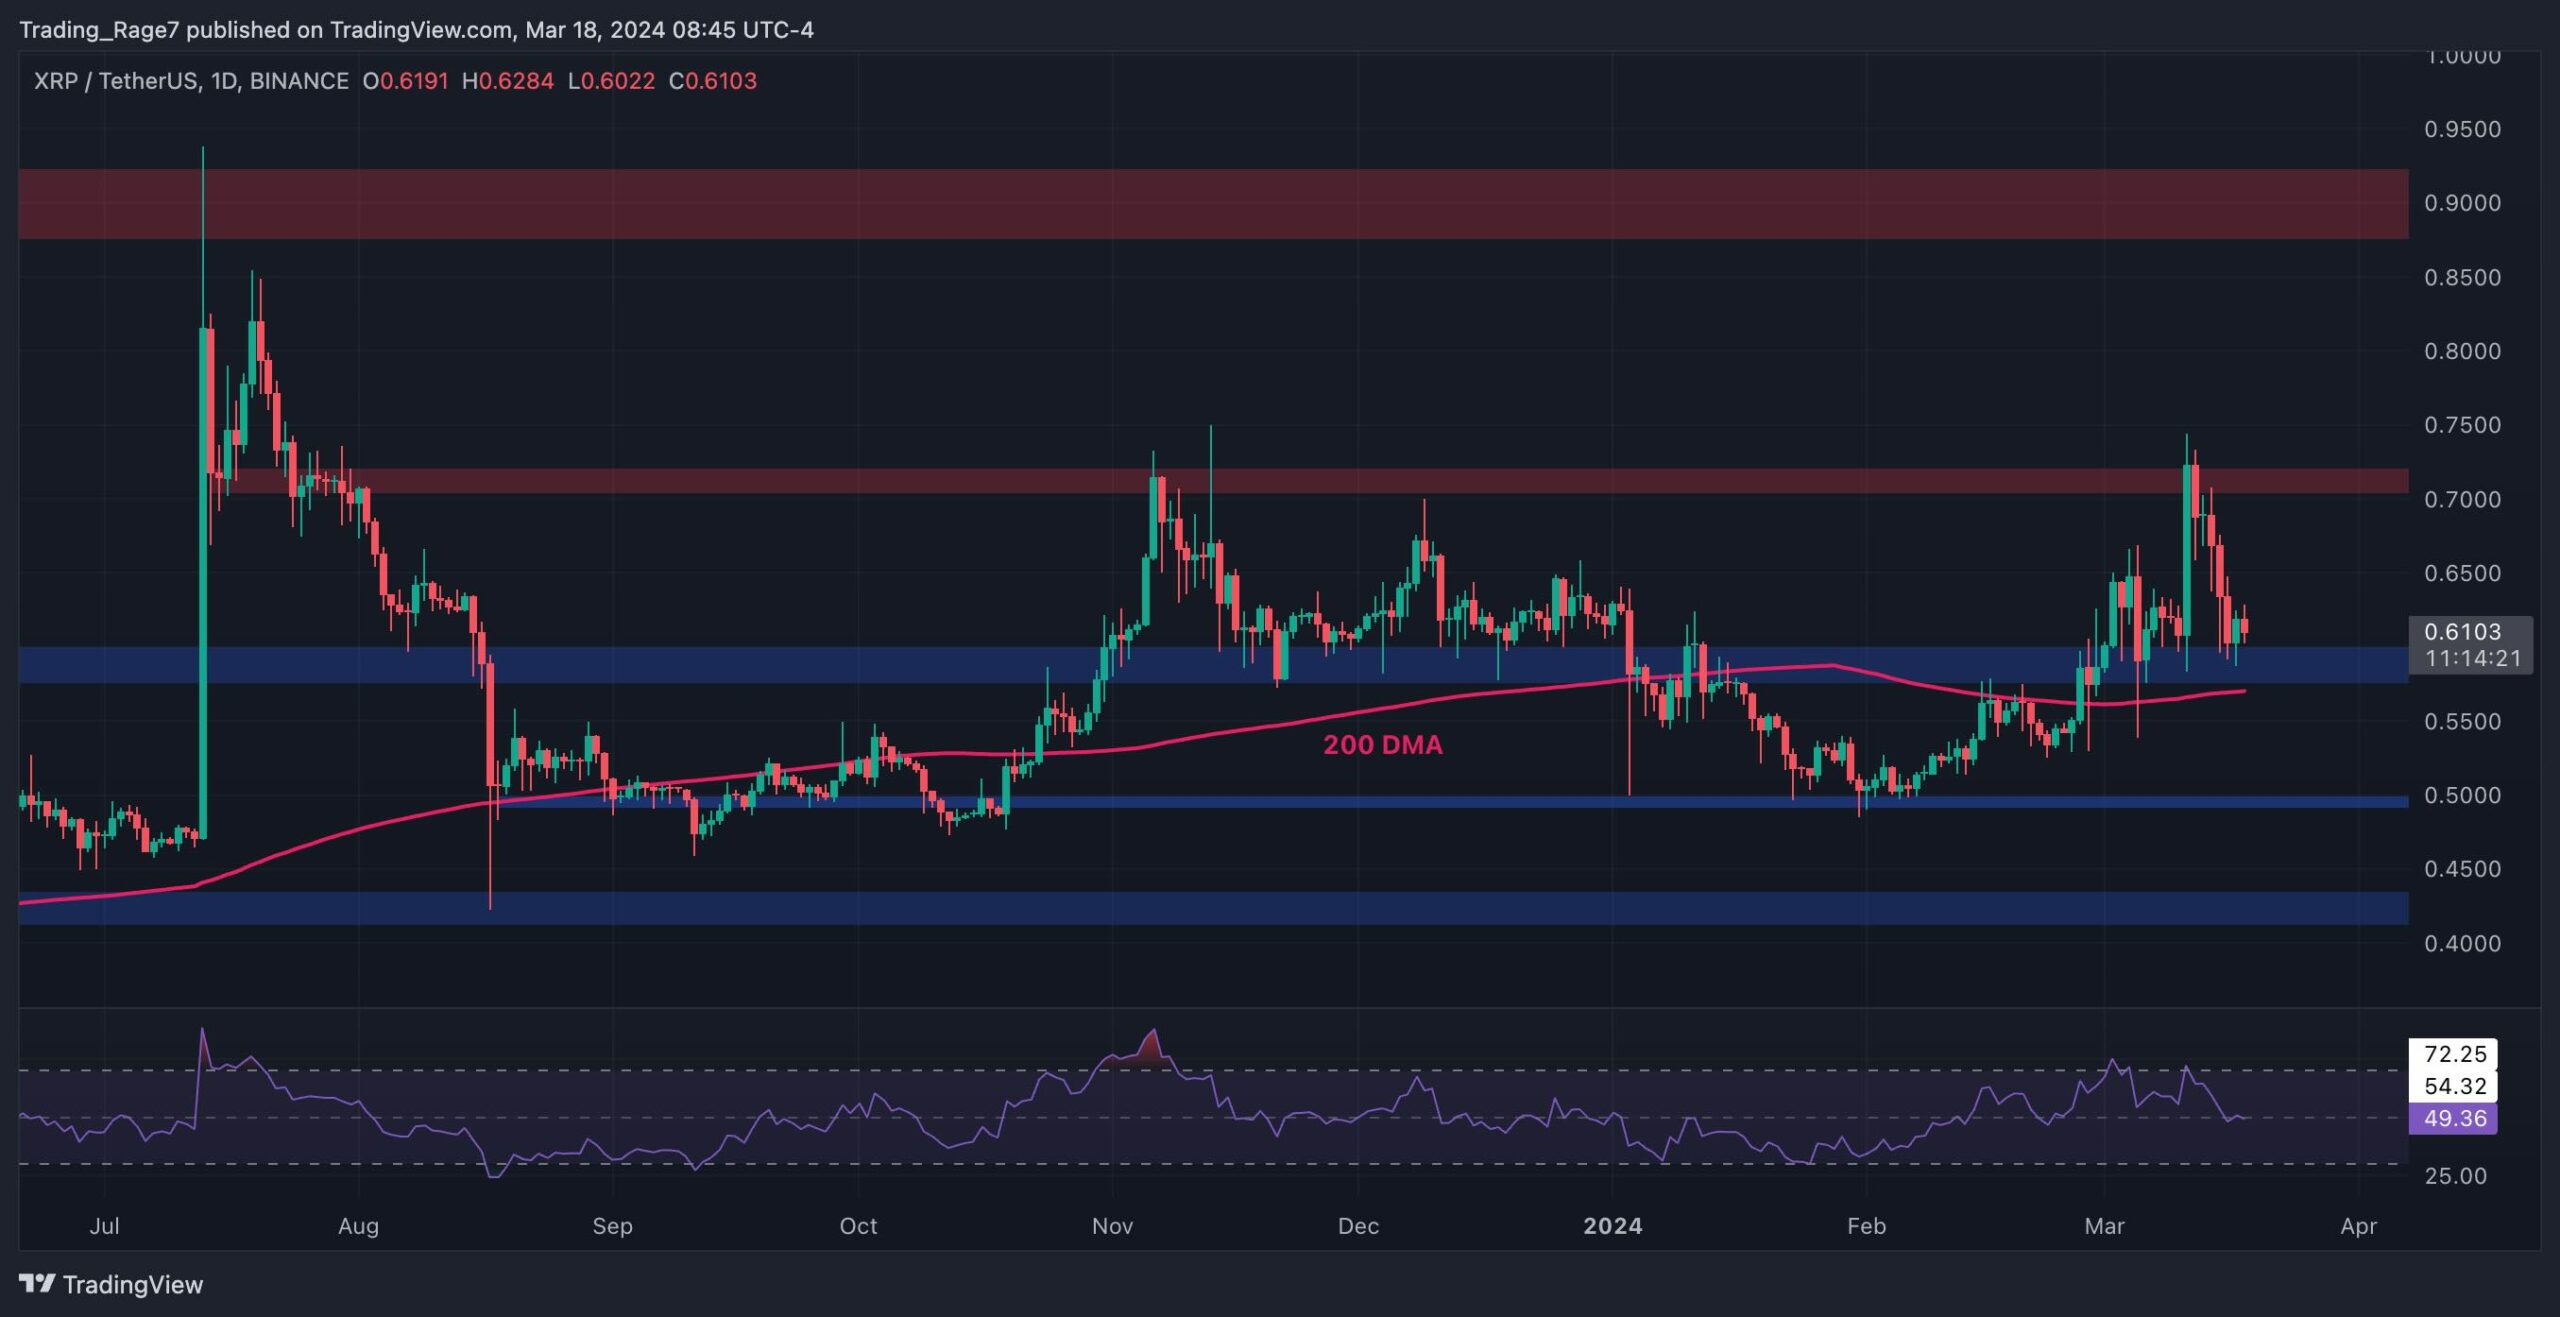
Against USDT, the price has been dropping consistently since its rejection from $0.7. Yet, the $0.6 support level is preventing a further decline.

Nevertheless, in case of a breakdown, the 200-day moving average located around the $0.57 mark can still act as a potential turning point for XRP.

Source: TradingView

The BTC Paired Chart

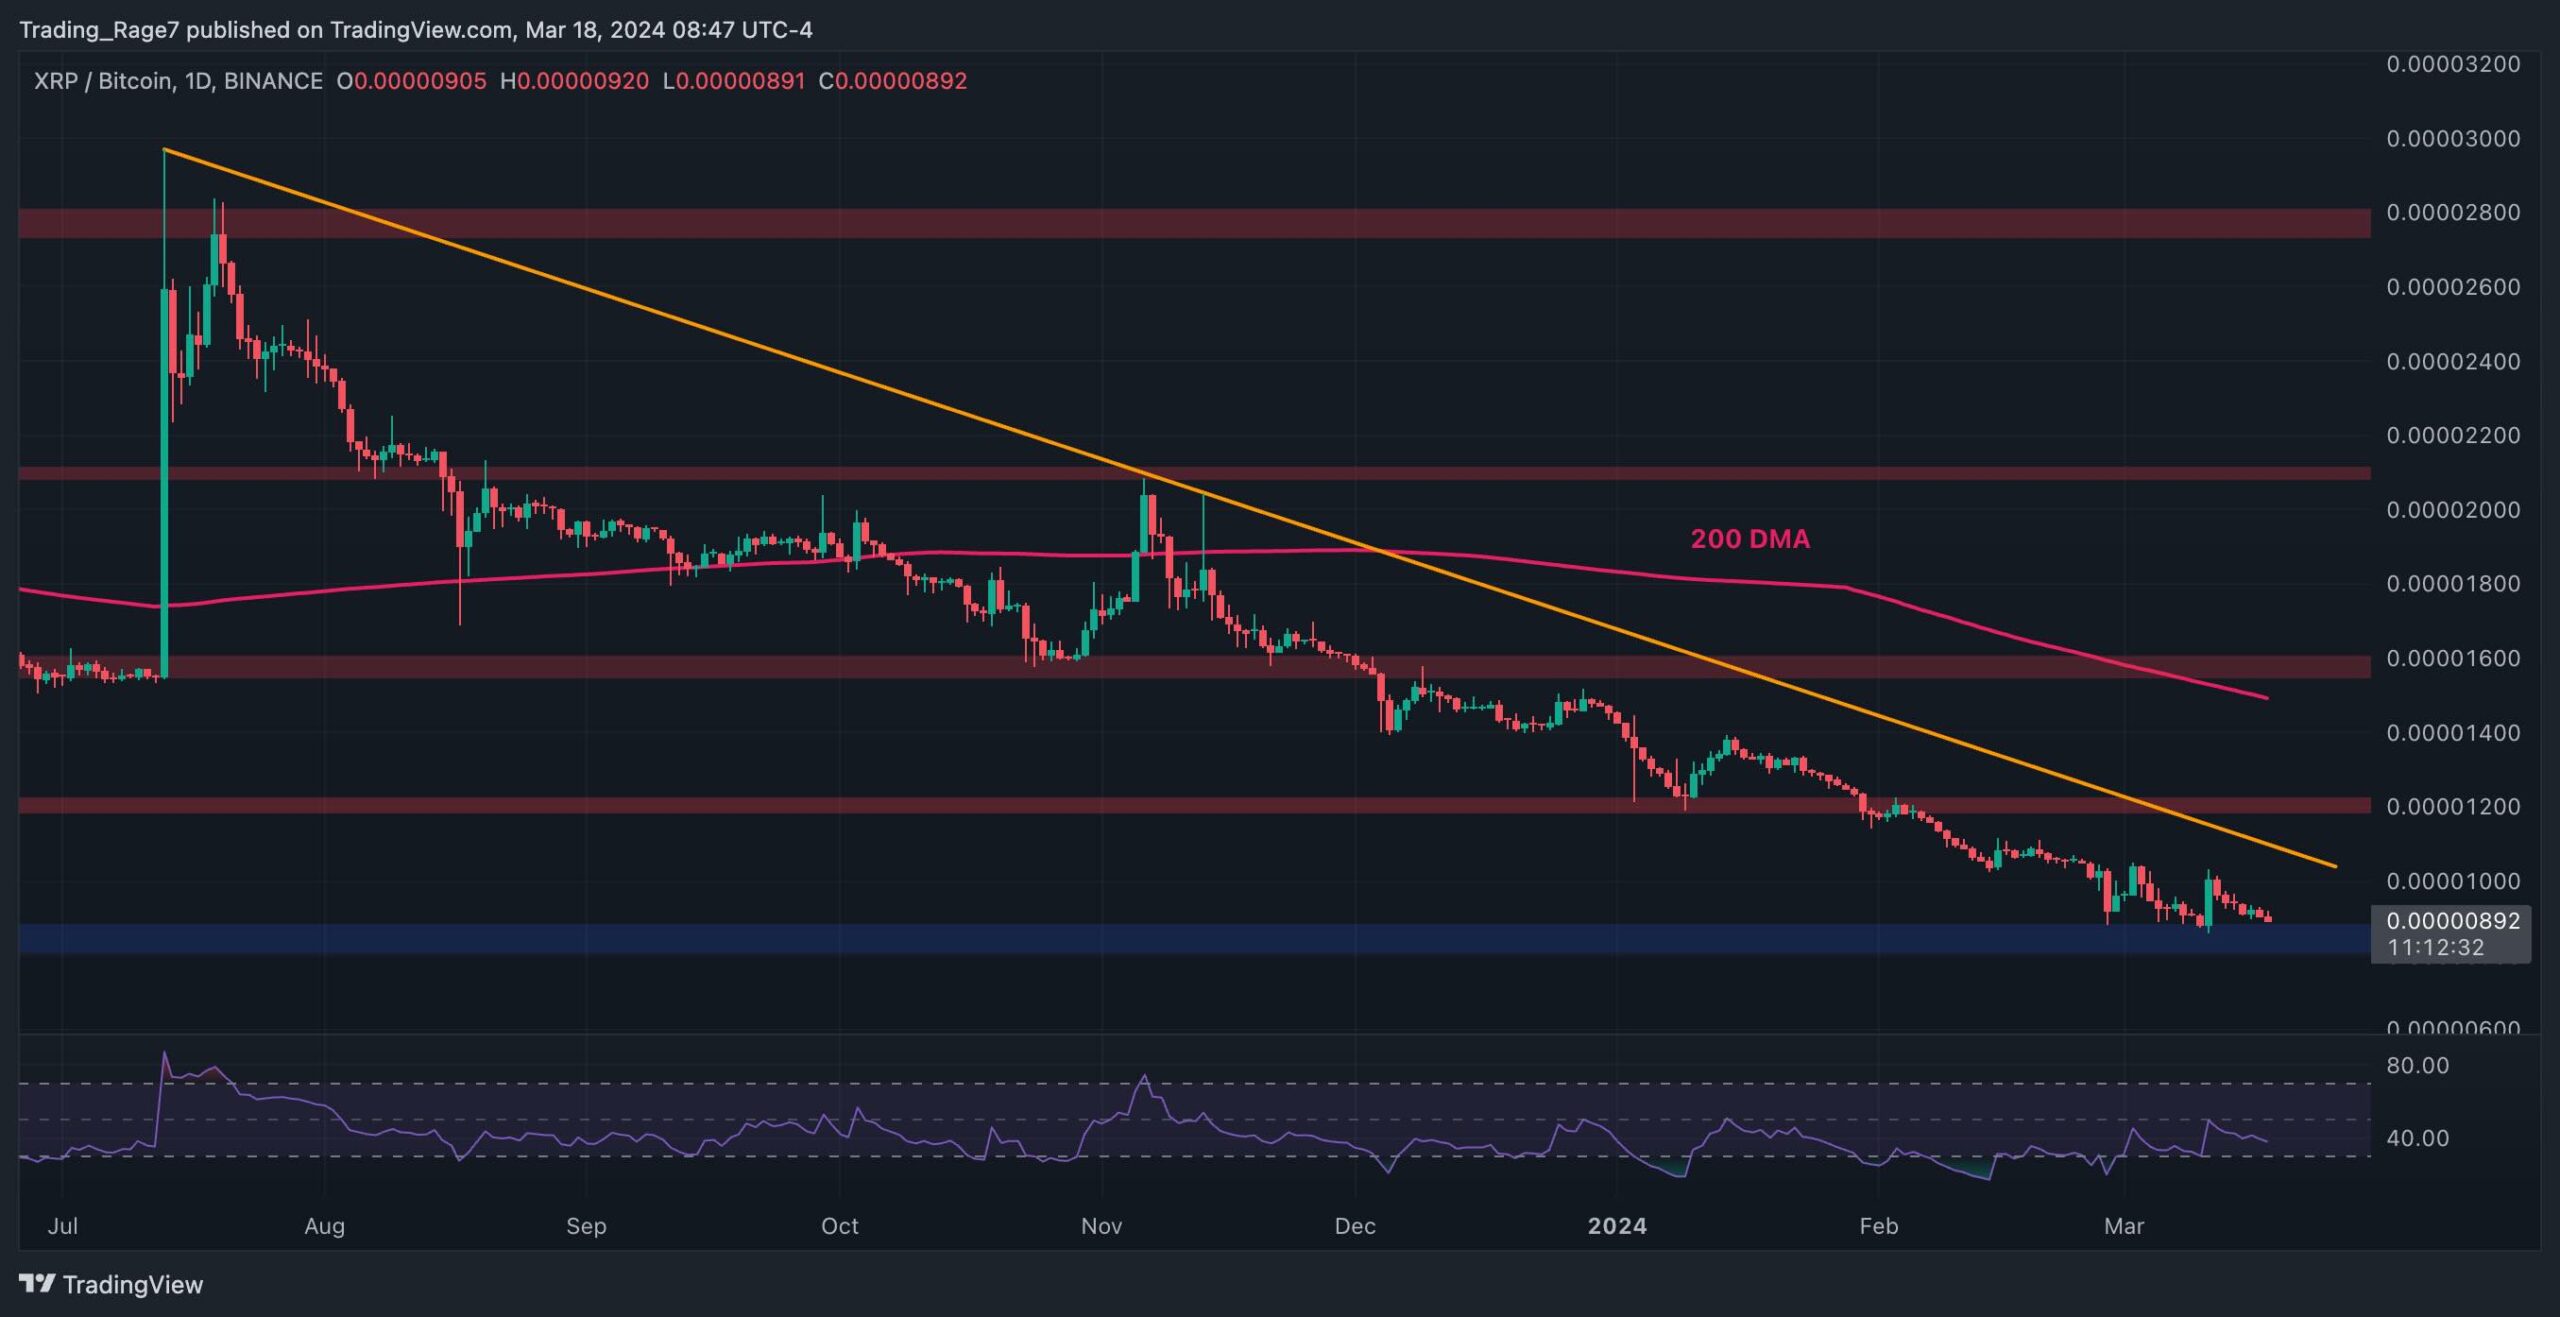
Looking at the chart against Bitcoin, the market has been trending lower for a long time. The XRP price is currently testing the 900 SAT support zone once again.

If XRP bounces off this level once again, it will likely attack the long-term bearish trendline. If the price breaks it to the upside, the 1200 SAT resistance level can be the next target. On the other hand, a break below the 900 SAT support zone can be disastrous, as it can lead to a significant crash.

Source: TradingView
SPECIAL OFFER (Sponsored)
Binance Free $600 (CryptoPotato Exclusive): Use this link to register new account and receive $600 exclusive welcome offer on Binance (full details).

LIMITED OFFER 2024 at BYDFi Exchange: Up to $2,888 welcome reward, use this link to register and open a 100 USDT-M position for free!


Disclaimer: Information found on CryptoPotato is those of writers quoted. It does not represent the opinions of CryptoPotato on whether to buy, sell, or hold any investments. You are advised to conduct your own research before making any investment decisions. Use provided information at your own risk. See Disclaimer for more information.

Cryptocurrency charts by TradingView.
Share This Article
CryptoVizArt

Full-time on-chain Data Analyst and Python Programmer. Passionate about Bitcoin and DataVisualization. Contact: Twitter