In the recent market developments, Ethereum showcased a remarkable upswing, surging to a yearly high of $2717.
However, this ascent was met with considerable selling pressure, prompting a slight retracement and setting the stage for a potential short-term consolidation correction.
By Shayan
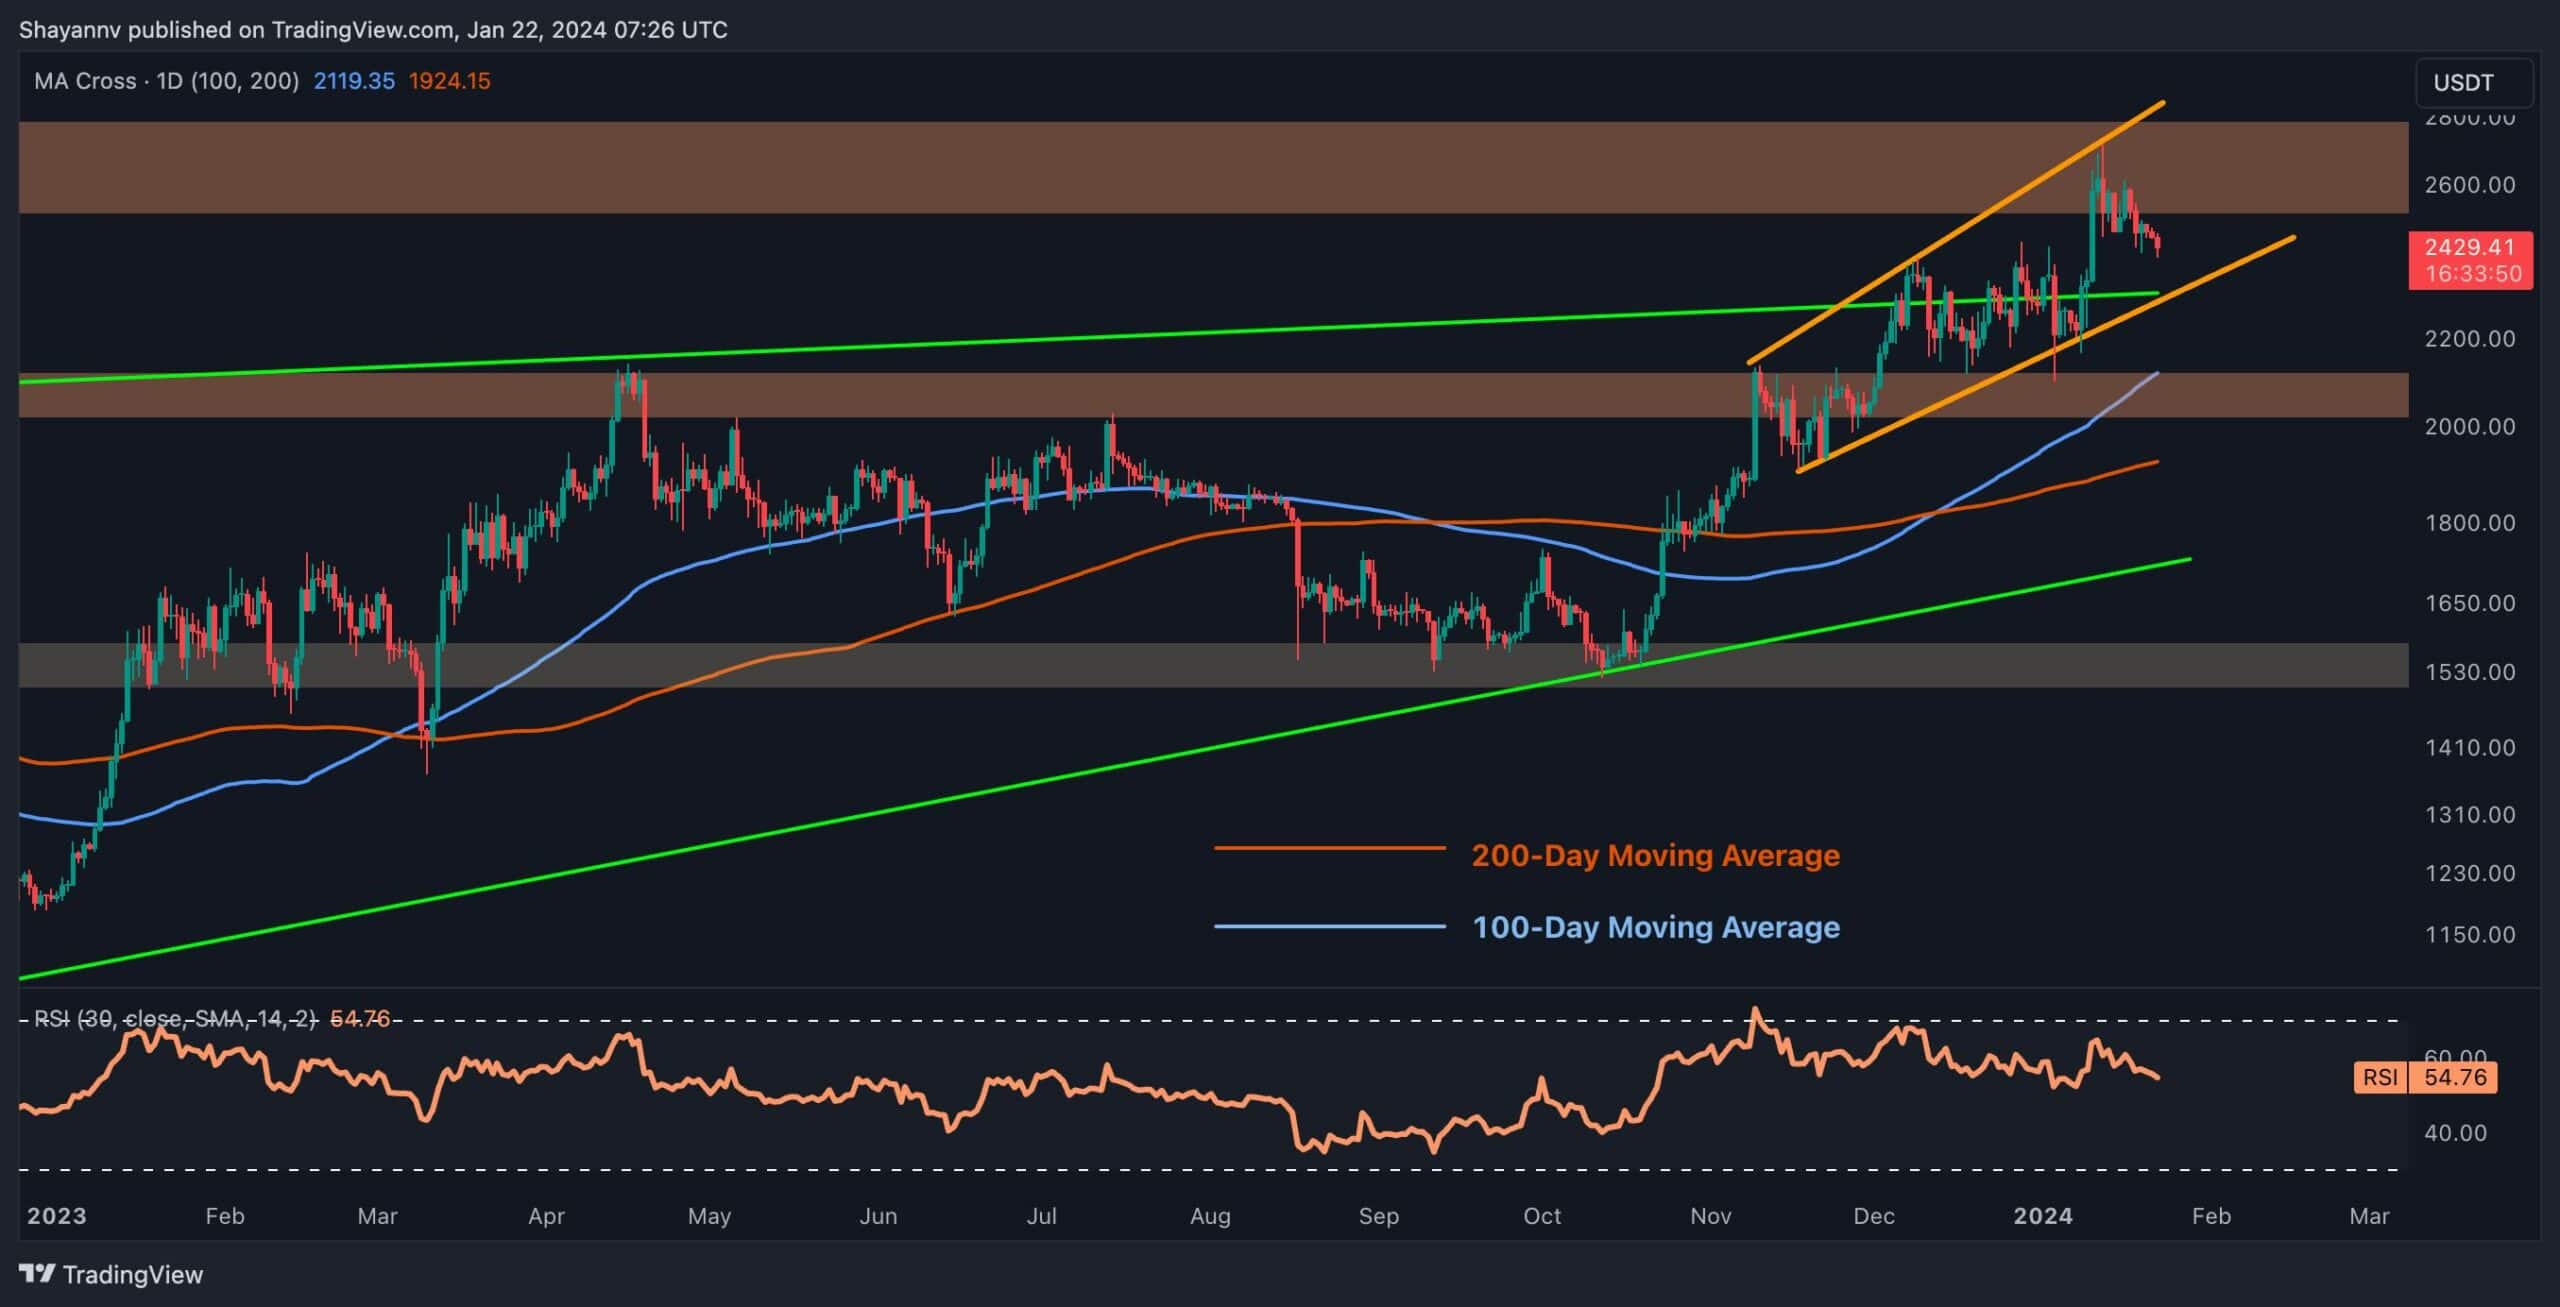
A thorough examination of Ethereum’s daily chart uncovers a significant recent surge, with the price reaching a yearly peak of $2.7K. Simultaneously, ETH has emerged within an ascending expanding wedge pattern, identifiable by the orange lines. This pattern holds the potential for a bearish reversal, contingent upon the price breaking below the lower boundary.
Despite this, after Ethereum’s notable upward movement, the price encountered a pivotal resistance zone, notably – the static $2.7K level aligning with the upper boundary of the ascending wedge pattern.
This led to a slight retracement. Considering recent market sentiment and price action, there is an anticipation of a continuation in the correction leg, possibly resulting in a pullback to the multi-month ascending wedge pattern (green lines), coinciding with the lower boundary of the recent short-term expanding wedge.
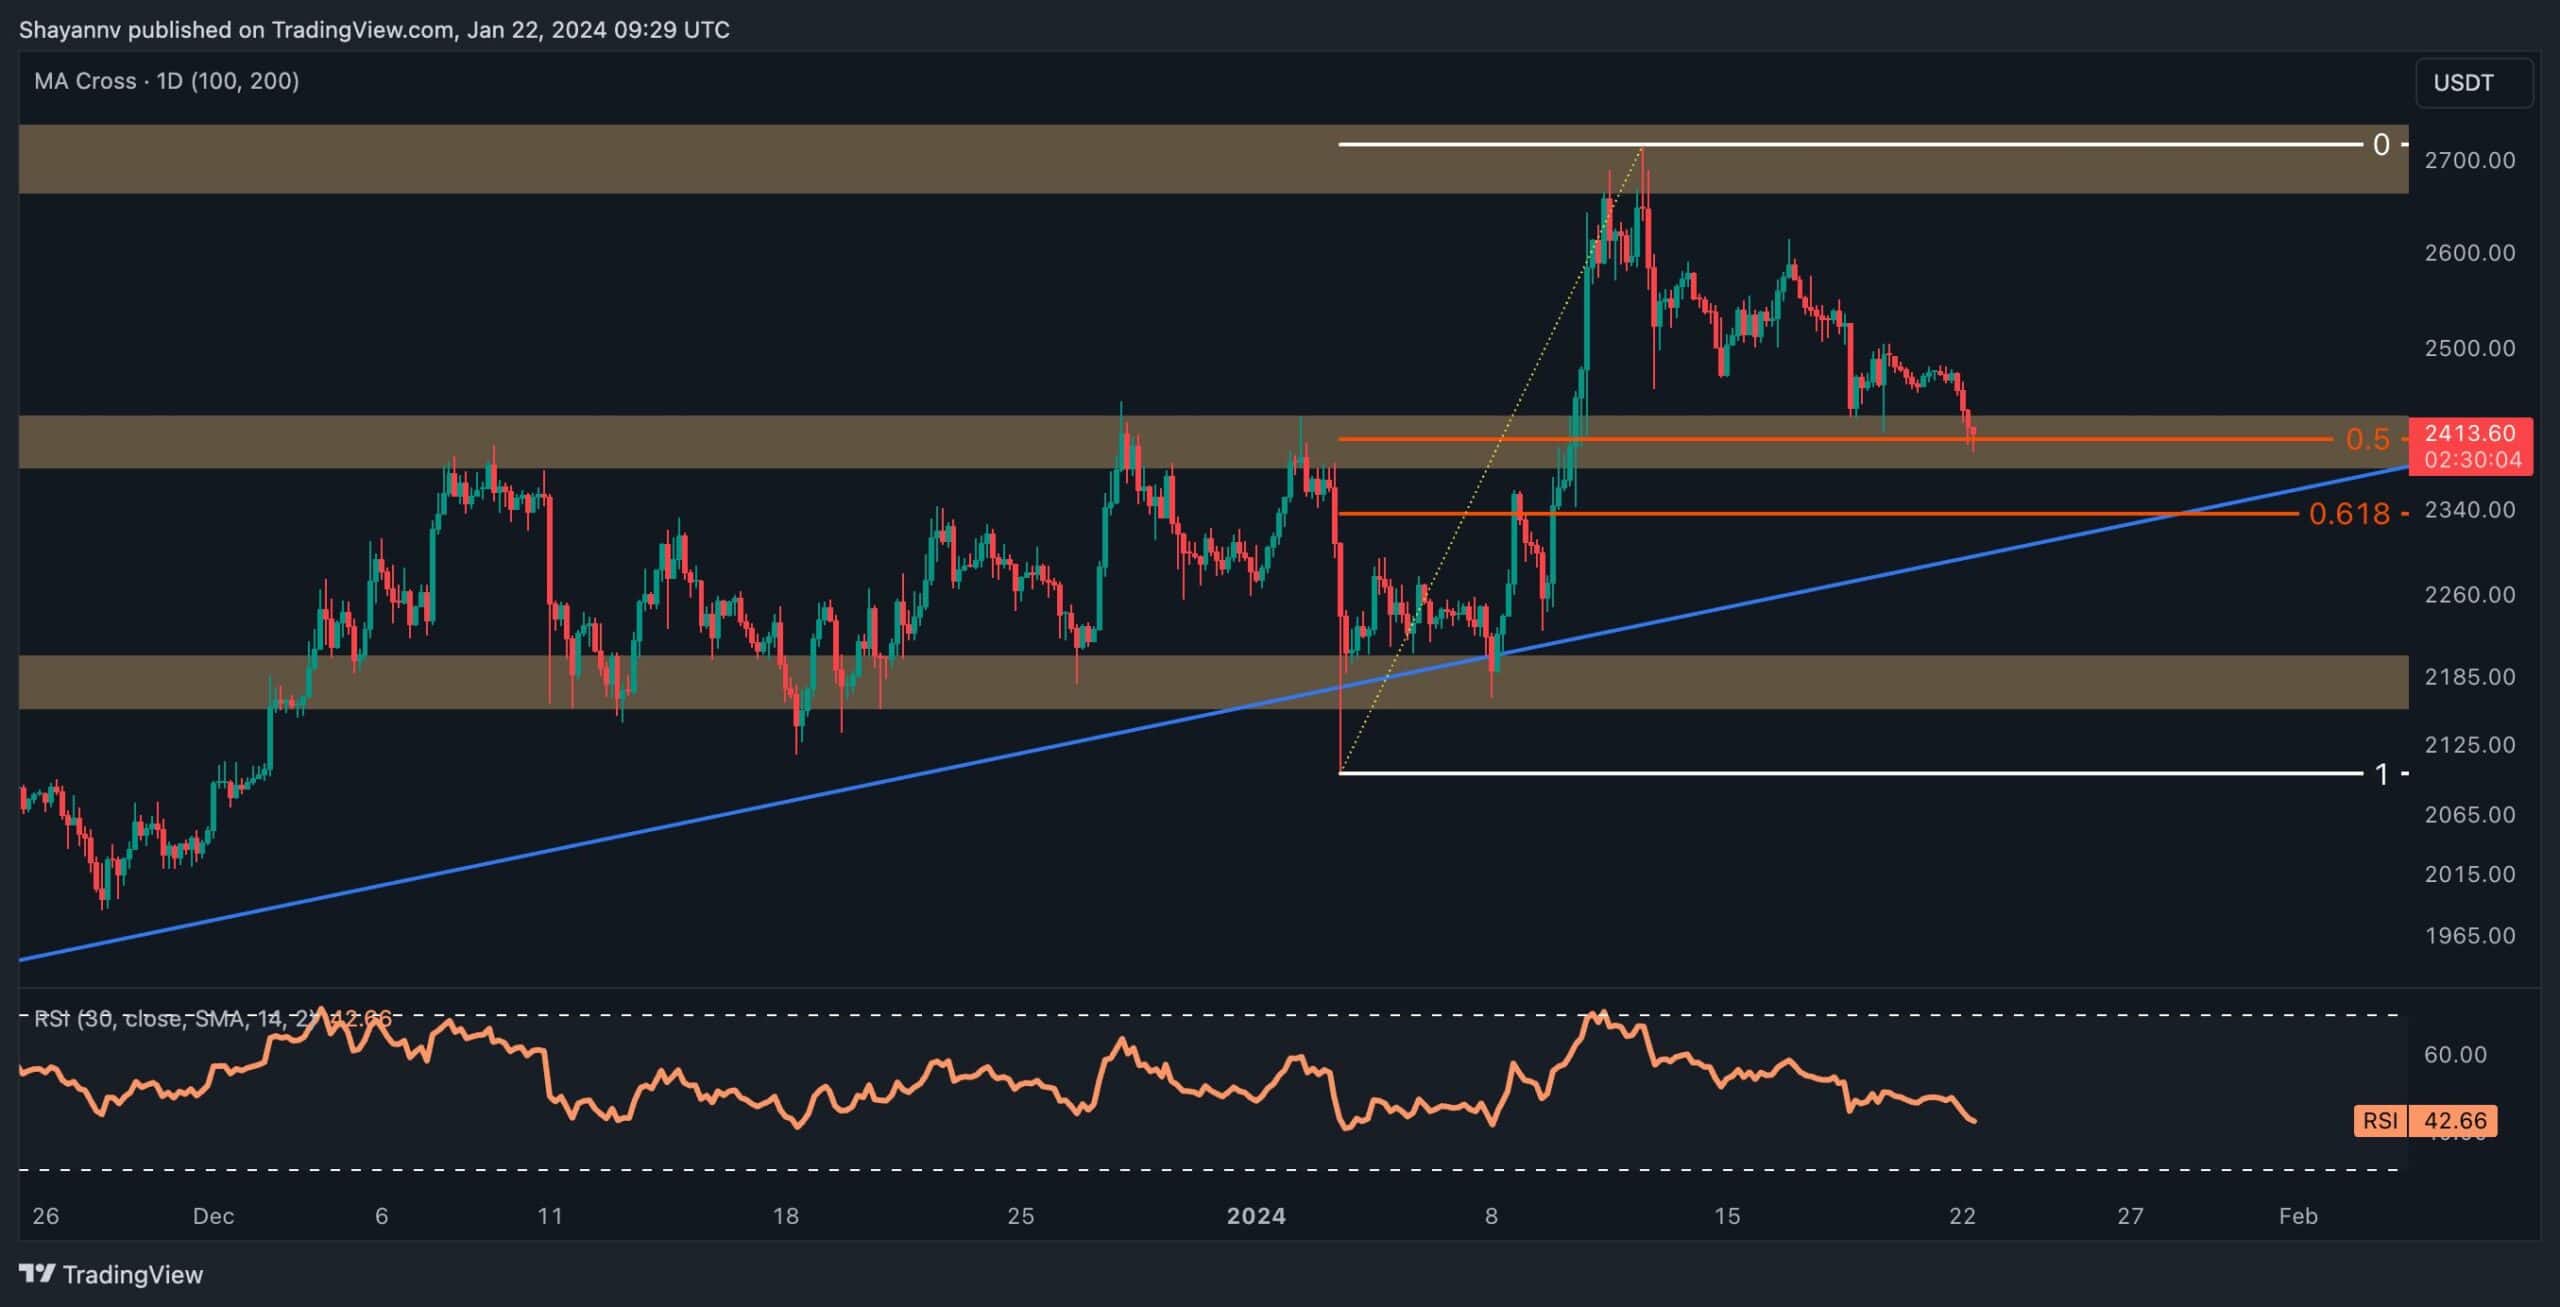
Analyzing the 4-hour chart, the price faced considerable selling pressure following the impulsive surge, initiating a correction phase. Accordingly, Ethereum seems confined within a crucial range, bounded by substantial support at $2.4K and notable resistance at $2.7K, resulting in a mild downward consolidation.
Currently, the price has approached the lower boundary of this significant range. Notably, the lower boundary aligns with a significant support region, defined by the price range between the 0.5 ($2408) and the 0.618 ($2335) levels of the Fibonacci retracement. Hence, this offers robust support to the price.
Given the potential presence of buyers within this critical support zone, an expected scenario is for the price to find support, facilitating a renewed upward movement. However, in the event of a bearish breakout, sellers may target the multi-week ascending trendline as their next objective.
By Shayan
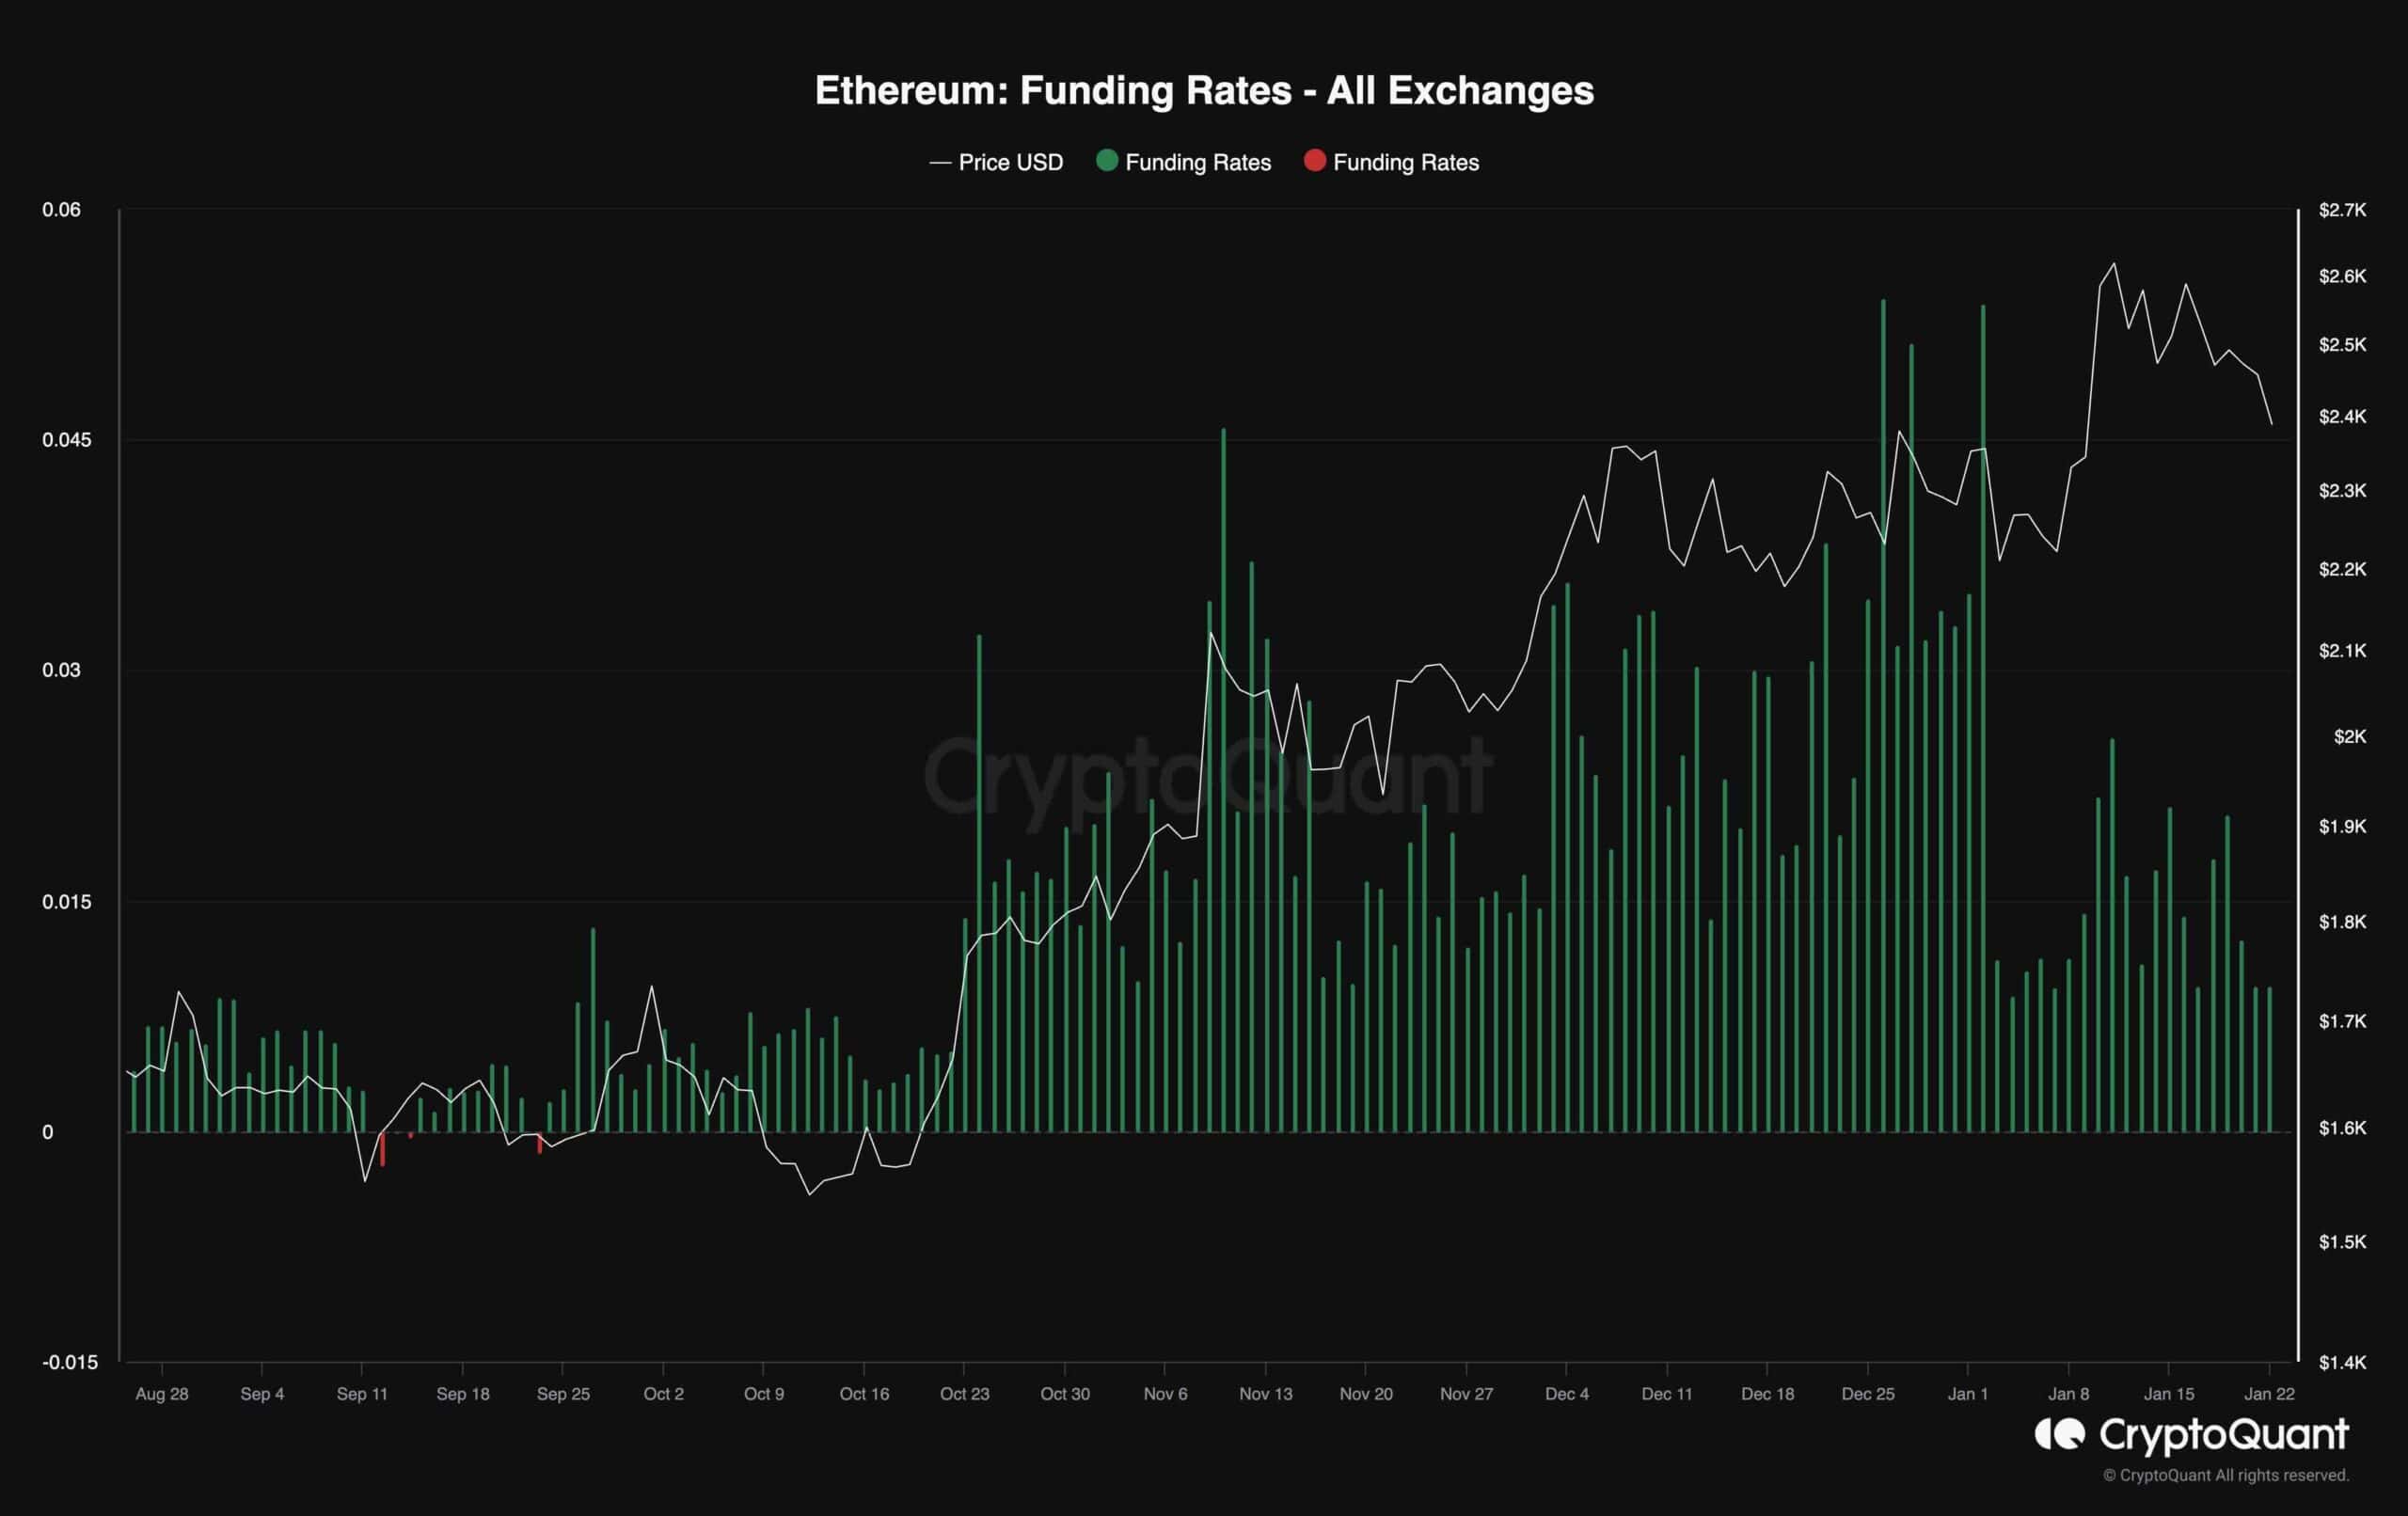
The funding rates are critical in the analysis of Ethereum’s futures market sentiment, as illustrated in the accompanying chart. This metric serves as a pivotal gauge to discern whether buyers or sellers are executing their orders with heightened aggression.
The chart prominently reveals an upward trajectory in the funding rates metric, mirroring the robust surge in price. This alignment signals a pronounced bullish sentiment prevailing in the market. However, it’s crucial to note that elevated values in funding rates raise concerns about a potential overheated state in the perpetual markets, signaling the possibility of an impending long-squeeze event.
In the wake of a recent short-term correction, a noteworthy development is the substantial decline in funding rates. This decline signifies that the overall sentiment remains bullish, concurrently indicating a cooling-off in the perpetual markets from their previously overheated state. Consequently, there exists the potential for the price to resume its upward trajectory following the completion of the ongoing correction stage.