Bitcoin price continues to remain inside the bullish ascending triangle, despite several attempts from bearish traders in the last three days to break through the pattern’s vital up-trending support.
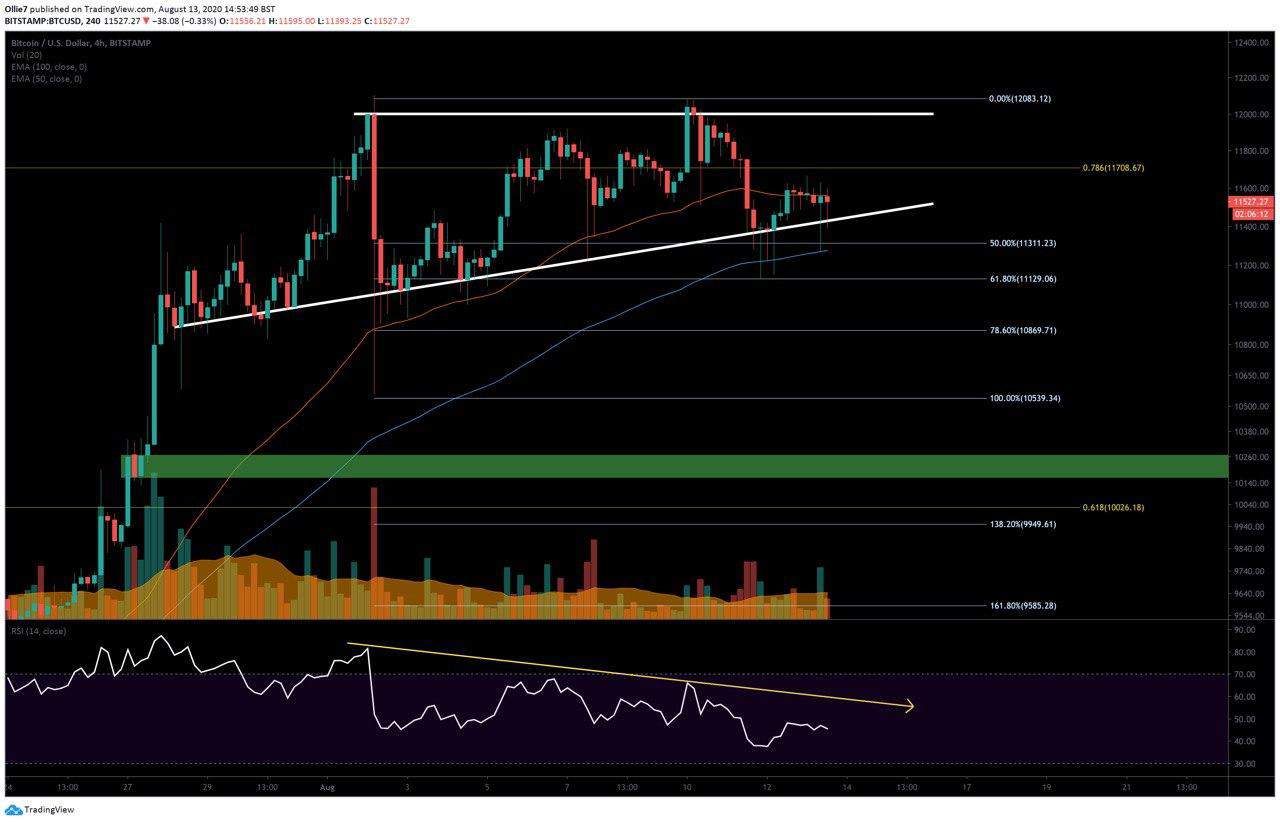
On the 4-Hour BTC/USD chart, we can see that bulls have successfully eaten up all 6 of the candles that wicked down beneath the support, but have so far been unable to break back above $11,600.
Now, the price action appears to be pushing sideways while both bulls and bears recover.
Looking across to other markets, we can see that Gold (XAU) and Silver (XAG) are now rebounding from the sharp sell-offs that took place on Tuesday. Silver, in particular, is almost up 5% today and looks promising to recuperate its losses soon from earlier in the week.
Bitcoin prices have been closely correlated with the two precious metals over the last several days. When Gold and Silver took a dive, Bitcoin prices quickly followed and unraveled by more than $800.
With Silver now showing strong signs of recovering, this could mean that we might see BTC prices follow similarly before the weekend.
On the 4-hour chart, we can see that the current price action is sandwiched between the 50 and 100 EMA lines (red and blue, respectively). The 50 EMA is now acting as a strong resistance and has been holding down prices for the past three candles.
A break above this could be an early signal that bulls are staging a rebound similar to what’s happened on the XAG/USD chart today. If we do see a breakout over the $11,600, then the $11,750 will be the next short-term target for bulls to reach. From there, the all-important $12,000 will be next. Should BTC prices close above this psychological level, it could spark a rally reaching as high as the 1.618 Fibonacci extension level at $13,578.
Looking at the 100 EMA, this level has provided a foothold for bullish traders to push back from on two separate occasions in the last 48 hours. This will continue to be the first primary support for Bitcoin if bears attempt to challenge the critical ascending triangle support again.
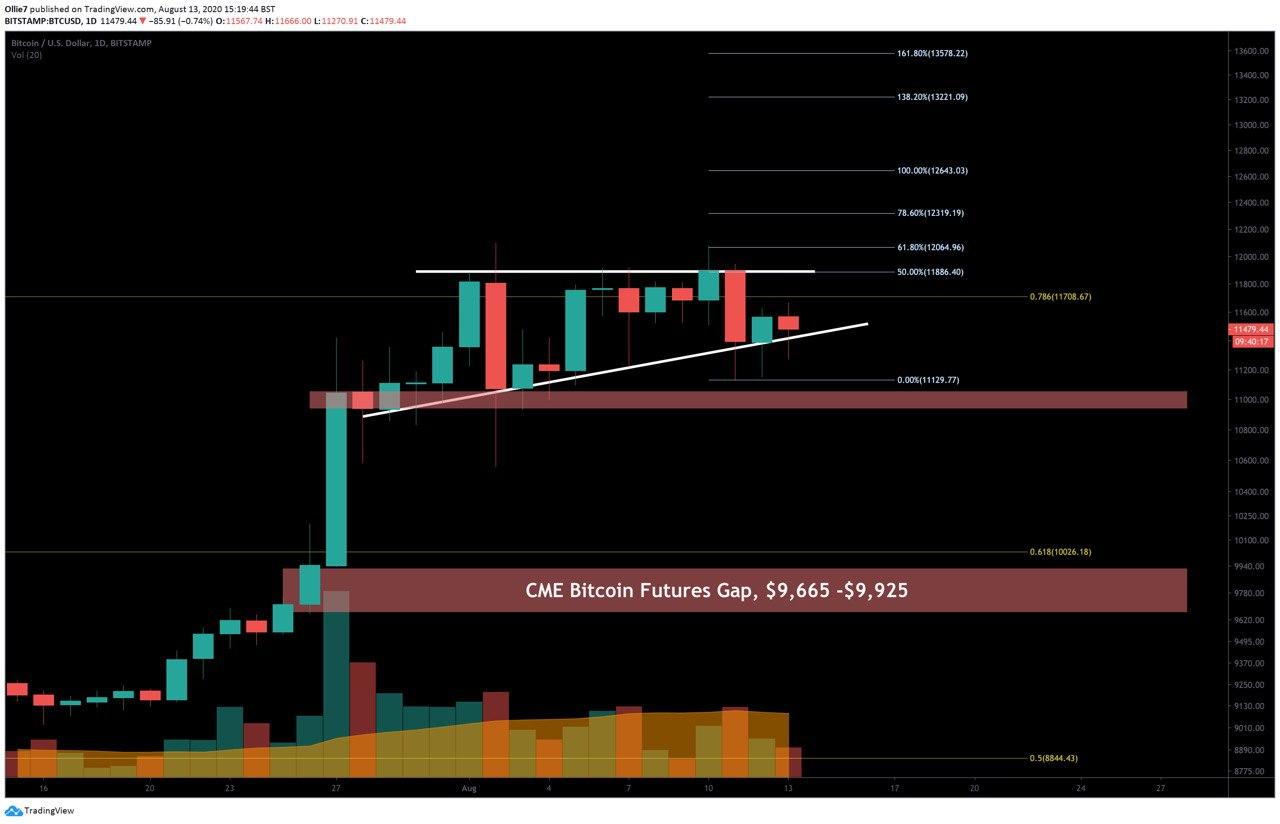
On the daily BTC/USD chart, there is another strong support area at the order block (green shaded area), between $11,050 and $10,940. Order blocks are typically areas where ‘smart’ money has entered the market, and are usually well-defended if prices slump.
The CME gap way down between the $9,665 and $9,925 levels is still looming. CME gaps are almost always filled and tend to act like magnets on Bitcoin’s price. If prices take a dive, we could see bears aim to close this gap.
Total Market Capital: $362 billion
Bitcoin Market Capital: $211 billion
Bitcoin Market Dominance: 58.4%