Binance Coin has plummeted this week, decreasing by 4.37% to reach the current price at $20.55. This also caused BNB to drop beneath the lower range support at the $20.71 level, which could cause BNB to head toward $18. Binance Coin has been suffering over the past 30 days, dropping by a precipitous 29% and marking a decrease of 36% in the past 3 months.
Today’s decline comes as Binance restricted US-based citizens to trade on their made platform starting today, September 12th. While users from the US will still be able to access their accounts and withdraw funds, they won’t be able to deposit and to trade. Even though Binance deployed Binance US as an alternative, it seems that the news has impacted the price of BNB rather negatively.
Binance Coin remains the eighth-largest cryptocurrency with a market cap of $3.21 billion.
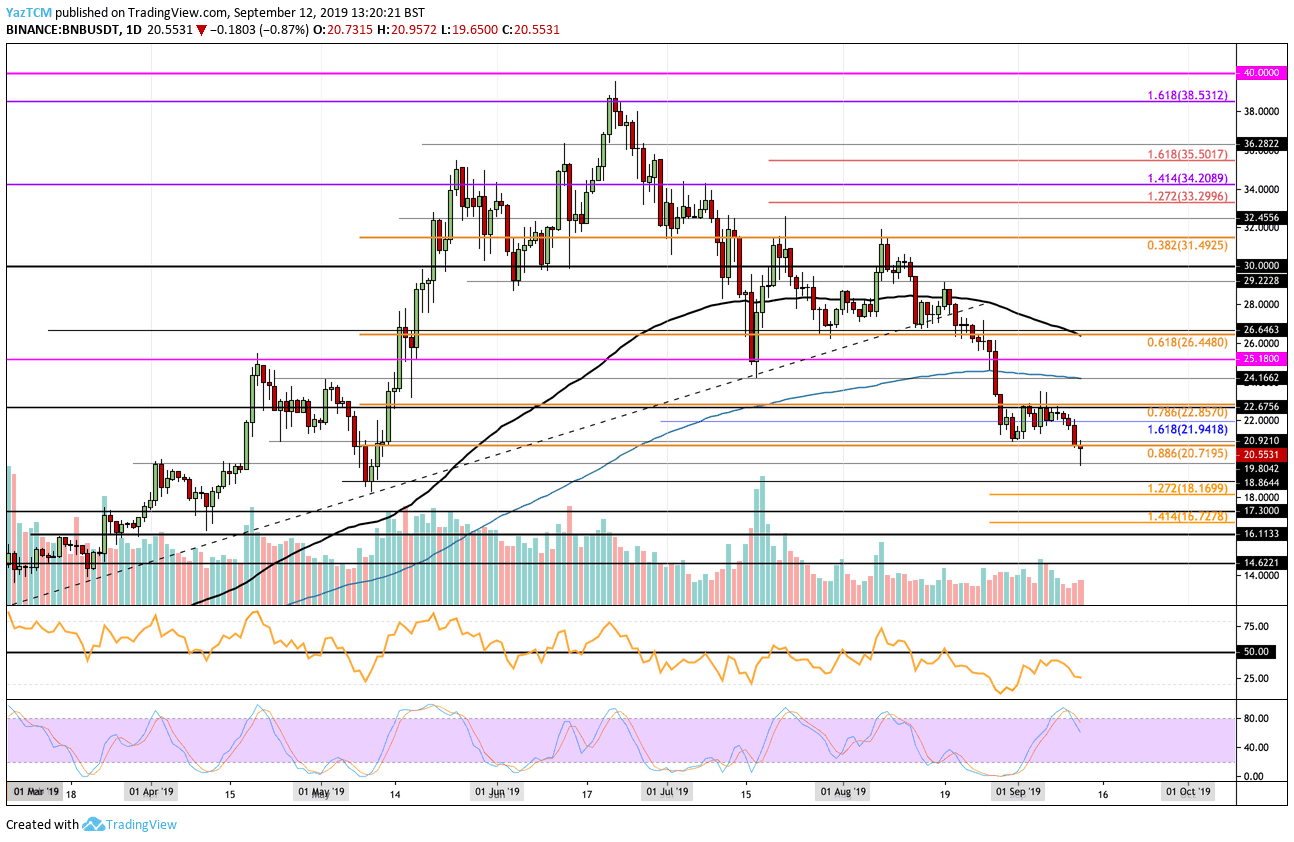
Looking at the BNB/USD 1-Day Chart:
- Since our previous BNB analysis, the cryptocurrency continued to trade sideways within the range between $22.85 and $20.71. The latest decrease caused BNB to drop beneath this range as it continued to go lower, bumping into support at $19.80.
- From above: The nearest level of resistance lies at $20.71. Above this, resistance lies at $21.94, $22.85, $23, $24, and $24.16. The resistance at $24.16 is strengthened by the 200-days EMA. Above $25.18, resistance lies at $26.44 (100-days EMA), $28, $29.22, and $30.
- From below: The nearest level of support lies at $20. Beneath $20, support can be found at $19.80 where the most recent rebound has been seen. Underneath $19.80, support is expected at $19, $18.86, $18.16, $18.00, $17.30, and $16.72.
- The trading volume remains at an average level.
- The RSI is beneath the 50 level which shows that the sellers are in complete control over the market momentum. Furthermore, the Stochastic RSI has recently produced a bearish crossover signal in overbought territory which should result in a strong move lower.
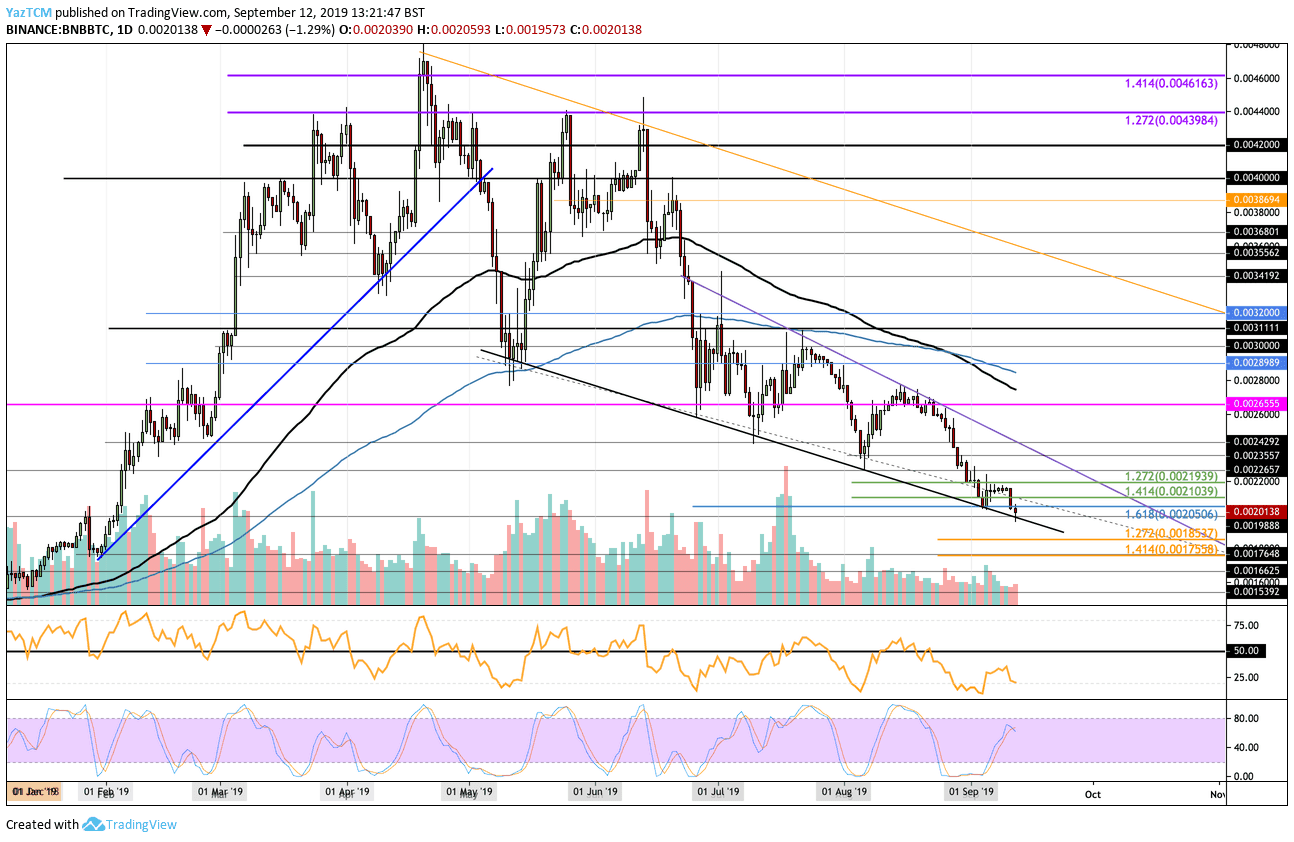
Looking at the BNB/BTC 1-Day Chart:
- Against Bitcoin, BNB has battled to remain above the lower boundary of the descending wedge. It created a fresh 7-month low today after dipping beneath 0.002 BTC. BNB is back above the level but is likely to continue lower if the bulls do not regroup.
- From above: The nearest level of resistance lies at 0.00205 BTC. Above this, resistance is found at 0.0021 BTC, 0.002193 BTC, 0.002265 BTC, and 0.002492 BTC. If the bulls can continue above 0.0025 BTC, resistance is expected at 0.002655 BTC, 0.0027 BTC (100-days EMA), and 0.00285 BTC (200-days EMA).
- From below: The nearest level of support lies at 0.002 BTC. Beneath this, support is located at 0.001988 BTC and 0.00195 BTC. If the sellers continue beneath 0.0019 BTC, support is at 0.00185 BTC, 0.0018 BTC, and 0.001755 BTC.
- The trading volume remains low at the recent average.
- The RSI is well within the bearish territory. For the initial sign of a rebound, we will look for the RSI to start to rise toward the 50 level.
SPECIAL OFFER (Sponsored)
LIMITED OFFER 2024 for CryptoPotato readers at Bybit: Use this link to register and open a $500 BTC-USDT position on Bybit Exchange for free!
Disclaimer: Information found on CryptoPotato is those of writers quoted. It does not represent the opinions of CryptoPotato on whether to buy, sell, or hold any investments. You are advised to conduct your own research before making any investment decisions. Use provided information at your own risk. See Disclaimer for more information.
Cryptocurrency charts by TradingView.