Over the past days, we see a positive correlation between Wall Street and Bitcoin. Just a few hours after Wall Street closed its trading day in decent 3-4% gains across all major indexes, the primary cryptocurrency had gone through the same increase.
As of writing these lines, Bitcoin price had reached a daily high of nearly $9,000 ($8960 on Bitstamp). This level is also the weekly high from Monday.
As of now, Bitcoin is trading slightly below the benchmark level, but safely above the crucial 200-days moving average line (currently around $8700).
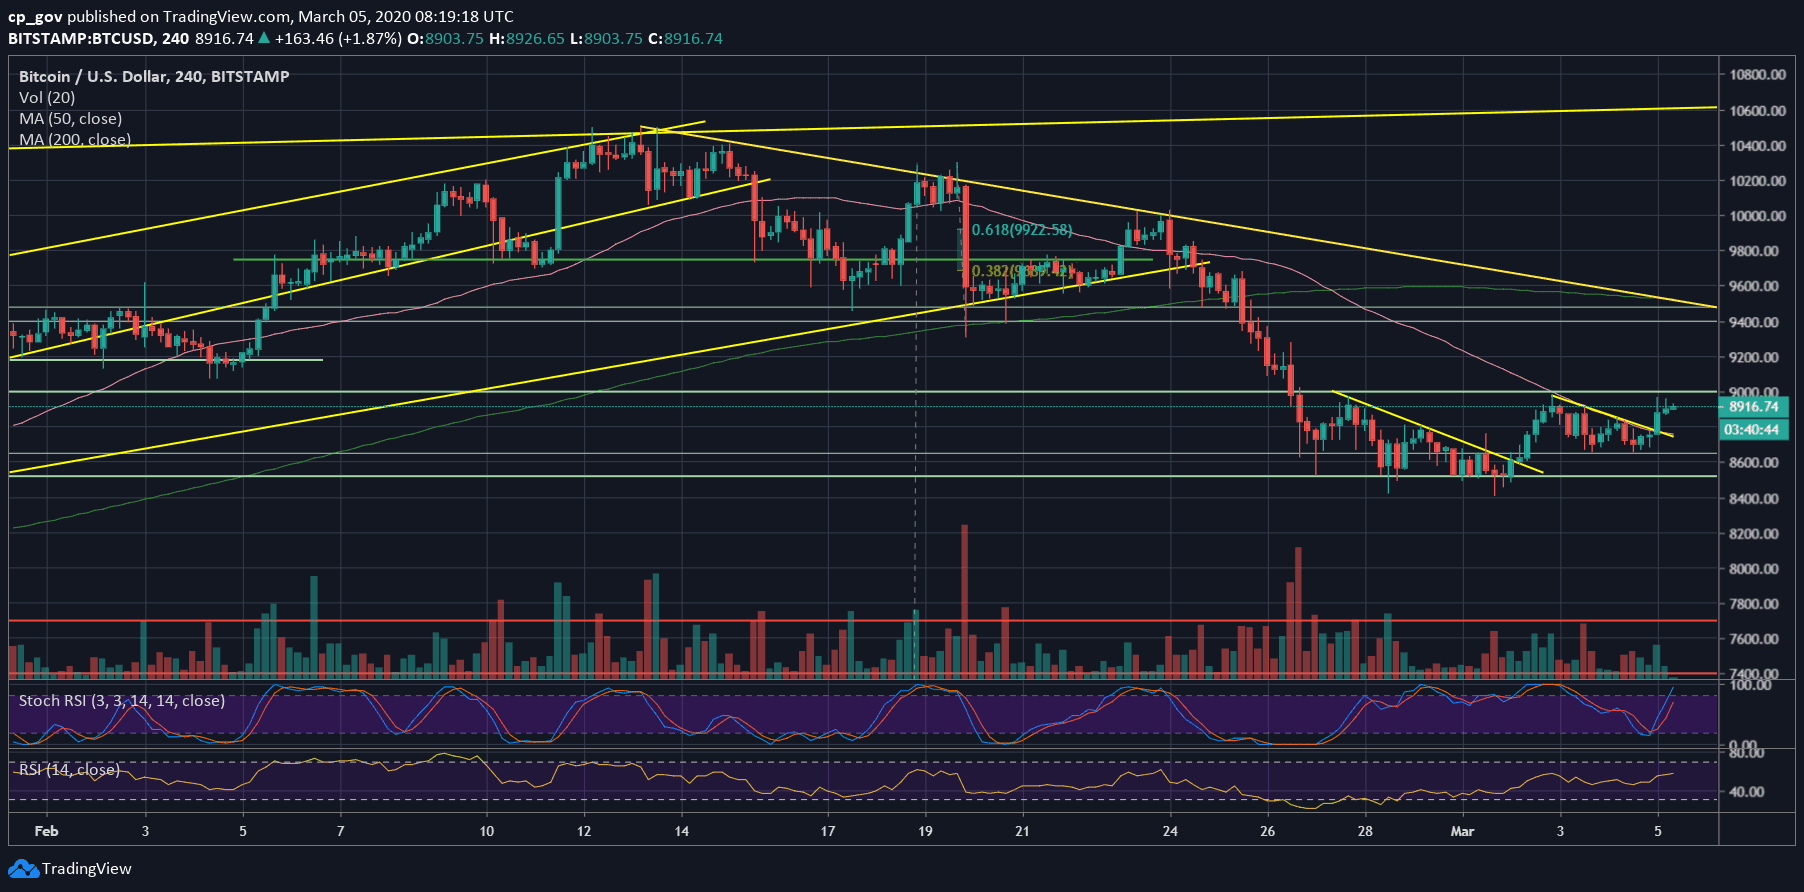
On the lower timeframe, the following 4-hour chart, we can see the same triangle pattern repeating itself for the second time during the past week (marked on the chart). This time the baseline was at $8650 (the first time it was at $8500), and the breakout is clearly seen at $8750.
Looking at the RSI indicator, we can see that for the first time over the past month that the descending channel has been broken above. However, the critical 50 RSI level is the next resistance.
As we mentioned two days ago, the Stochastic RSI had made a bullish crossover in the oversold territory. This might give the Bulls some fuel for the next short term, possibly to breaking up $9K.
Total Market Cap: $255.4 billion
Bitcoin Market Cap: $162.5 billion
BTC Dominance Index: 63.6%
*Data by CoinGecko
– Support/Resistance levels: As mentioned above, Bitcoin is now facing the next resistance at $9000, which is also the weekly high.
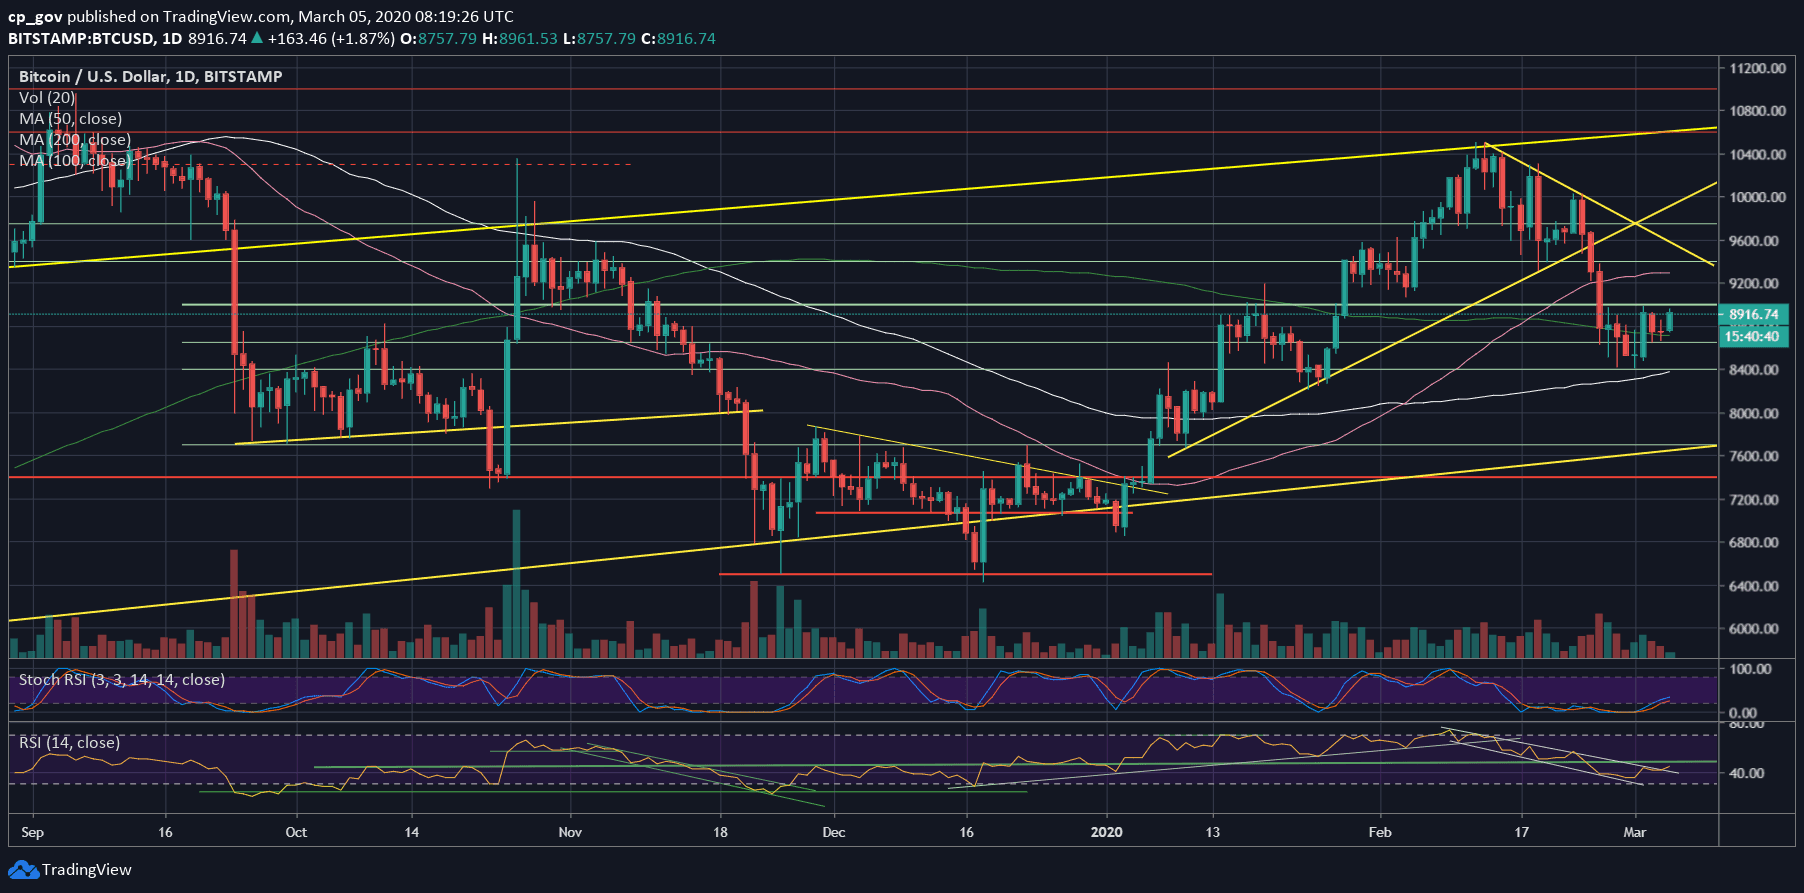
Further above lies $9300, which is also the 50-days moving average line (marked pink, ~$9280) and the short-term descending trend-line marked on the following daily chart. In case the last two are broken up, then the next resistance is $9400 and $9600.
From below, the first level of support is the 200-days moving average line, around $8700 – $8750. Further below is the recent triangle’s ‘baseline’ at $8650, before the $8500 support level.
– The RSI Indicator: discussed above.
– Trading volume: This is from our recent price analysis: “We can identify an increasing amount of volume over the past days, which can turn to bullish signs.”
Despite the bullish momentum, the high volume levels are not here yet.