The global crypto market continues to slide today as another $11 billion pours out.
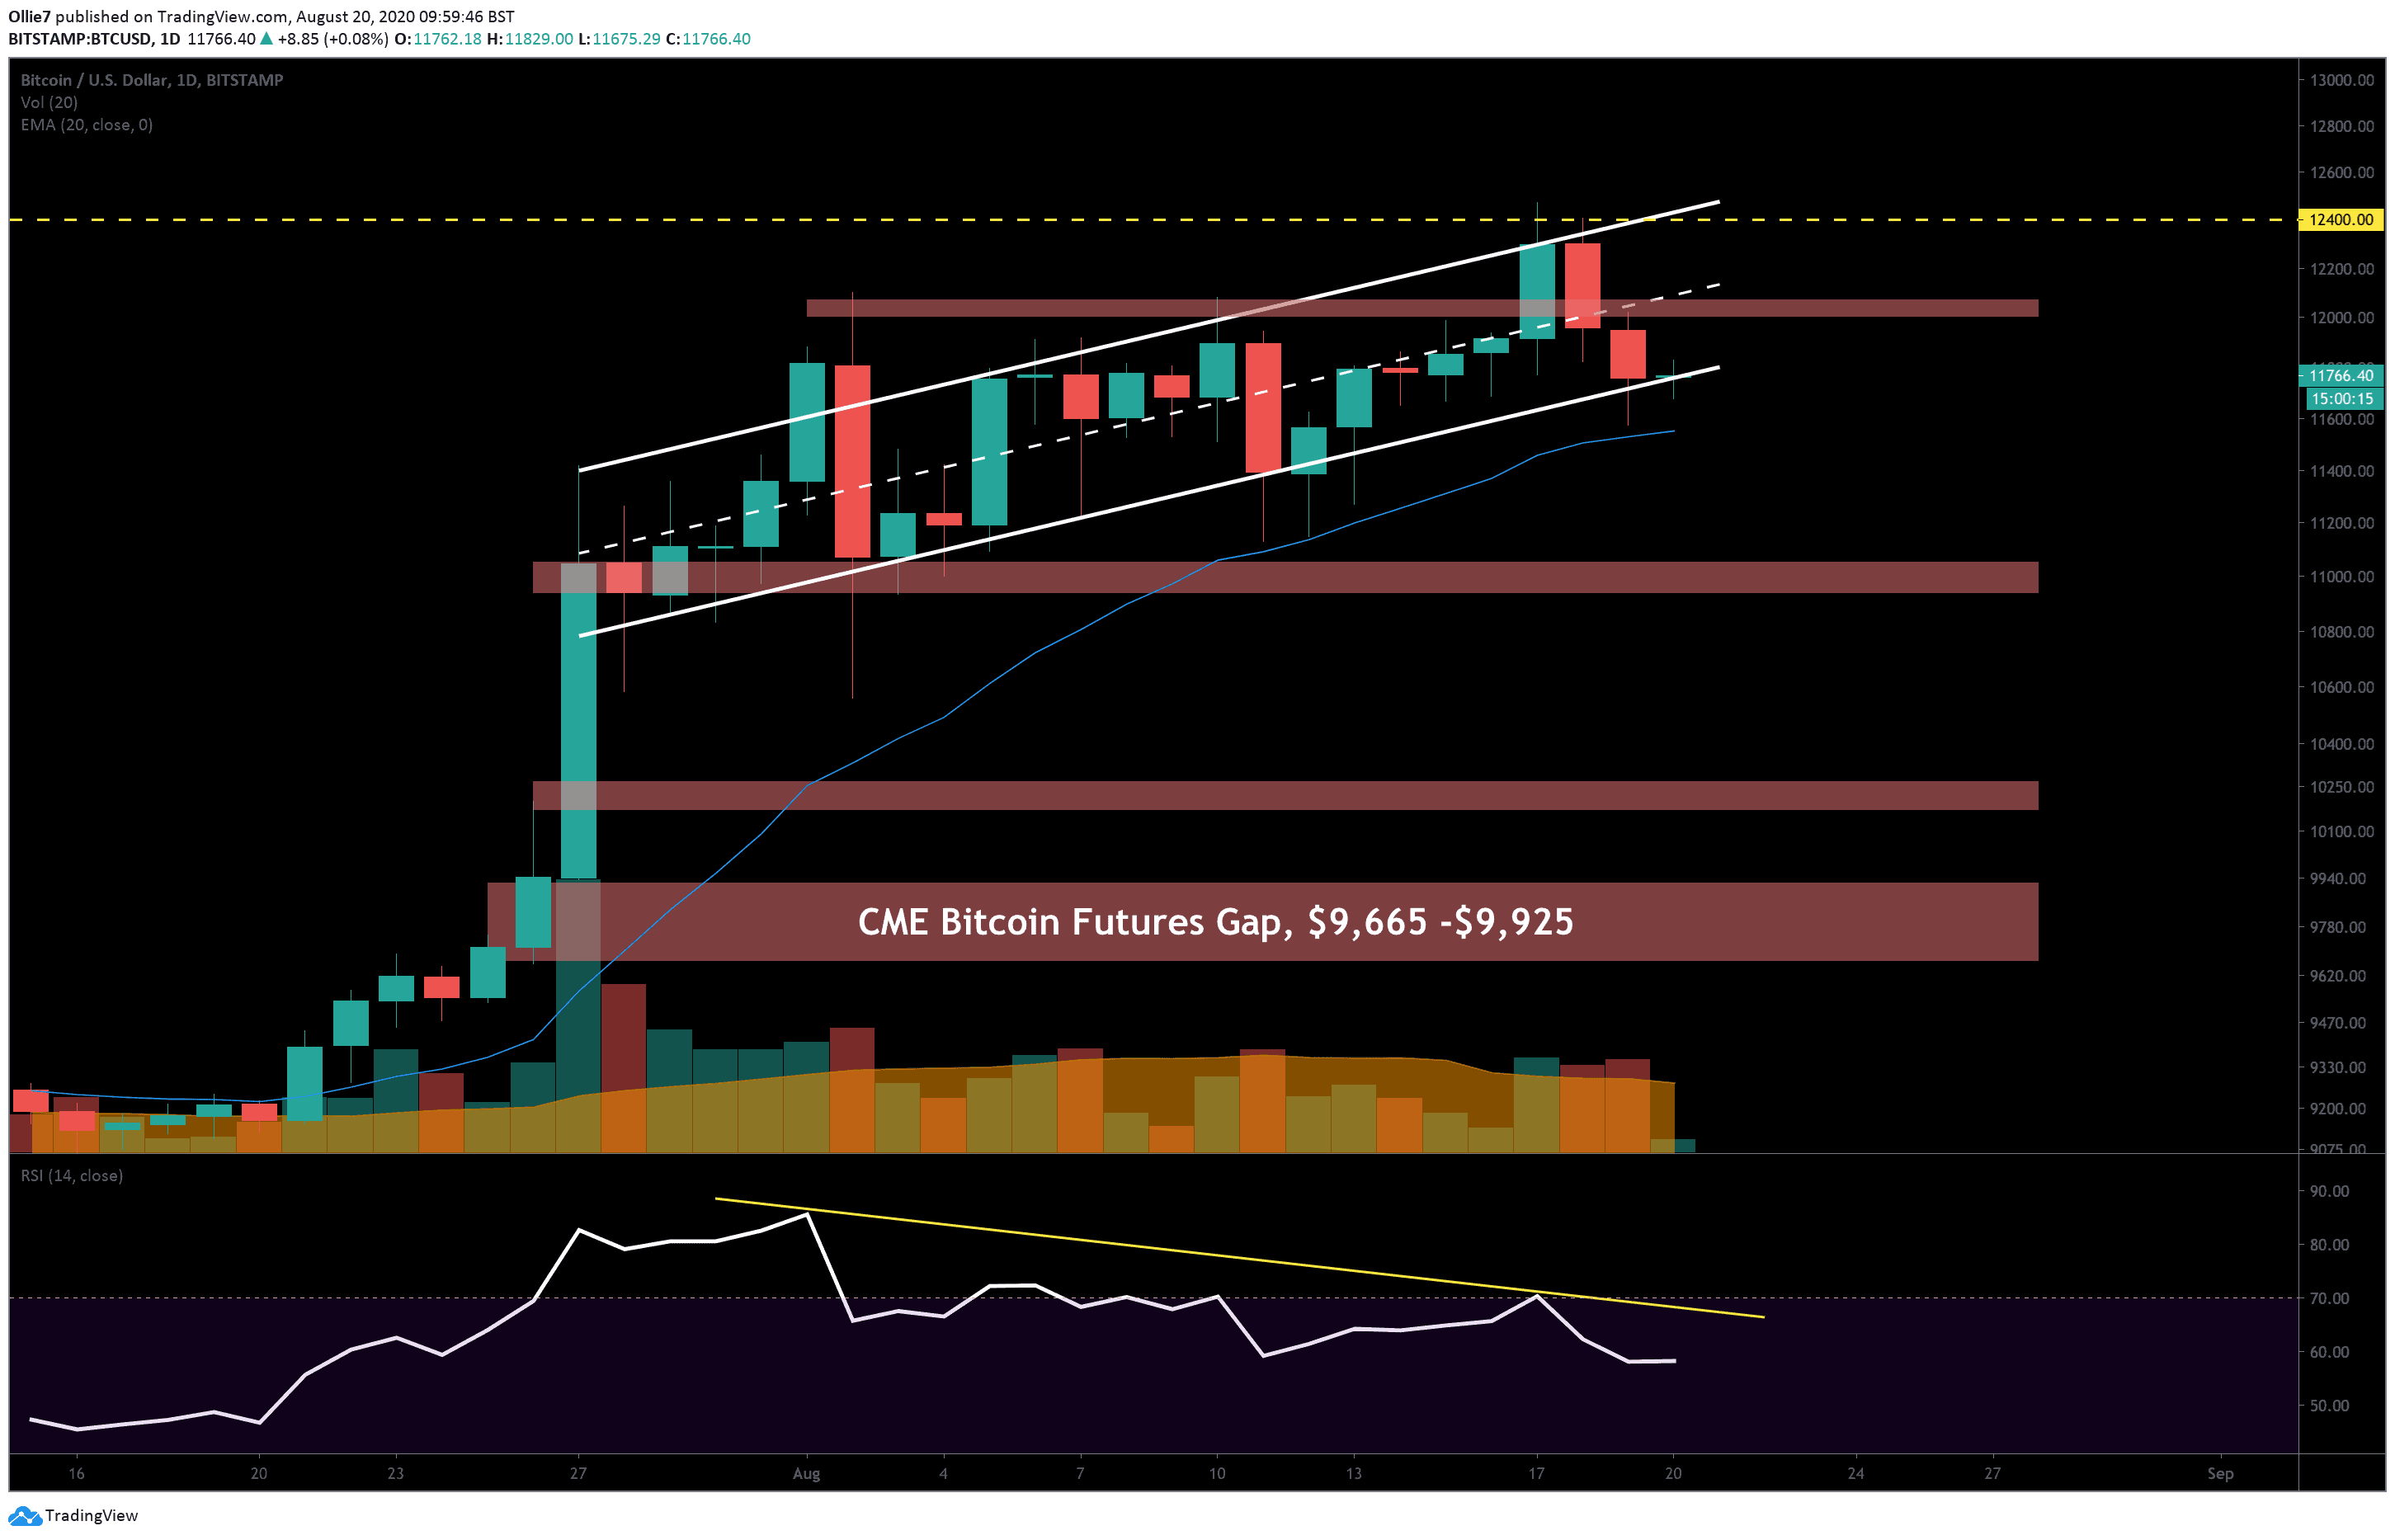
This exodus of investment has now kicked Bitcoin outside of the rising channel that it’s been tracking inside of (mostly) for the past 22 days. What was acting as reliable support has now flipped into a strong resistance level and could prevent the leading cryptocurrency from retracing back to $12,000 in the short-term.
Could this be the start of a bearish decline towards the unfilled CME gap down at $9,665?
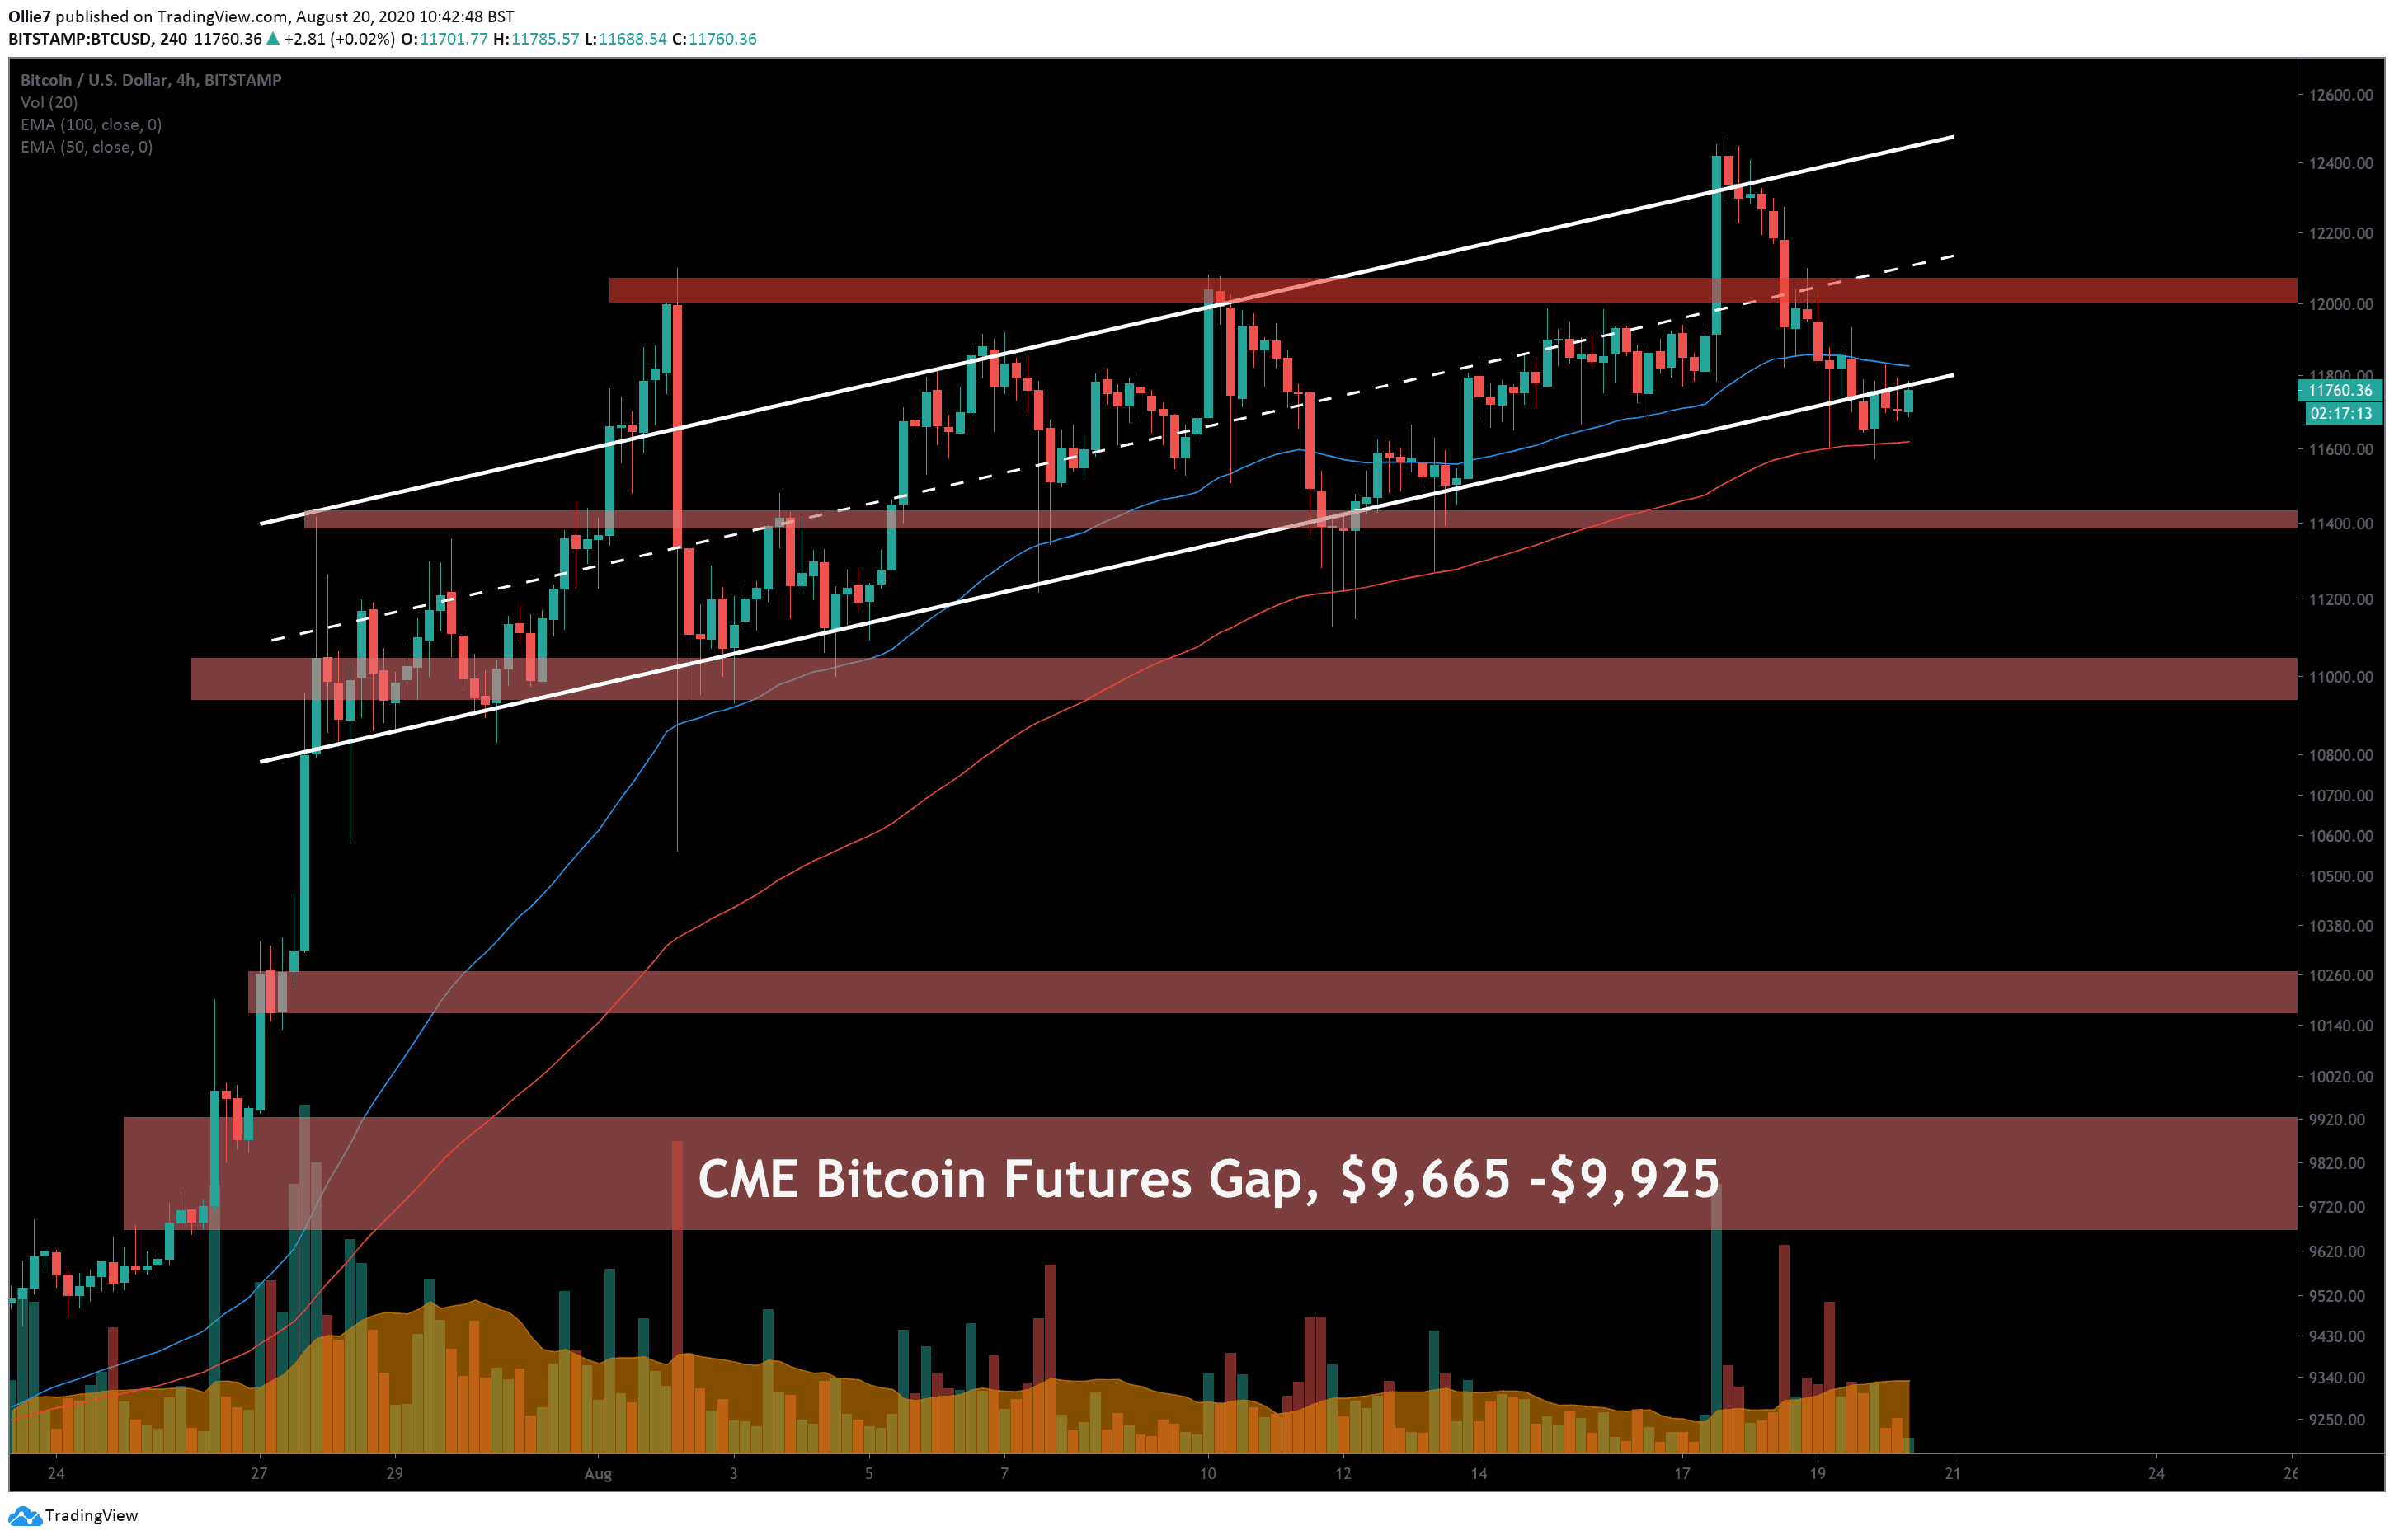
Looking at the 4-Hour BTC/USD chart, we can see that the price action has now closed beneath the main channel resistance around the $11,745 mark, and candles are now throwing back on to it as new resistance. To prevent further decline, bullish traders will need to re-establish this former support soon before panic selling starts.
If we see more downside, then the 100 EMA, which currently sits at $11,610, should provide a foothold for bullish traders to rebound from.
Failing that, there is a stronger support zone (first green shaded area) below between the $11,435 – $11,400 levels. This particular area has been a key S/R zone over the last month for Bitcoin and should get some sort of reaction if prices dip below $11,500. This is the last safety net for Bitcoin before the psychological $11,000 level.
Looking above to likely resistances, if an uptrend begins, we can see that the 50 EMA – around $11,800 – has already shown itself to be a reasonably difficult line to overcome. This will likely be the first major hurdle before going on to retest the $12,000 level.
From there, the median line of the channel will likely create the next area of resistance, somewhere near the $12,100 level.
Parabolic SAR dots are still hovering over the 4-Hour price action, which suggests that the current trend is still favorably bearish.
On the daily RSI, there is a substantial divergence between Bitcoin’s price and the strength of the trend shown on the indicator between the two higher highs during August 1 and August 17, respectively. This usually implies that the trend is weakening and will flip bearish soon.
On the daily MACD, selling volume is also increasing on the histogram.
Total market capital: $376 billion
Bitcoin market capital: $217 billion
Bitcoin dominance: 57.7%
*Data by Coingecko.