The trouble continues for Ripple after the market drops by a further 8% over the previous week, bringing the current price for the coin down to around $0.3240, while against Bitcoin the situation is worse.
While other major altcoins such as EOS, Bitcoin Cash, Litecoin and Binance Coin surging by over 100% during the past 90 days, Ripple has struggled significantly to gain momentum and it has been almost break-even over that time.
Ripple remains ranked in thrid place in the on the top cryptocurrencies by market-cap as it holds a $13.56 billion market cap.
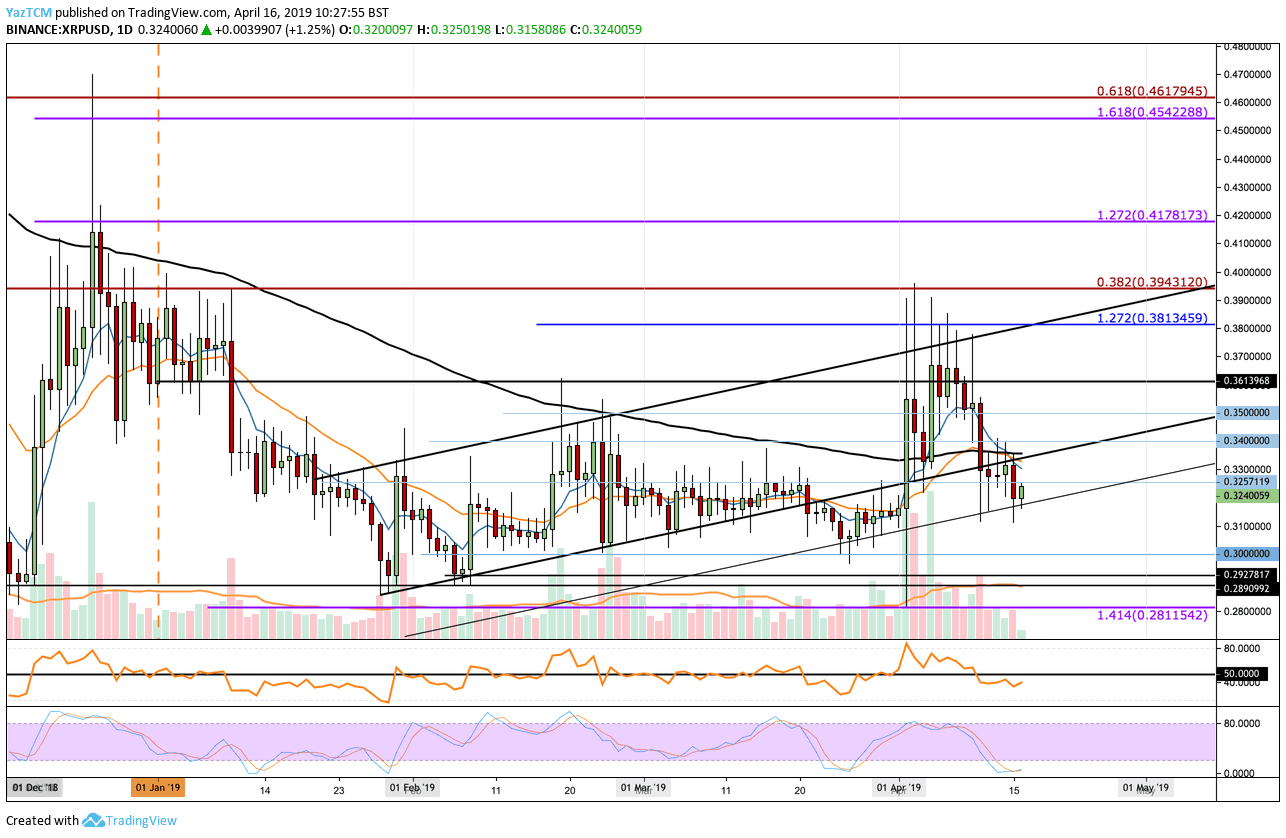
Looking at the XRP/USD 1-Day Chart:
- Against the Dollar, Ripple has continued to drop even more, beneath the previous analysis’ ascending price channel. However, the market has formed a new rising trend line which is parallel to the previous price channel creating new support areas for Ripple.
- From above: The nearest level of resistance lies at the lower boundary of the previous price channel. Above this, further resistance is located at $0.34, $0.35 and $0.3613. Further resistance lies at $0.3815 and then the upper boundary of the price channel.
- From below: The new rising support line is the nearest support, further support lies at $0.31 and $0.30. Beneath the key-level of $0.30, support lies at $0.2890 and $0.2811.
- The Stochastic RSI is poised for a crossover above (at the oversold area) which is a sign for a correction that might be approaching. If the RSI can rise above the 50 levels, we can expect the bulls to regain control of the momentum and push XRP/USD higher.
- The trading volume, however, has continued to decrease and has reached average levels for the year. This could be a sign that the bears have slowed down their pace of selling.
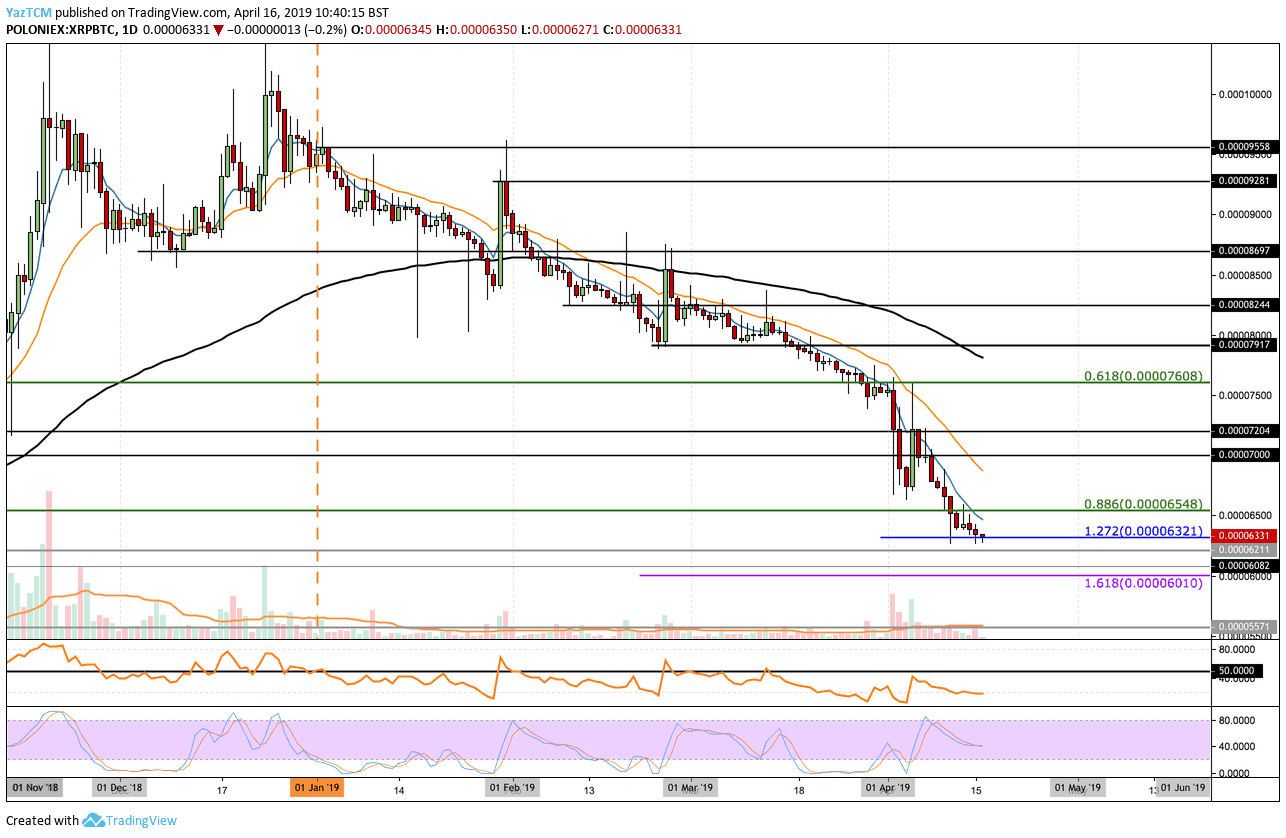
Looking at the XRP/BTC 1-Day Chart:
- Against Bitcoin, Ripple has struggled throughout 2019: The market has been consistently dropping since December 25,2018, when XRP recorded a price of 10700 SAT (approximately 40% decrease), and has recently found support at 6321 SAT where lies a short term downside 1.272 Fibonacci extension level.
- From above: The nearest level of resistance lies at 6548 SAT, and 7000 SAT. Above 7000 SAT, further resistance lies at 7200 SAT and 7600 SAT.
- From below: Support beneath 6321 SAT lies at 6211 SAT which is the August 2018 high. Beneath this, more support lies between 6010 SAT and 6000 SAT.
- The RSI remains in the bearish territory, while the trading volume has been decreasing across the largest cryptocurrency exchanges.
SPECIAL OFFER (Sponsored)
LIMITED OFFER 2024 for CryptoPotato readers at Bybit: Use this link to register and open a $500 BTC-USDT position on Bybit Exchange for free!
Disclaimer: Information found on CryptoPotato is those of writers quoted. It does not represent the opinions of CryptoPotato on whether to buy, sell, or hold any investments. You are advised to conduct your own research before making any investment decisions. Use provided information at your own risk. See Disclaimer for more information.
Cryptocurrency charts by TradingView.