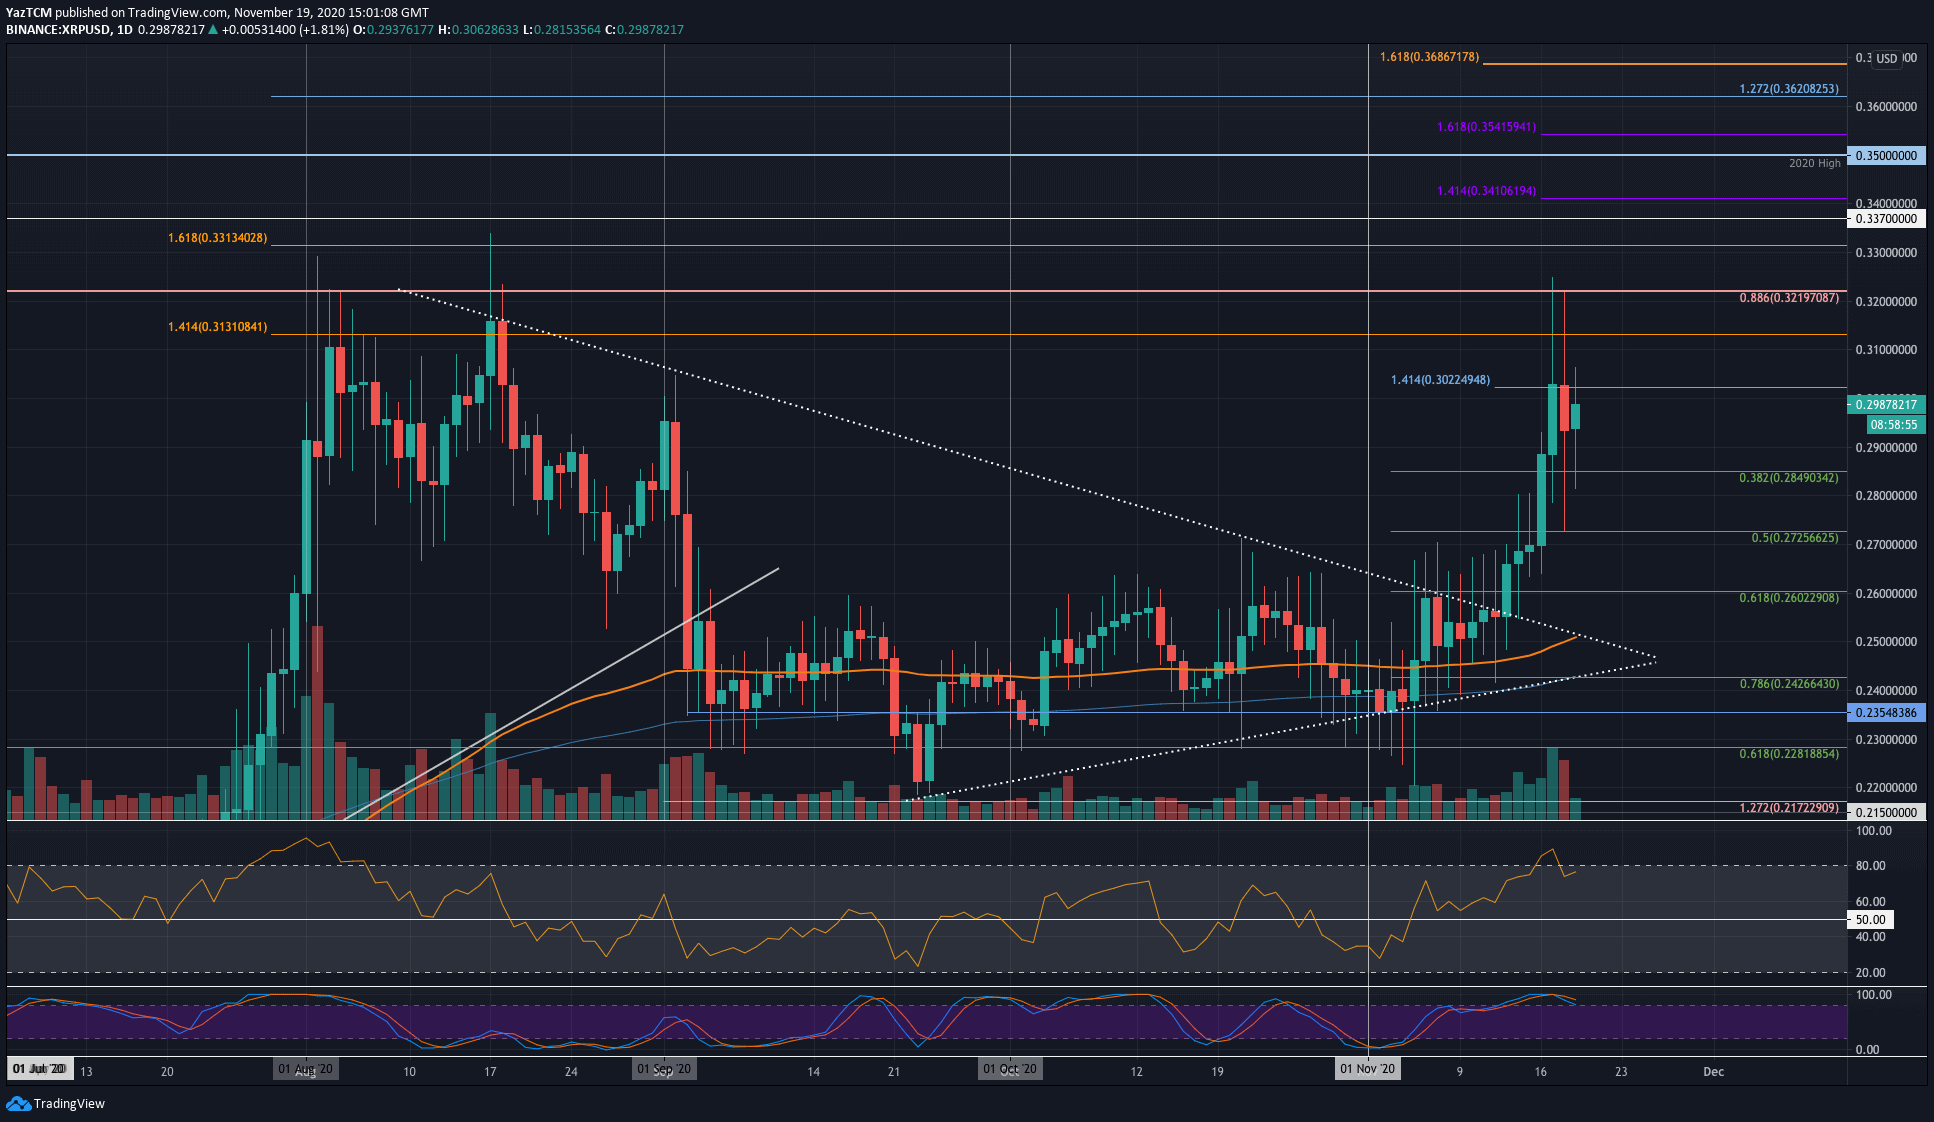
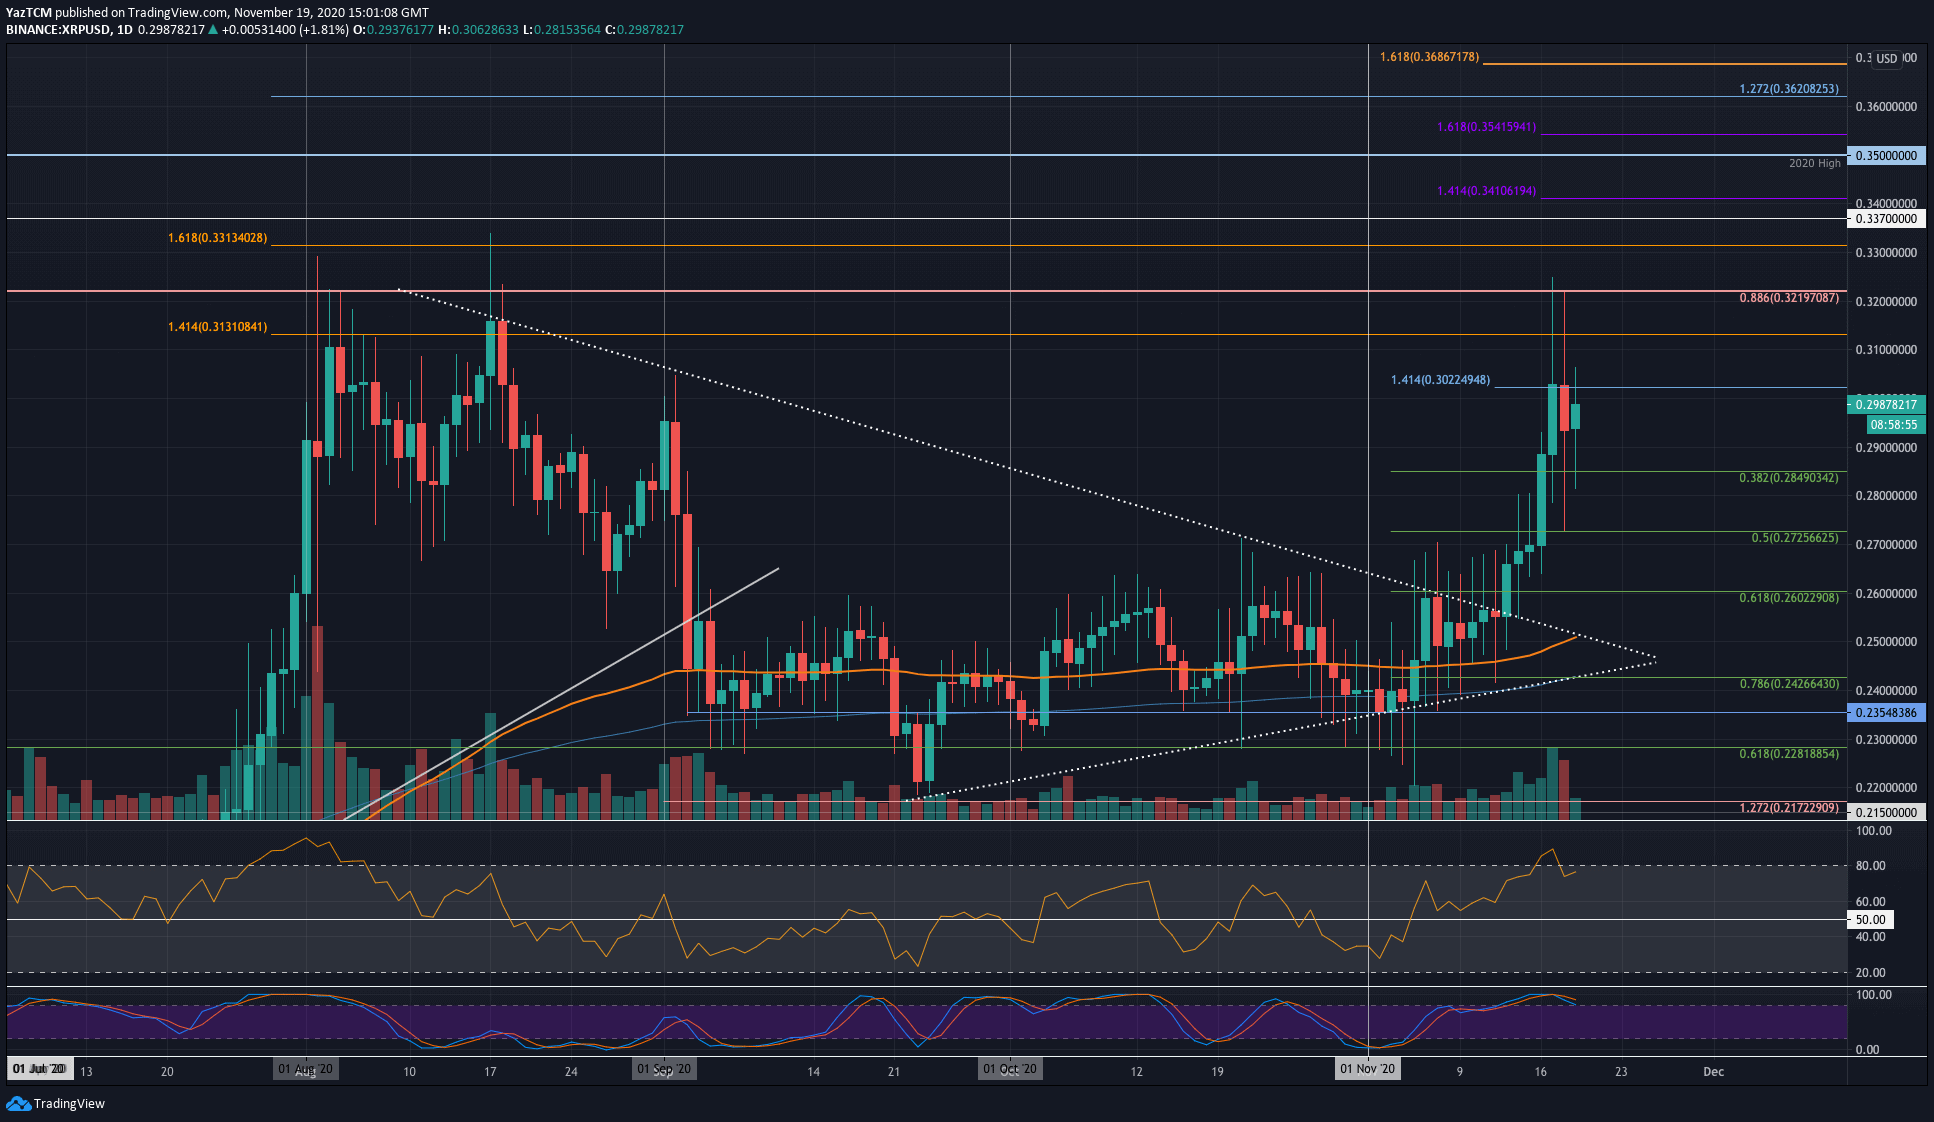
XRP/USD Daily Chart. Source: TradingView
Key Support Levels: $0.285, $0.272, $0.26.
Key Resistance Levels: $0.302, $0.313, $0.321.
On Tuesday, XRP surged as high as $0.321 (bearish .886 Fib Retracement). The sellers quickly pushed the market lower from here as they closed the daily candle beneath the $0.302 resistance (1.414 Fib extension).
The buyers spiked back above $0.302 yesterday. However, the sellers stepped back in again to make sure the daily candle closed beneath $0.302. The coin also spiked as low as $0.272 (.5 Fib Retracement) yesterday, but it quickly rebounded from here.
Today, XRP is attempting to break back above the $0.30 resistance.
Looking ahead, if the bulls break $0.302 again, the first level of resistance lies at $0.313. Following this, resistance is found at $0.321 (bearish .886 Fib), $0.33, and $0.337.
On the other side, the first level of support lies at $0.285 (.382 Fib). Beneath this, support is found at $0.272 (.5 Fib), $0.26 (.618 Fib), and $0.25.
The RSI has dropped slightly from overbought conditions as the buyers became overextended. Additionally, the Stochastic RSI has produced a bearish crossover signal, which is a bad sign for the bulls.
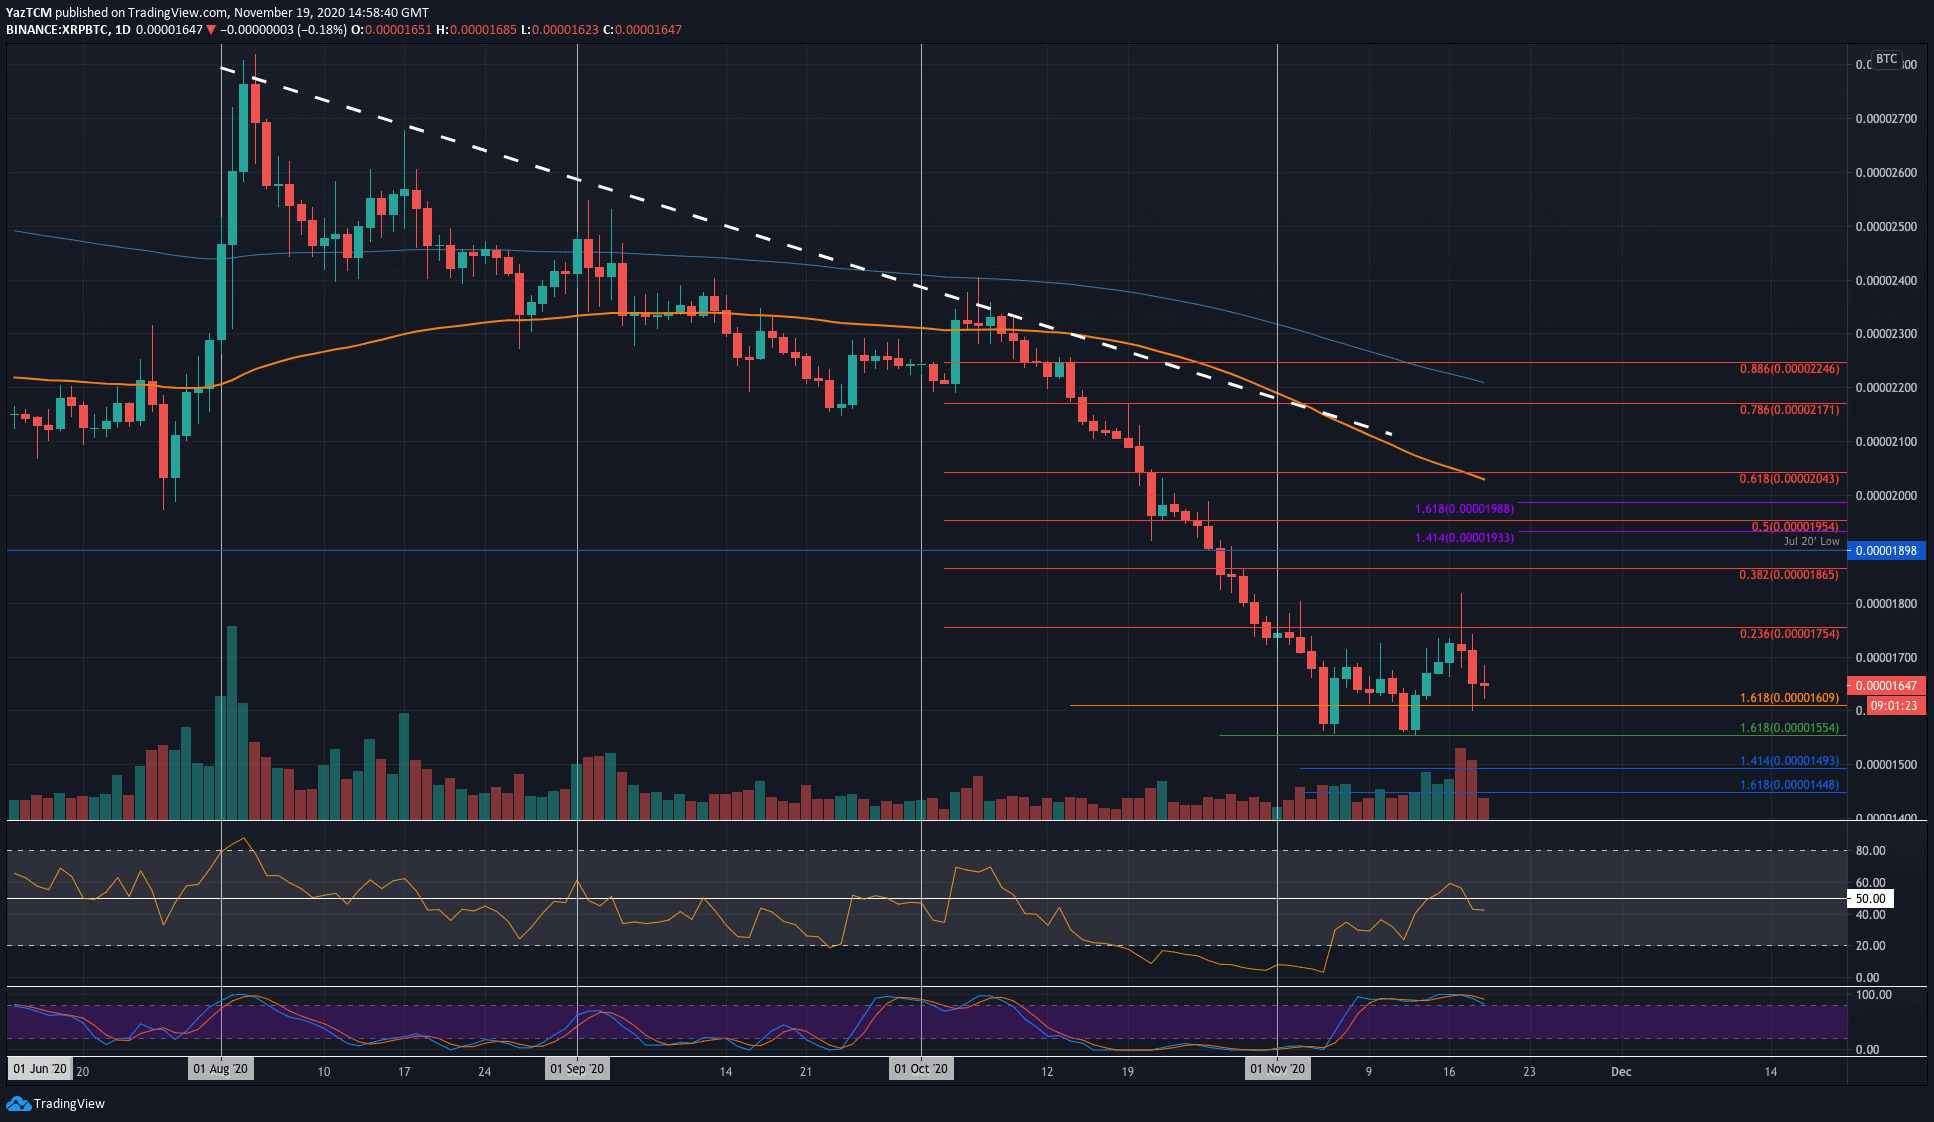
Key Support Levels: 1600 SAT, 1555 SAT, 1493 SAT.
Key Resistance Levels: 1700 SAT, 1755 SAT, 1800 SAT.
XRP rebounded from the support at 1555 SAT last week as it started to attempt a recovery against Bitcoin. The bulls managed to push above the 1700 SAT level and spike as high as 1800 SAT.
Unfortunately, they could not sustain these highs, which caused XRP to roll over and trade at the current 1650 SAT level.
Looking ahead, if the sellers push lower, the first level of support lies at 1600 SAT. Beneath this, support is found at 1555 SAT, 1493 SAT, and 1450 SAT.
On the other side, the first level of resistance is expected at 1700 SAT. Above this, resistance lies at 1755 SAT (bearish .236 Fib), 1800 SAT, and 1865 SAT (bearish .382 Fib).
The RSI has dipped back beneath the mid-line as the bears regain control of the market momentum. Additionally, the Stochastic RSI also produced a bearish crossover signal, which is a worrying sign.