Ethereum has seen a 7.5% price increase over the past 24 hours of trading, bringing the current price for the coin up to around $181.50. The cryptocurrency has now started a remarkable run after increasing by 27.50% over the past seven days.
Today’s high of $187 per ETH, is the highest price for Ethereum since November 14, 2018. The last was the date Bitcoin started crashing from the 2018 long-term $6000 support line.
The veteran crypto project is the second largest crypto by market-cap value as it currently holds a $19.14 billion market cap value.
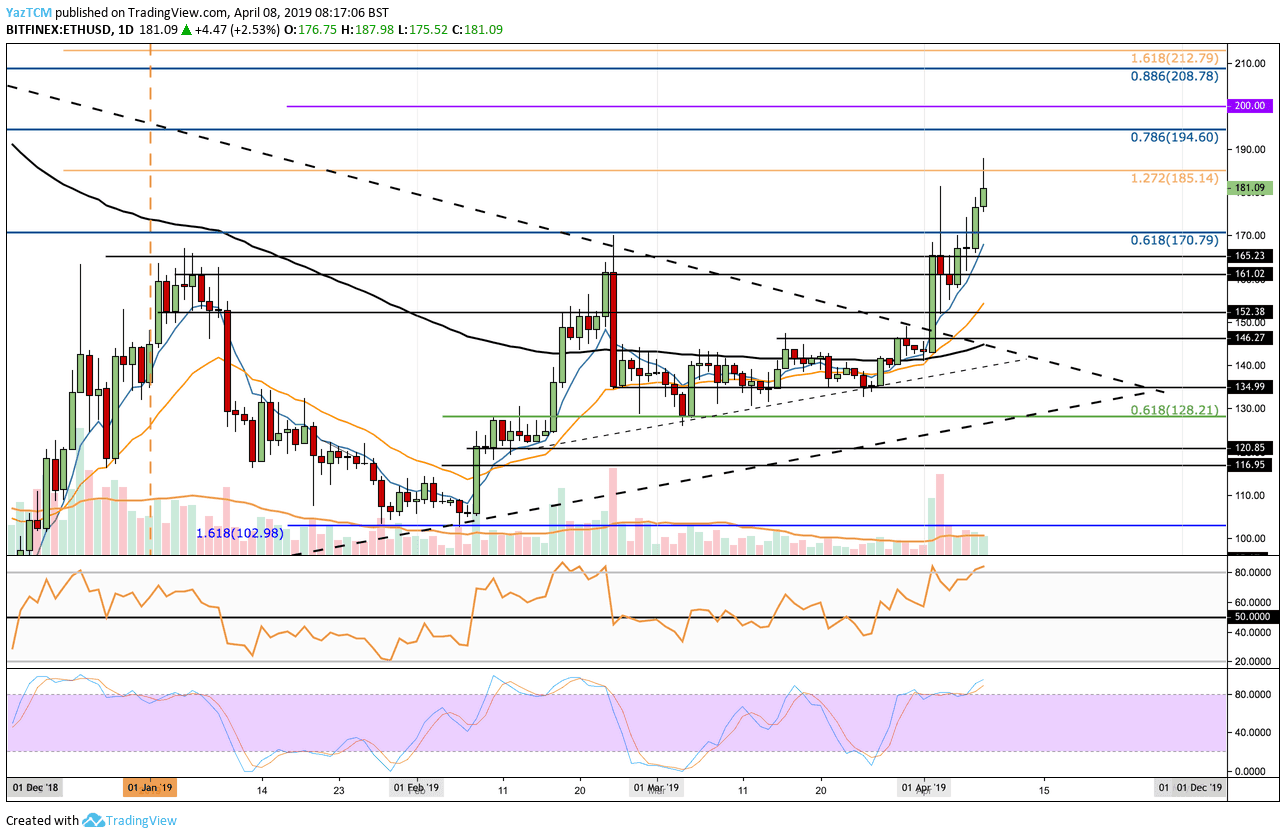
Looking at the ETH/USD 1-Day Chart:
- Since our previous ETH/USD analysis, we can see that the market has risen and broken out of the symmetrical triangle we had pointed out on our last price analysis. The market had continued to increase and managed to break above resistance at the 2019 high around $170. Price action has now recently met resistance at $185 where lies the medium termed 1.272 Fibonacci Extension level.
- From above: Besides $185, the next level of resistance lies at $194, which contains the bearish .786 Fibonacci Retracement level, followed with strong resistance at the legendary $200 level. Further resistance can then be expected at $212 where lies the medium termed 1.618 Fibonacci Extension level.
- From below: The nearest level of support now lies at $170. Below, support is located at $161, $151, $146 and the 100-days moving average line, currently around $140.
- The RSI has recently entered the overbought area which may signal a potential pullback soon. However, we still wait for a crossover down on the Stochastic RSI.
- The trading volume has been steadily rising during April.
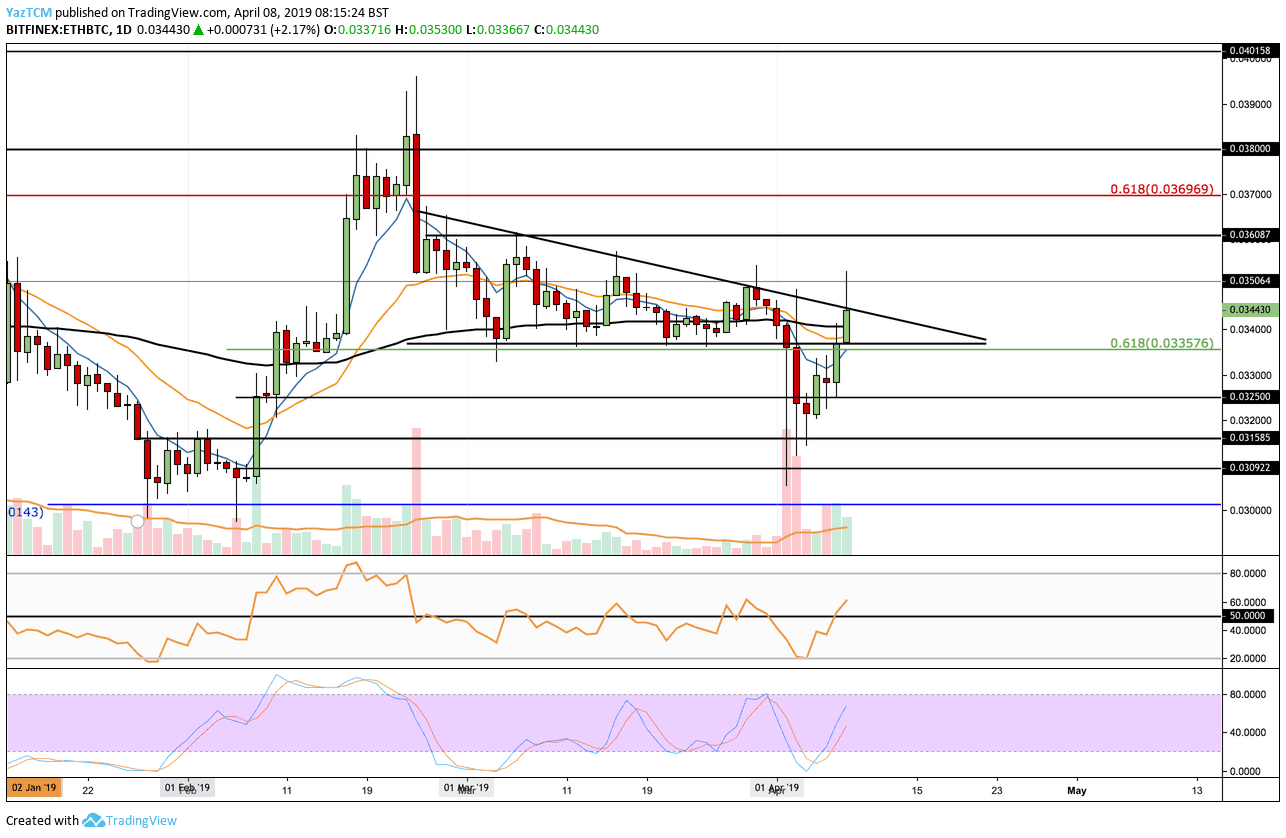
Looking at the ETH/BTC 1-Day Chart:
- Following our previous ETH/BTC, we can see that Etehreum has been on a rollercoaster. The market had initially dropped beneath the descending triangle previously mentioned. However, we can see that the coin had found support around 0.032 BTC and rebounded. The market is now trading at the upper boundary resistance of the descending triangle.
- From above: Besides the triangle, initial resistance is located at 0.035 BTC. Further resistance above can be found at 0.036 BTC and 0.037 BTC, where lies a short term bearish .618 Fibonacci Retracement level. Above 0.037 BTC, further resistance is located at 0.038 BTC and then the strong resistance area of 0.040 BTC.
- From below: The nearest level of support is located at the base of the triangle around 0.0335 BTC. Below the triangle, further support lies at 0.0325 BTC, 0.031 BTC, and 0.030 BTC.
- Since the recent Stochastic RSI cross over (at the oversold zone) Eheterum is back to the bullish territory.
- The trading volume has also been increasing during April 2019.
SPECIAL OFFER (Sponsored)
LIMITED OFFER 2024 for CryptoPotato readers at Bybit: Use this link to register and open a $500 BTC-USDT position on Bybit Exchange for free!
Disclaimer: Information found on CryptoPotato is those of writers quoted. It does not represent the opinions of CryptoPotato on whether to buy, sell, or hold any investments. You are advised to conduct your own research before making any investment decisions. Use provided information at your own risk. See Disclaimer for more information.
Cryptocurrency charts by TradingView.