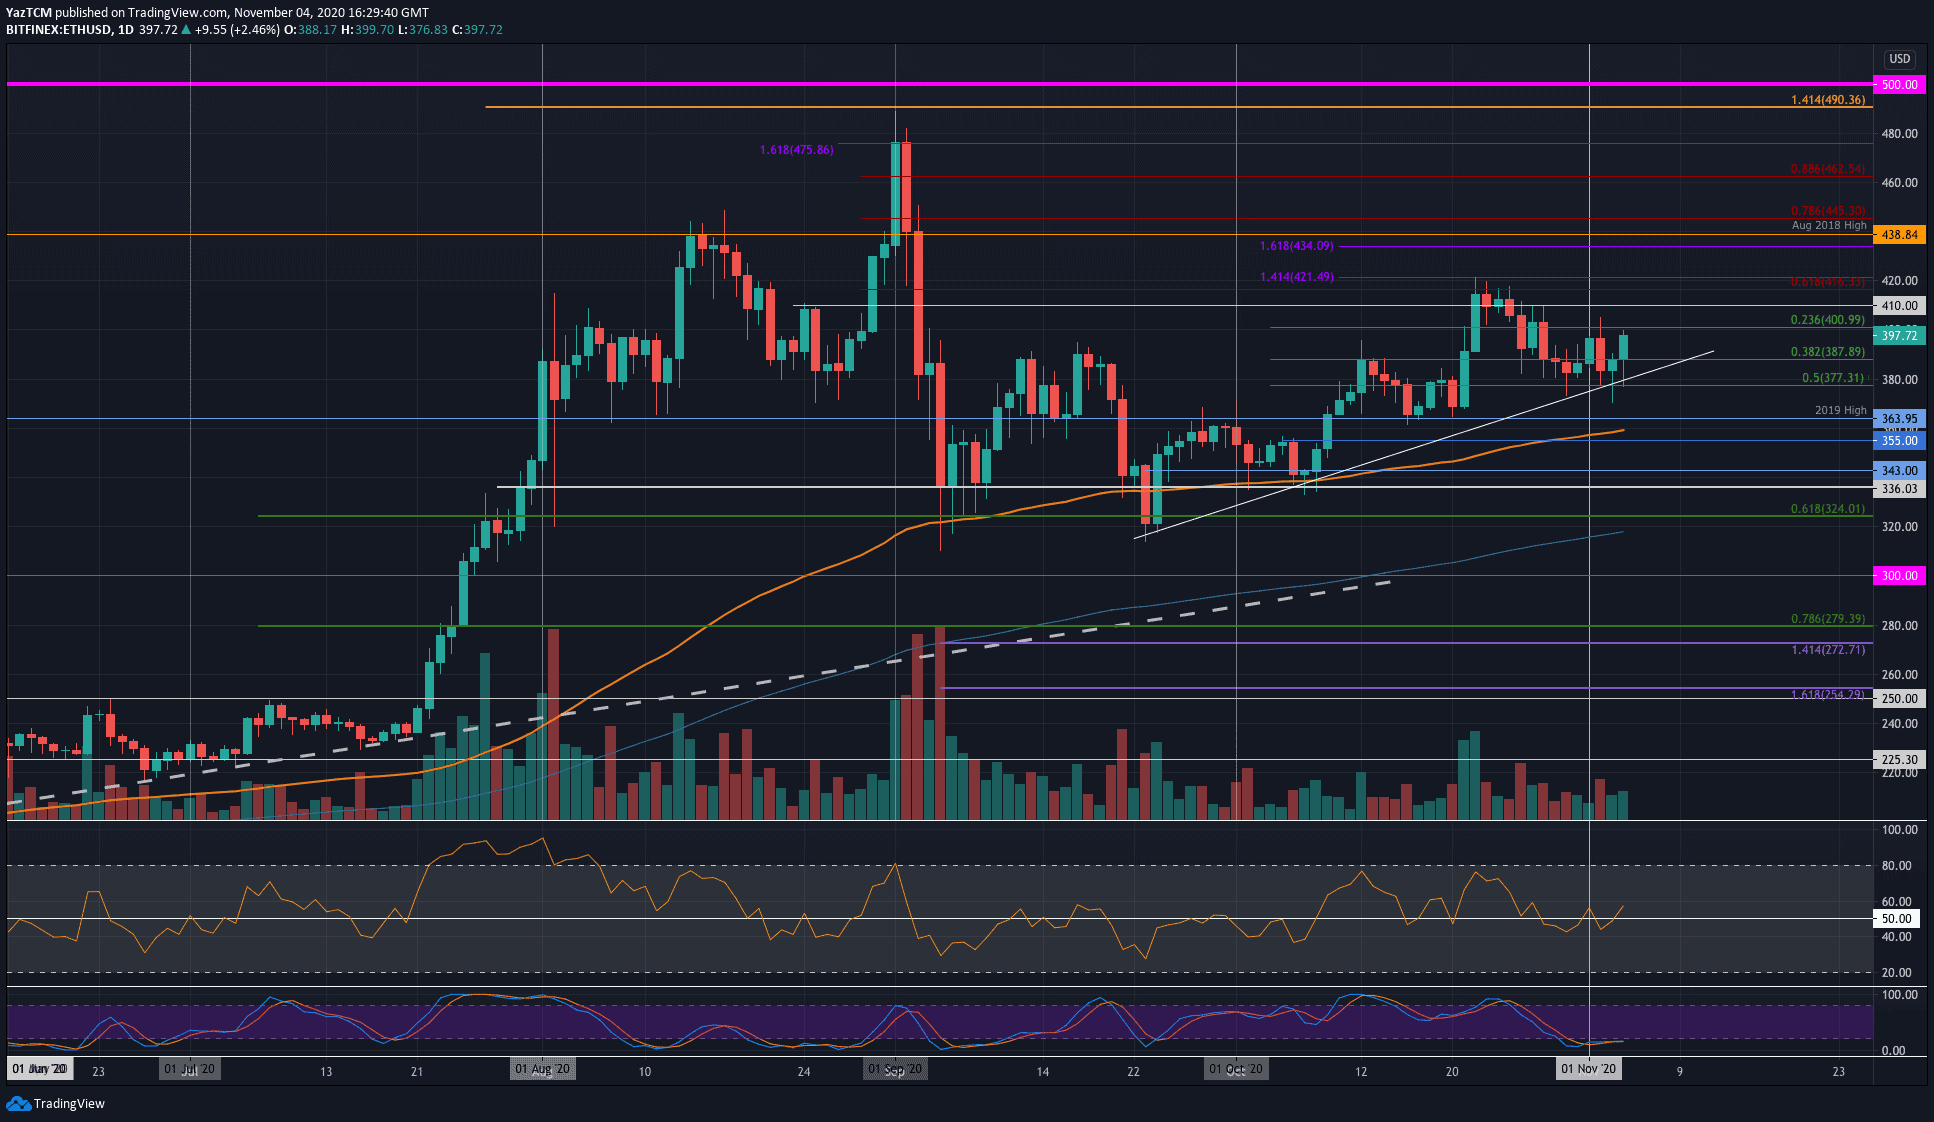
ETH/USD Daily Chart. Source: TradingView
Key Support Levels: $390, $377, $364.
Key Resistance Levels: $410, $416, $421.
Ethereum struggled to break the resistance at $416 (bearish .618 Fib) earlier in October which saw the coin heading lower over the past week. ETH found support at the $380 level as it bounced off of a rising support trend line yesterday.
Today, after a dip to $377 (.5 Fib Retracement), the buyers regrouped and pushed higher toward the $400 level. This is largely due to BTC pushing above $14,000 again and ETH reversing against BTC.
Looking ahead, the first level of support lies at $390 (.382 Fib). This is followed by support at a rising trend line, $377 (.5 Fib), and $364 (2019 Highs).
On the other side, if the buyers continue beyond $400, the first level of resistance lies at $410. Following this, resistance is located at $416 (bearish .618 Fib), $421 (1.414 Fib Extension), and $434.
The Stochastic RSI is in oversold condition and is primed for a bullish crossover which should send the market higher. Additionally, the RSI crossed the mid-line to suggest that the buyers are back in control of the market momentum.
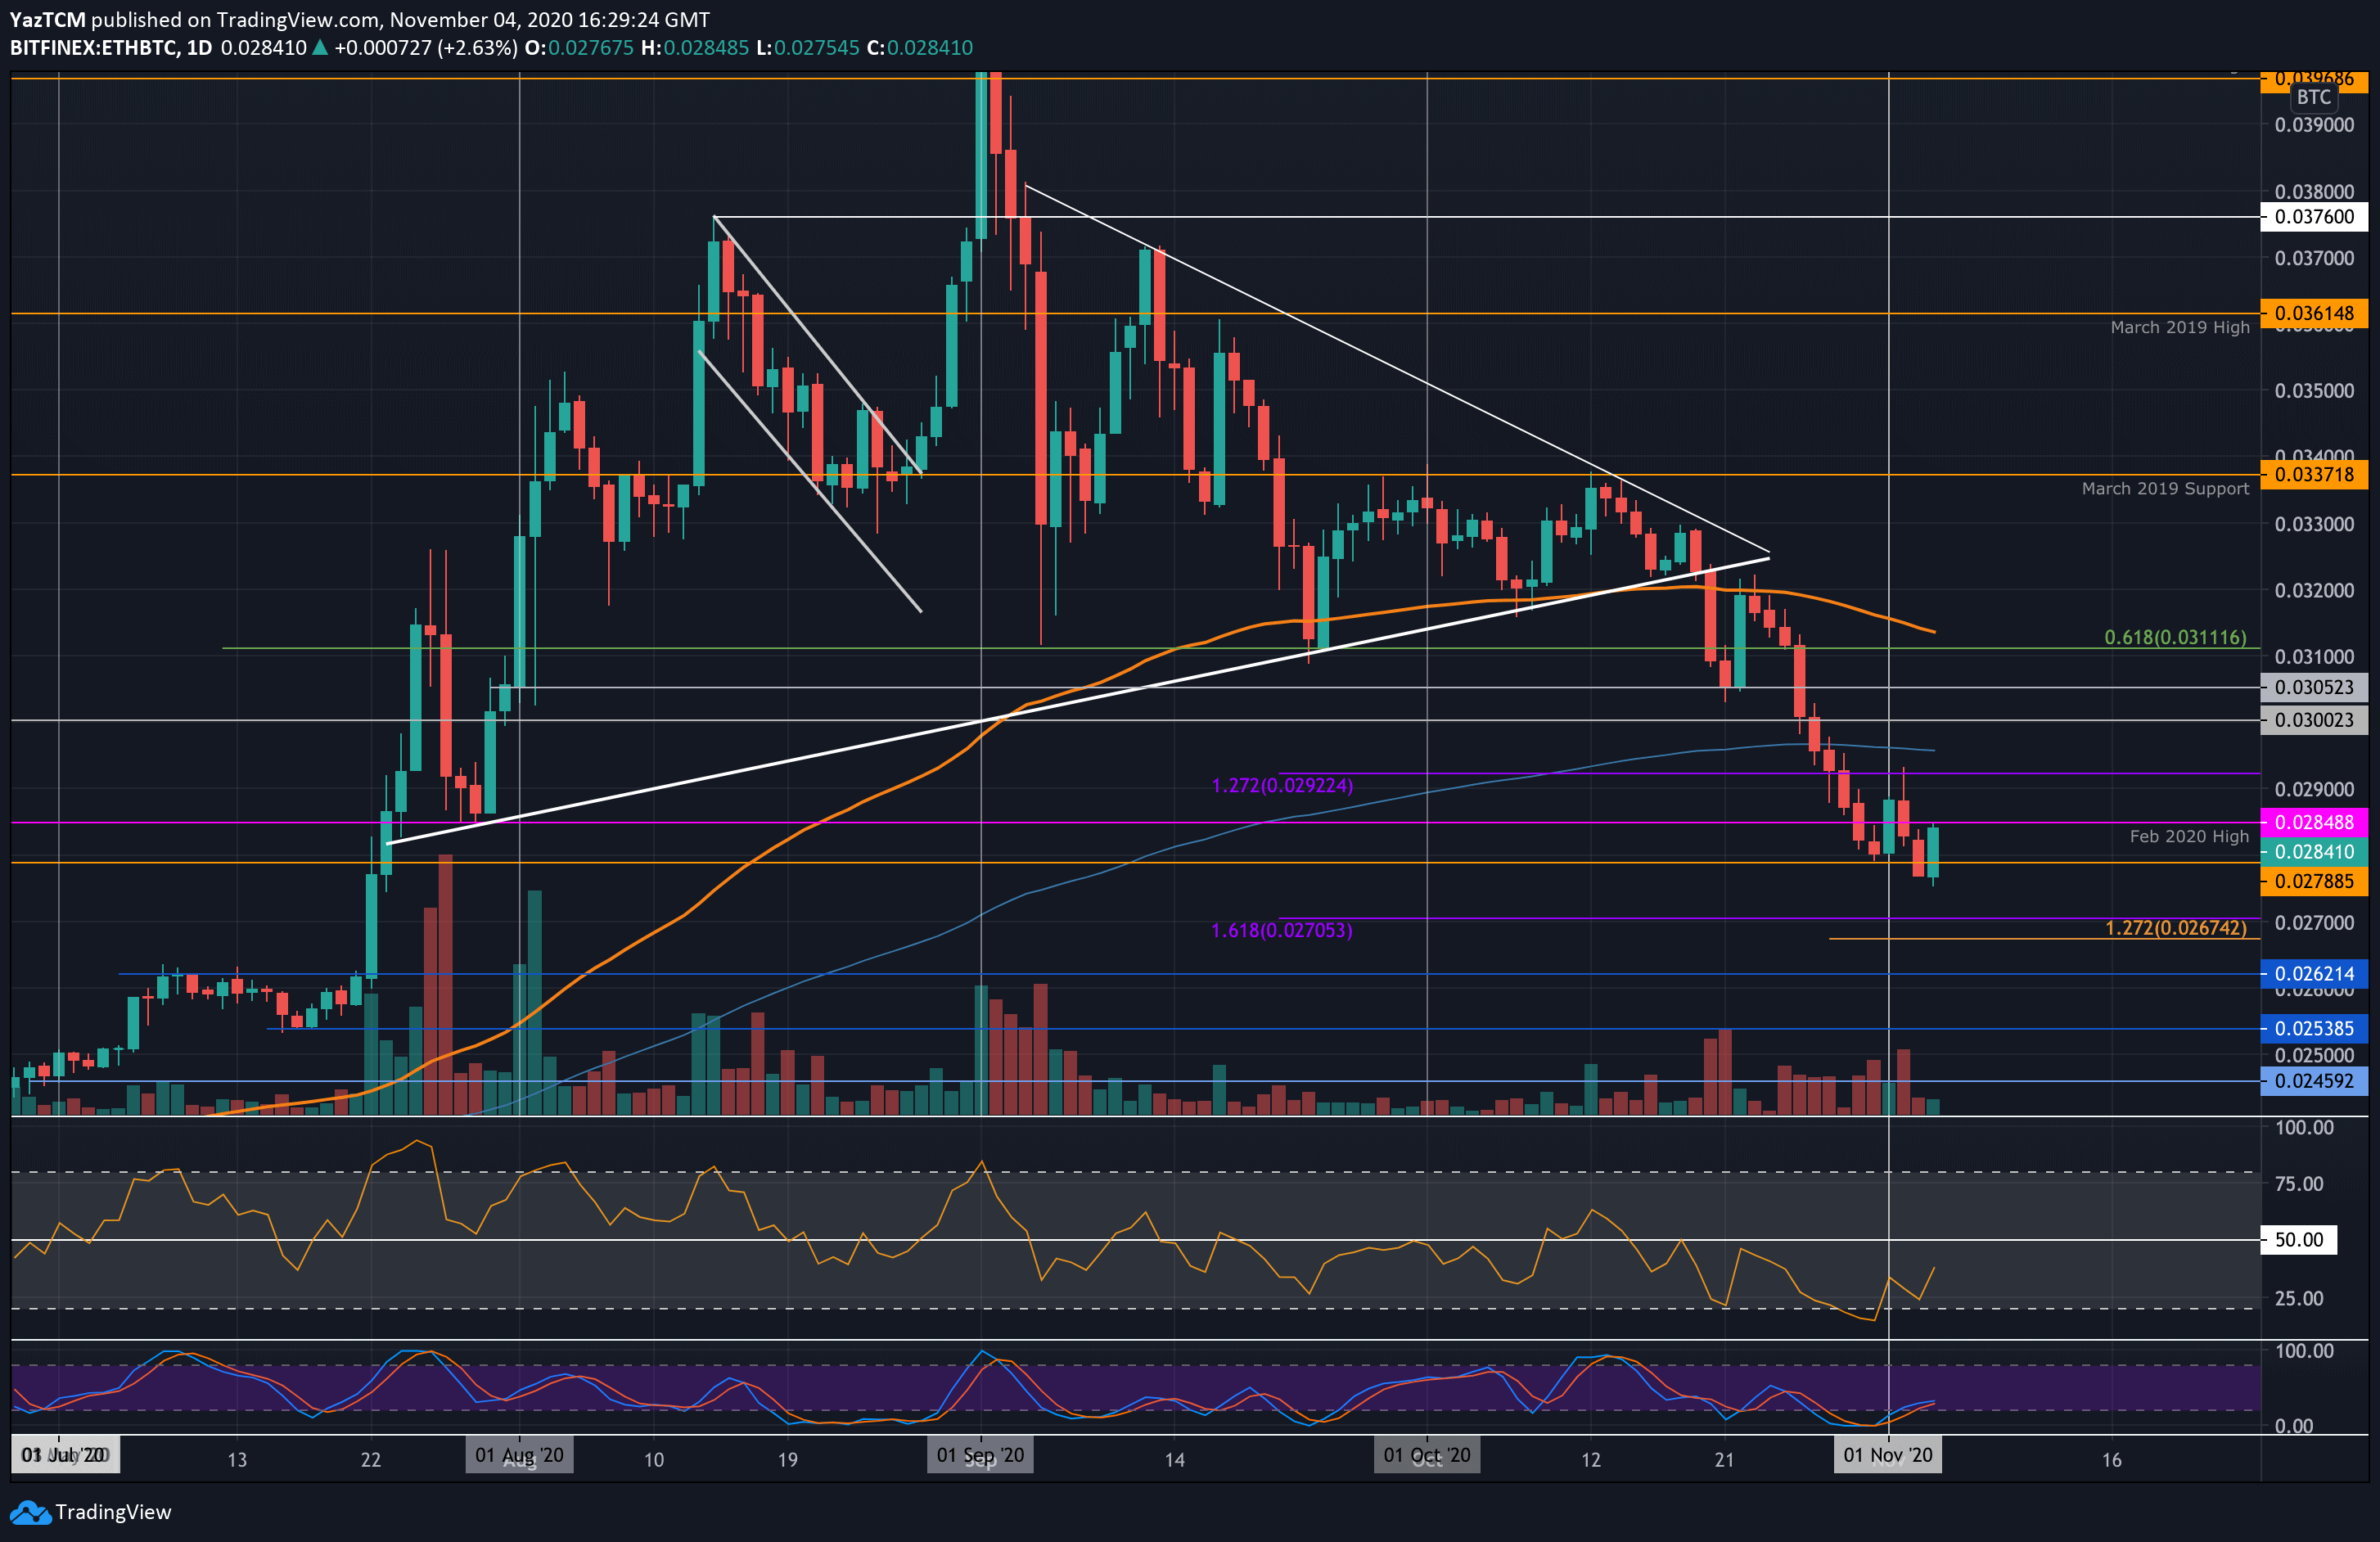
Key Support Levels: 0.0278 BTC, 0.0275 BTC, 0.027 BTC.
Key Resistance Levels: 0.029 BTC, 0.0296 BTC 0.03 BTC.
Against Bitcoin, Ethereum fell beneath the support at 0.0278 BTC to reach as low as 0.0275 BTC. Today, the buyers regrouped to push higher as they move toward the 0.0282 BTC resistance (Feb 2020 High).
This rebound comes after a fortnight of continuous downward pressure and would be a very welcomed sight for any Ethereum bulls.
Looking ahead, if the buyers break the resistance at the 0.0284 BTC level, the first level of resistance lies at 0.029 BTC. Following this, additional resistance is found at 0.0296 BTC (200-days EMA), and 0.03 BTC.
On the other side, the first level of support lies at 0.0278 BTC. Beneath this, support is found at 0.0275 BTC, 0.027 BTC, and 0.0267 BTC.
The RSI recently bounced from extremely oversold conditions which suggest that the selling momentum is coming to an end.
ne