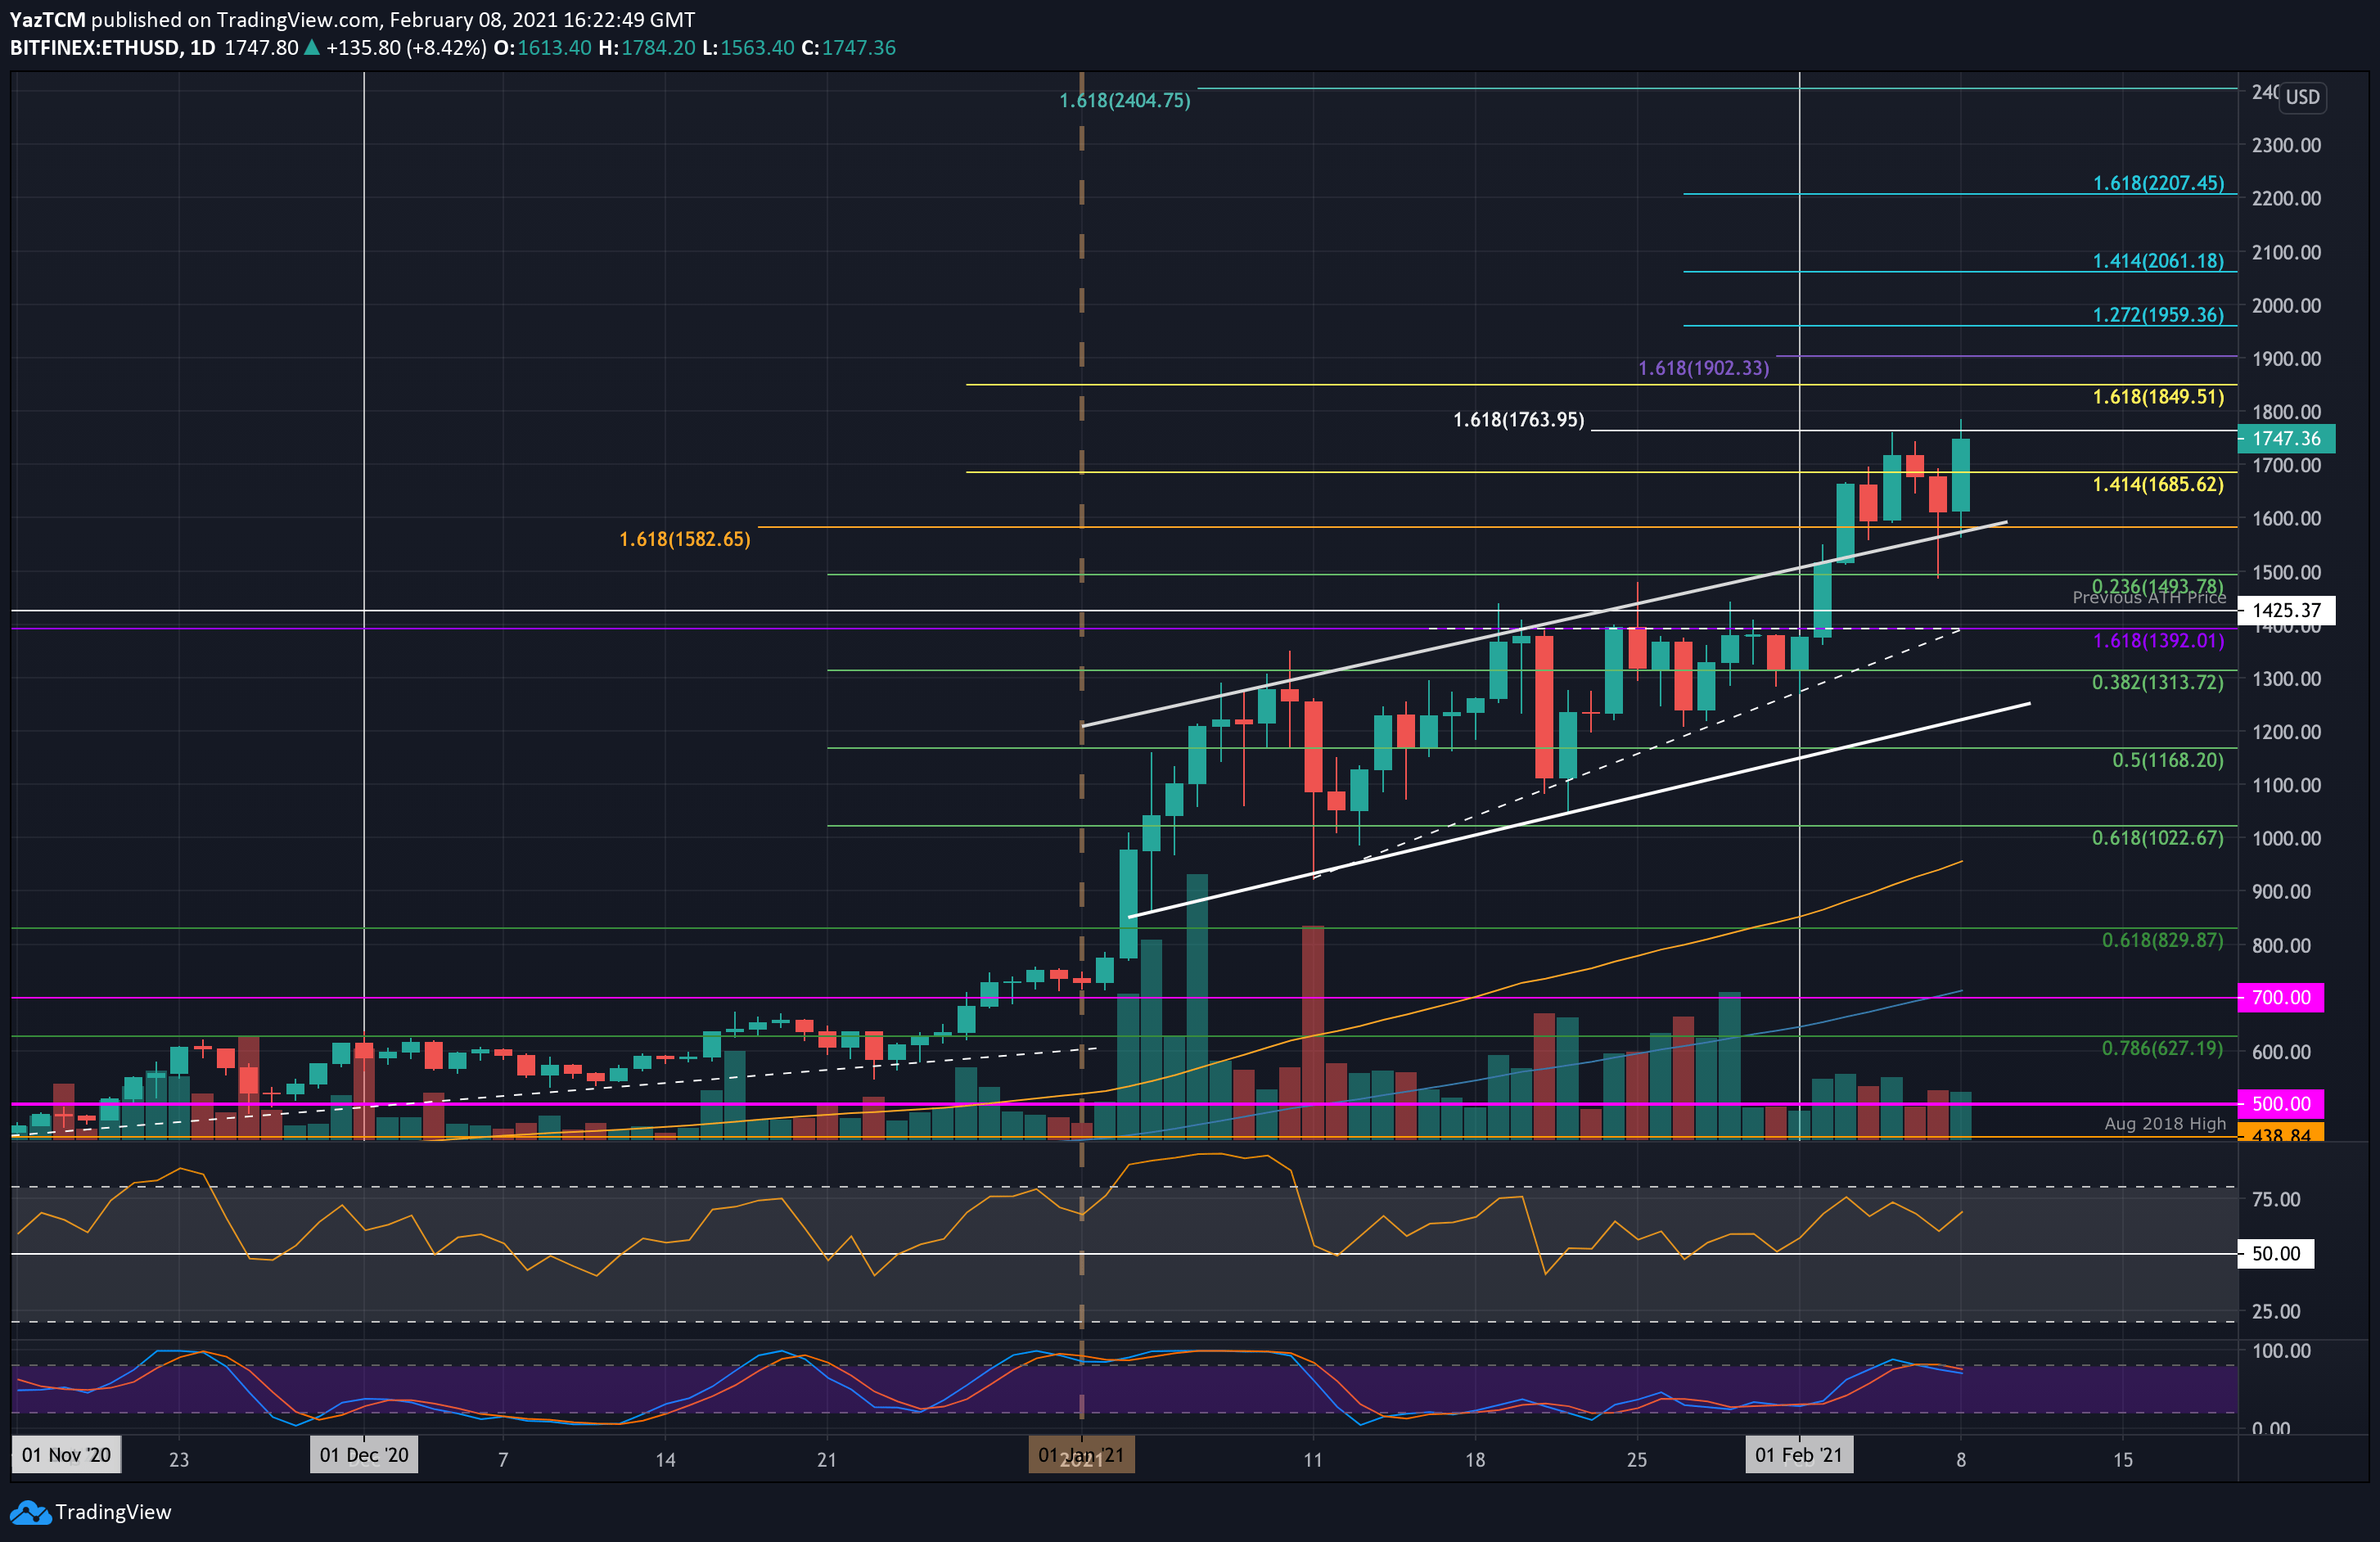
ETH/USD Daily Chart. Source: TradingView
Key Support Levels: $1685, $1600, $1493.
Key Resistance Levels: $1764, $1784, $1800.
Etheruem had been trapped within an ascending price channel for the majority of January 2021. It finally broke above it last Wednesday. The coin climbed until meeting resistance at $1,764 (1.618 Fib Extension) on Friday – setting a new ATH.
Over the weekend, ETH dropped lower from here, spiking as low as $1476 (.236 Fib) yesterday. More specifically, it found support at $1600 (upper boundary of previous trend line) and managed to close the day here.
Today, the 13.6% price surge allowed ETH to spike higher above $1764 to reach a new ATH price at $1784.
Looking ahead, the first resistance lies at $1764. This is followed by $1784 (ATH), $1800, and $1850 (1.618 Fib Extension). Beyond this, additional resistance lies at $1900, $1960, $2000, and $2060.
On the other side, the first support lies at $1686. This is followed by $1600, $1493 (.236 Fib), $1425 (previous ATH), $1392, and $1310 (.382 Fib).
The daily RSI has come down from near overbought conditions but still remains above 50, indicating the buyer are still in control over the market momentum.
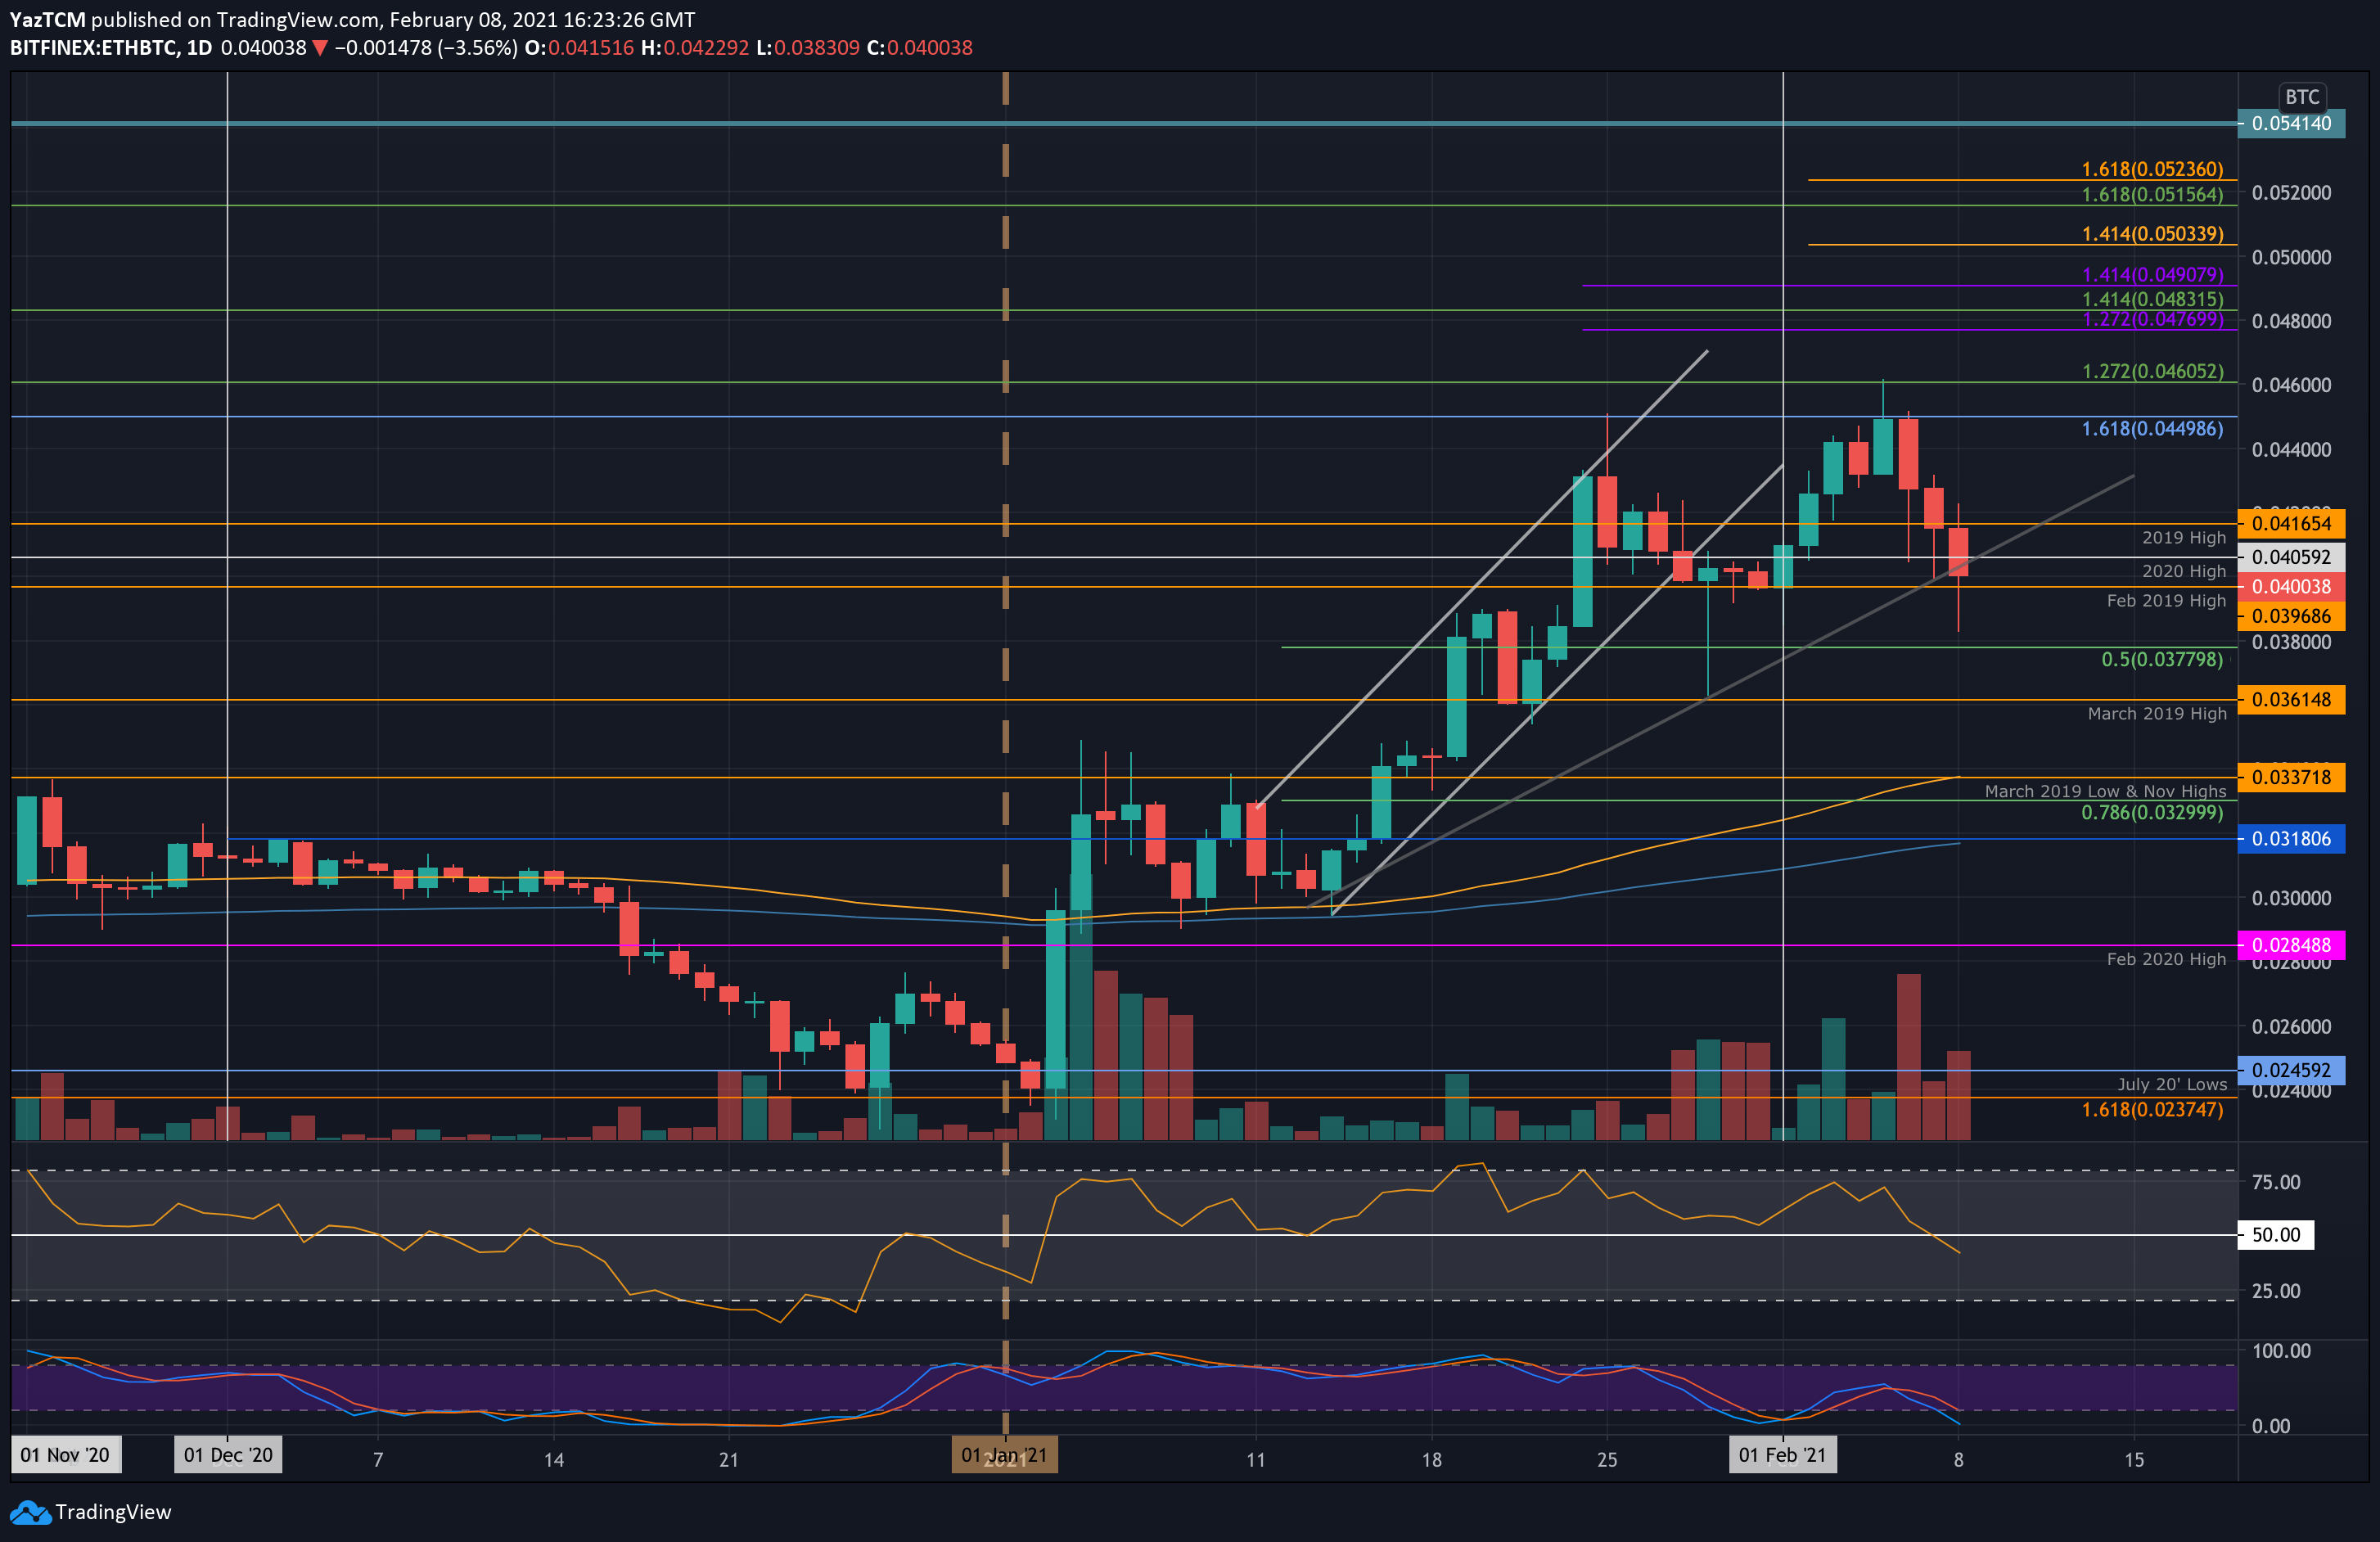
Key Support Levels: 0.04 BTC, 0.038 BTC, 0.0377 BTC.
Key Resistance Levels: 0.0416 BTC, 0.044 BTC, 0.045 BTC.
Against Bitcoin, ETH also set a new 2021 high at 0.046 BTC last week. It had met resistance at a 1.272 Fib Extension and started to head lower from there.
Yesterday, ETH spiked as low as 0.04 BTC, where it found support at an ascending trend line. It quickly rebounded and closed the daily candle at around 0.041 BTC.
Today, ETH spiked further lower, reaching as low as 0.038 BTC but has since rebounded above 0.04 BTC.
Looking ahead, the first resistance lies a 0.0416 BTC (2019 High). This is followed by 0.044 BTC, 0.045 BTC, 0.046 BTC (1.272 Fib Extension), and 0.0483 BTC (1.414 Fib Extension). Additional resistance lies at 0.049 BTC and 0.05 BTC.
On the other side, the first support lies at 0.040 BTC. This is followed by0.038BTC BTC, 0.0377 BTC (.5 Fib), and 0.0361 BTC (March 2019 High).
The daily RSI rebounded from the midline over the weekend, indicating that the bullish momentum has dropped, but the sellers are unable to take control of the market momentum. If it starts to rise further beyond 50 again, the bullish momentum will increase and push ETH higher.