Ethereum’s price is currently testing a key resistance level. A breakout from this resistance could likely lead to bullish momentum in the short term.
By: Edris
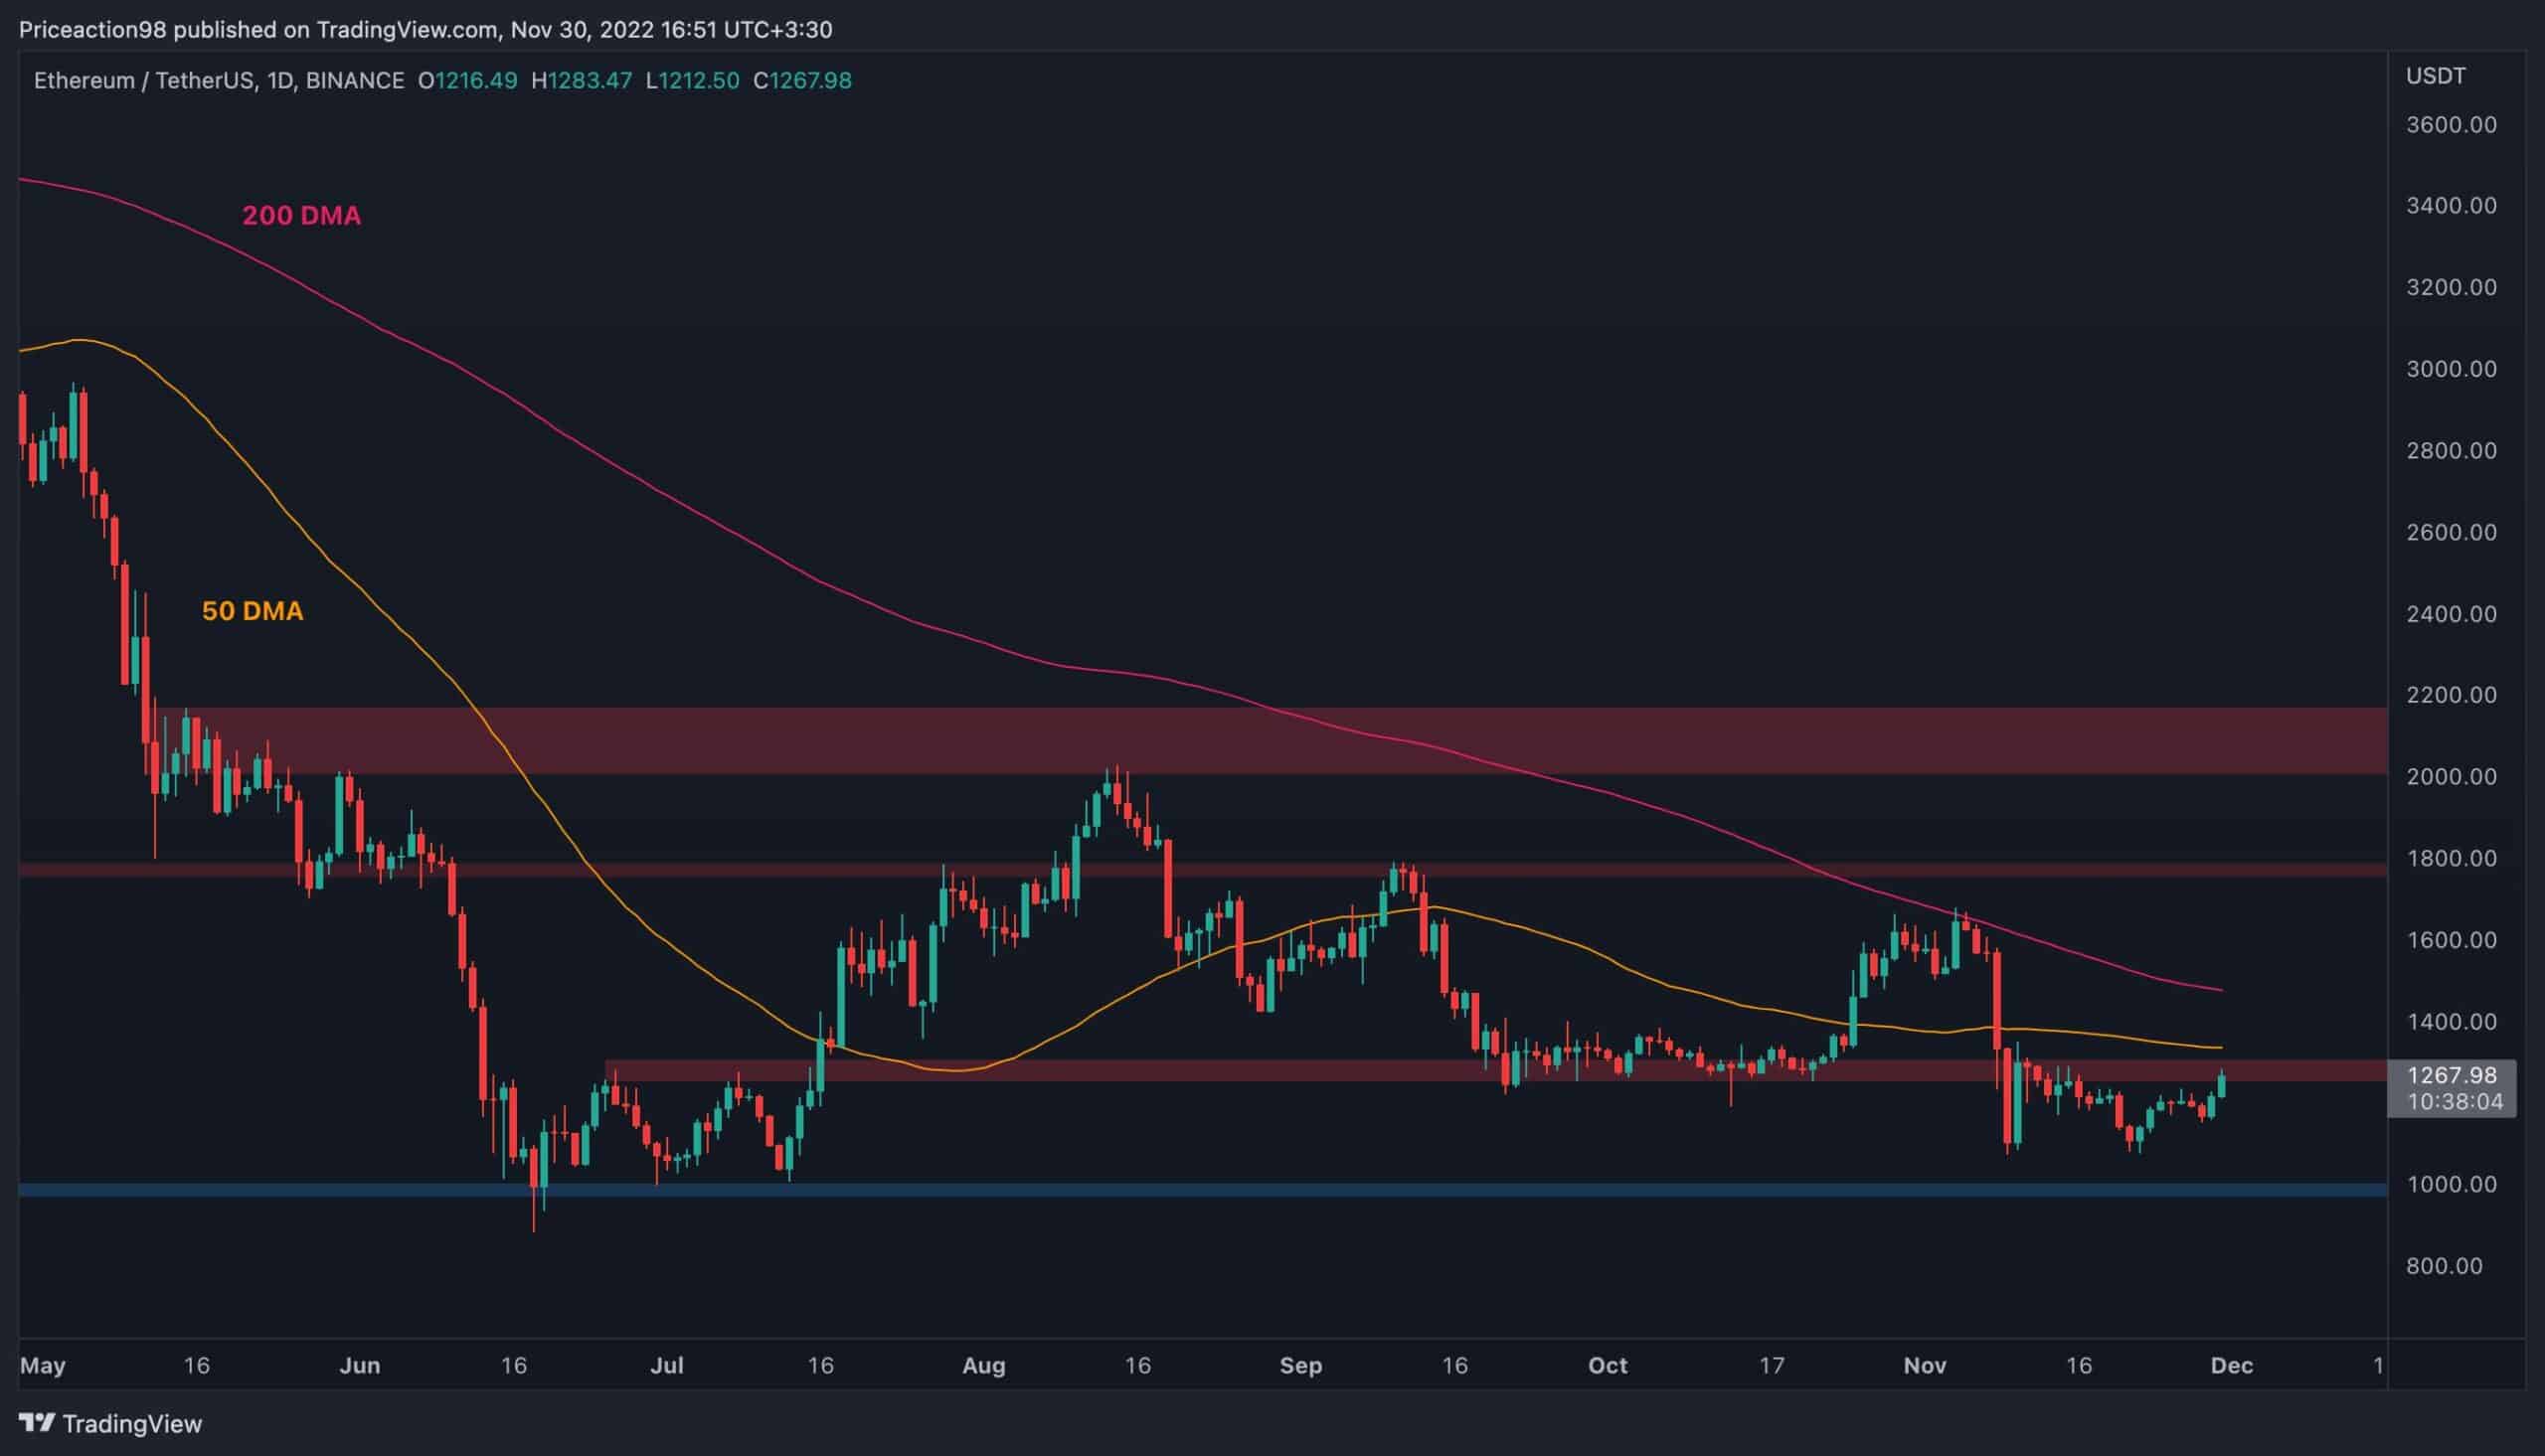
On the daily timeframe, the price has rebounded from the $1100 mark but is still entrapped between $1000 and $1250. The $1250 resistance level is currently being handled as the price is seemingly attempting to break it to the upside.
In this case, the 50-day and 200-day moving averages, located around the $1300 and $1500 levels, would be the next targets, followed by the significant $1800 static resistance level.
Conversely, if the price fails to break out and gets rejected to the downside, a decline toward the key $1000 support level would be expected.
The $1000 level, which has previously held the price in June and July on multiple occasions, remains a strong support level. If broken, a further crash would be imminent for ETH.
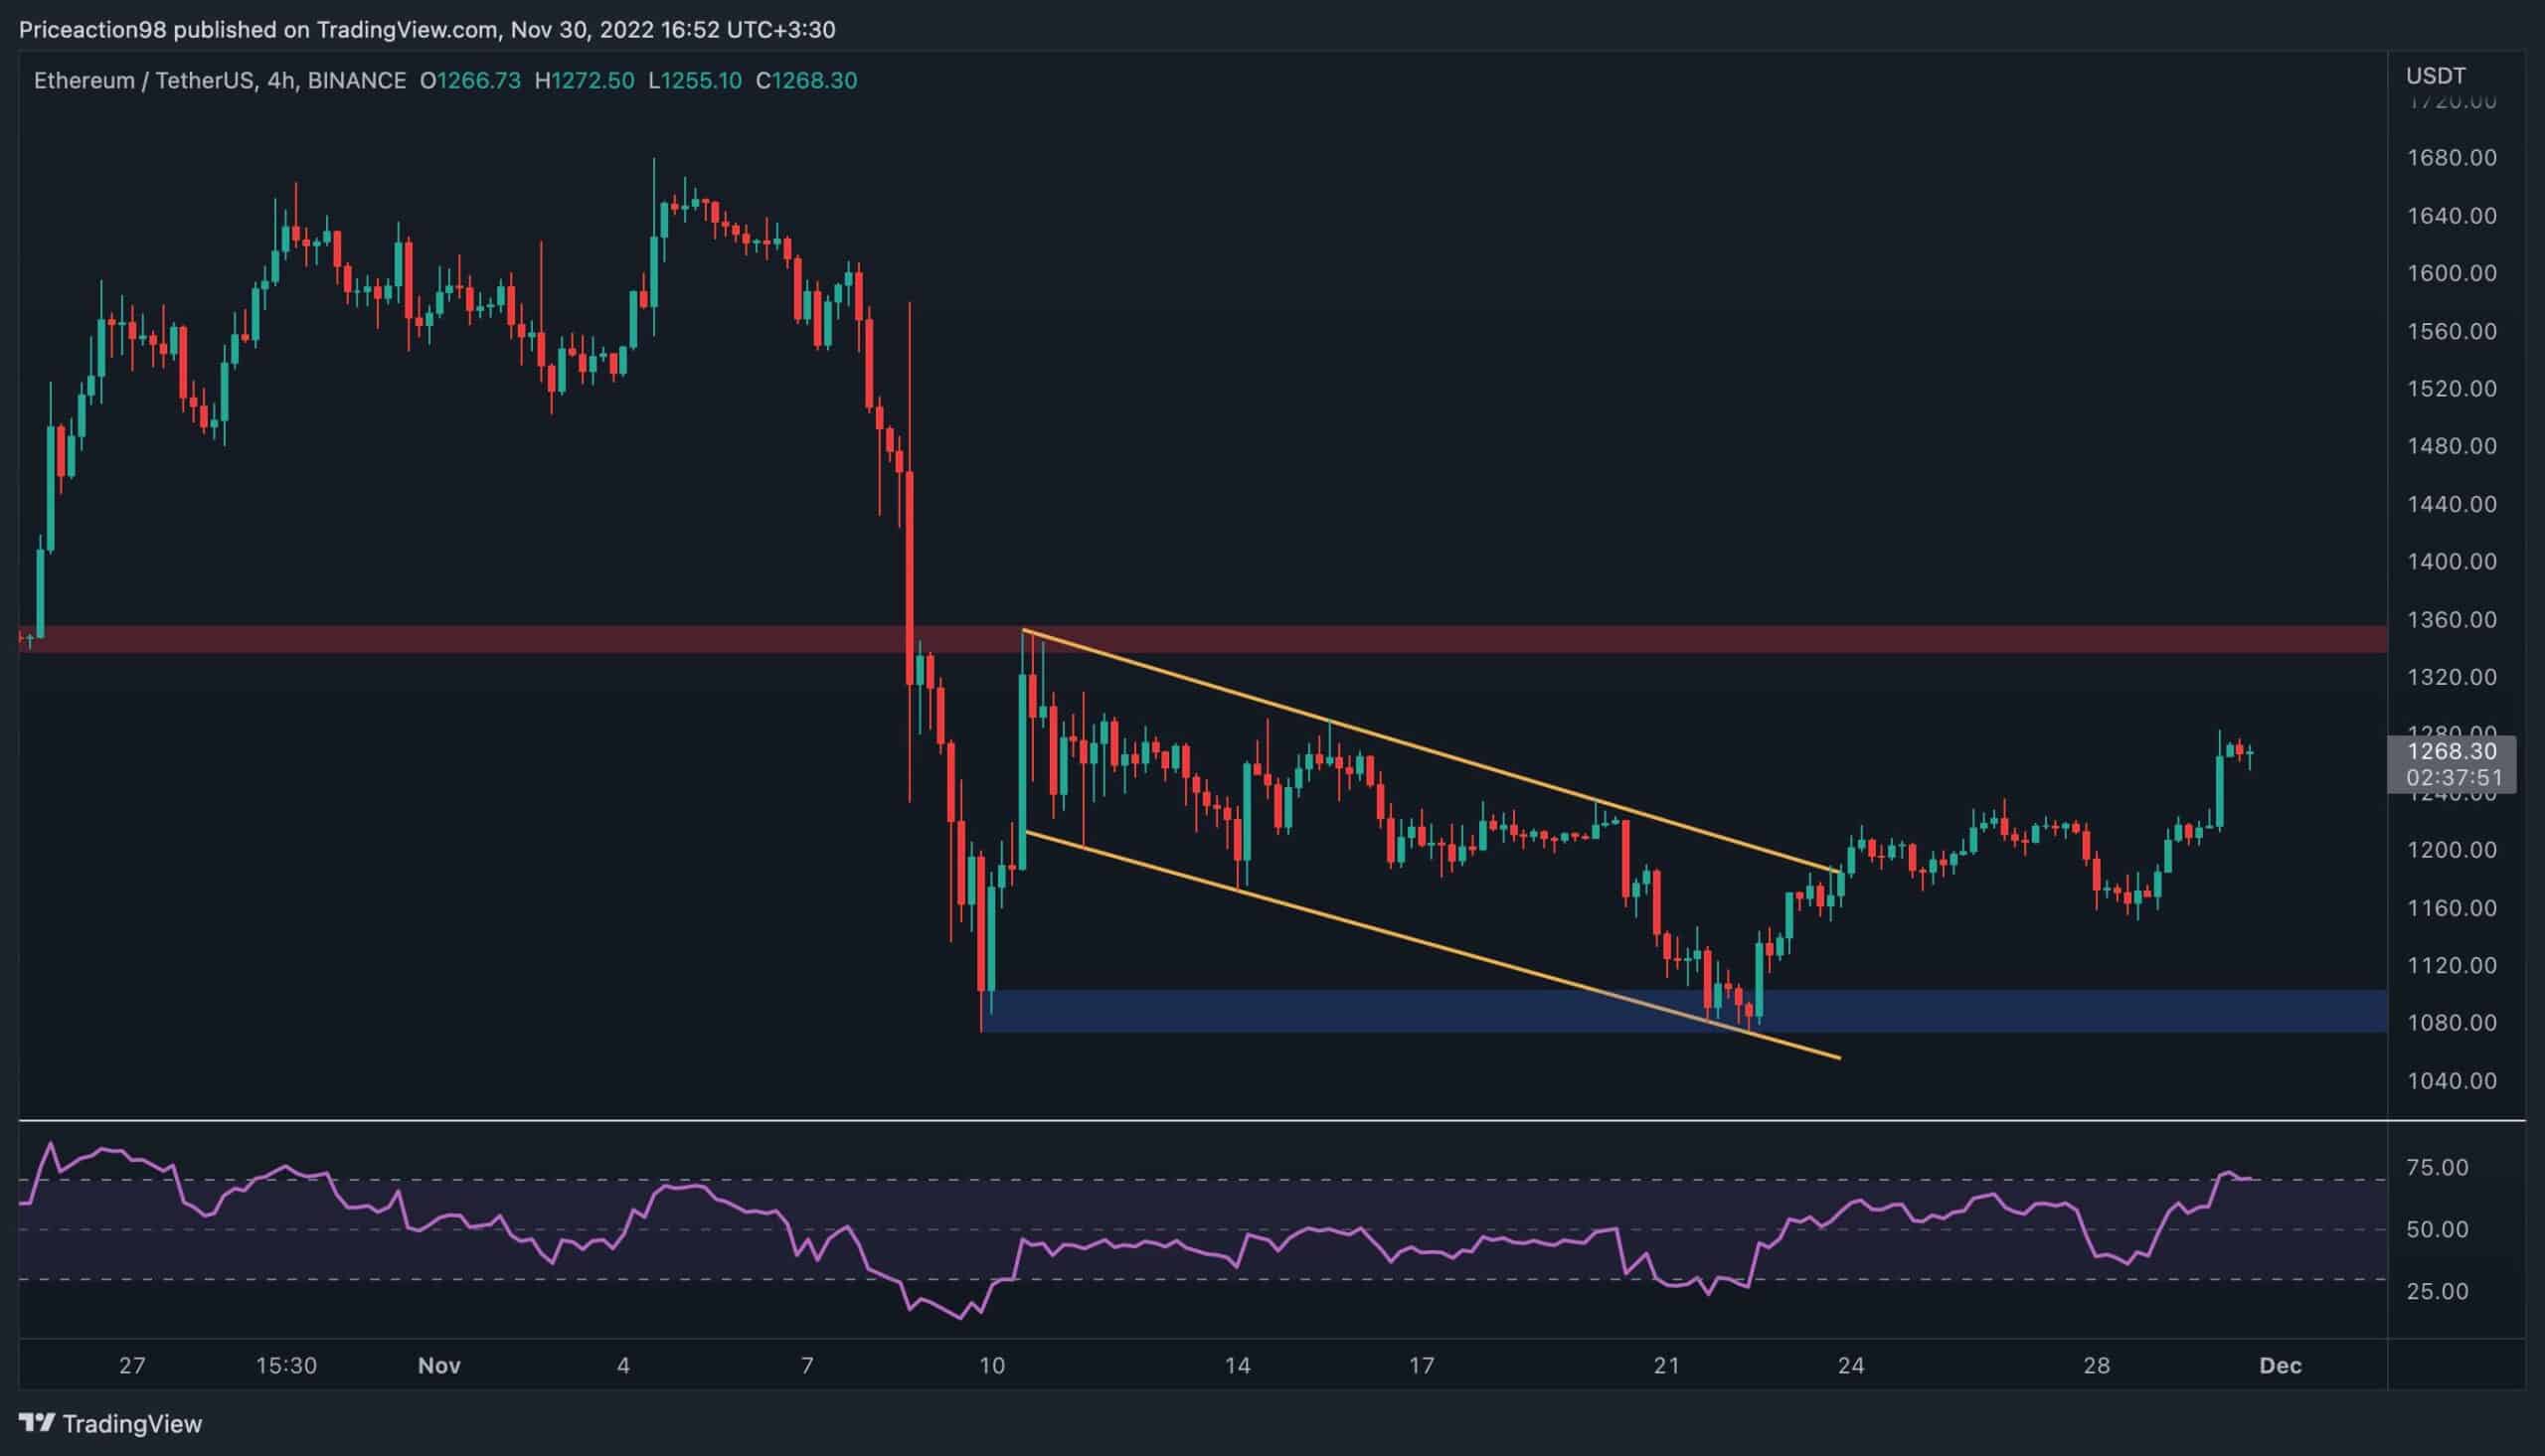
On the 4-hour chart, it is evident that the price has been in an uptrend since breaking the descending channel to the upside.
While a rally toward the $1350 resistance seems likely from a classical price action perspective, momentum indicators are starting to suggest that a pullback or reversal may occur in the short term. The RSI indicator has reached the overbought area with values above 70%, pointing to a probable correction.
While the market structure still remains bullish on this timeframe, price action must be monitored cautiously to determine whether ETH could reach the $1350 level or if a bearish reversal is a more likely outcome.
By Shayan
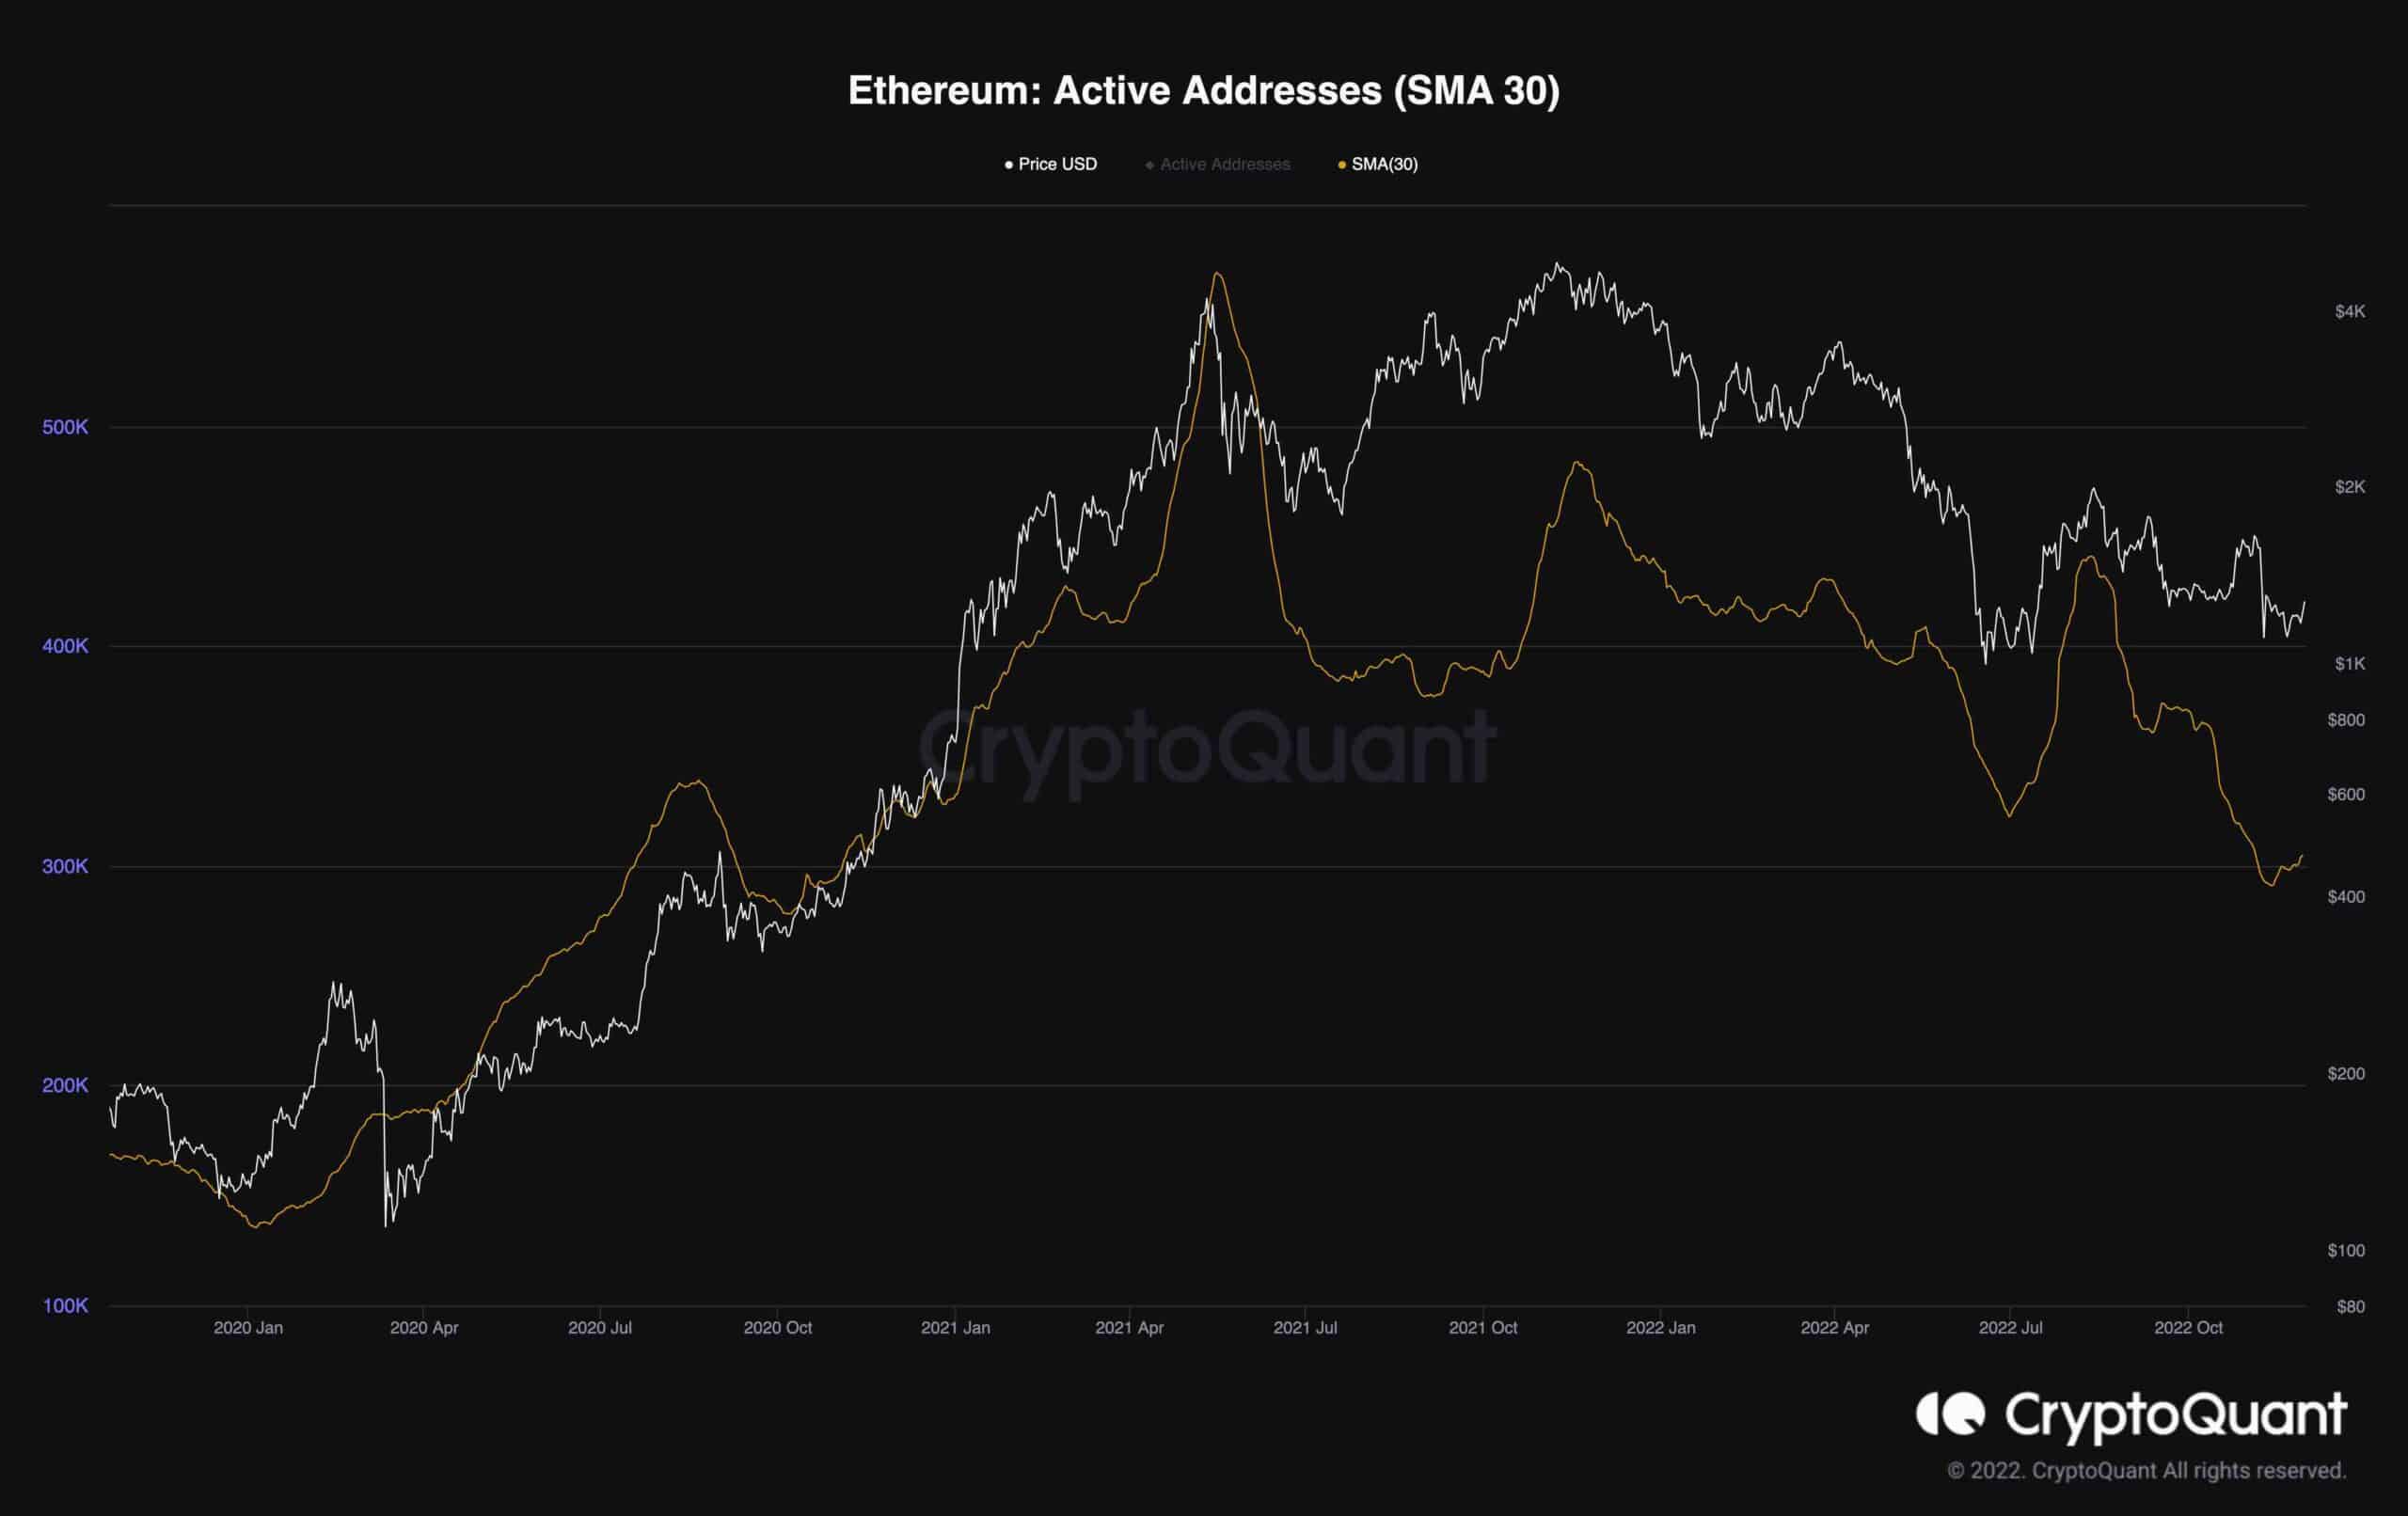
Active Addresses are one of the most valuable metrics for assessing participants’ interest in a specific network. A rise in this metric indicates an expansion in the number of users on the network and that more people are being drawn to it.
Examining the chart, its value positively correlates with Ethereum’s price. However, the metric’s 30-day moving average has been in a significant downtrend since July 2022 and dropped to a new yearly low, indicating that there may be a worrying lack of demand for the Ethereum blockchain.
This could be interpreted as a bearish sign because while one of the fundamental valuation metrics of the network is declining, the price is consolidating, and unlike Bitcoin, Ethereum hasn’t marked a new low during the recent cycle.
To conclude, a downfall and even new price lows seem possible in the short term if the number of active addresses continues to decline.