Ethereum saw a small 5% price decline over the past week and it currently trades at $173.03. The cryptocurrency continues to be supported at the $170 level but it seems that the bears are adamant to push Ethereum lower. Ethereum has lost a total of 20% over this past month, after falling from the high of $225 during September.
Ethereum remains the second-largest cryptocurrency as it holds a market cap of $18.76 billion. The good news is that ETH looks to be holding strong against BTC and we could potentially see a rebound soon.
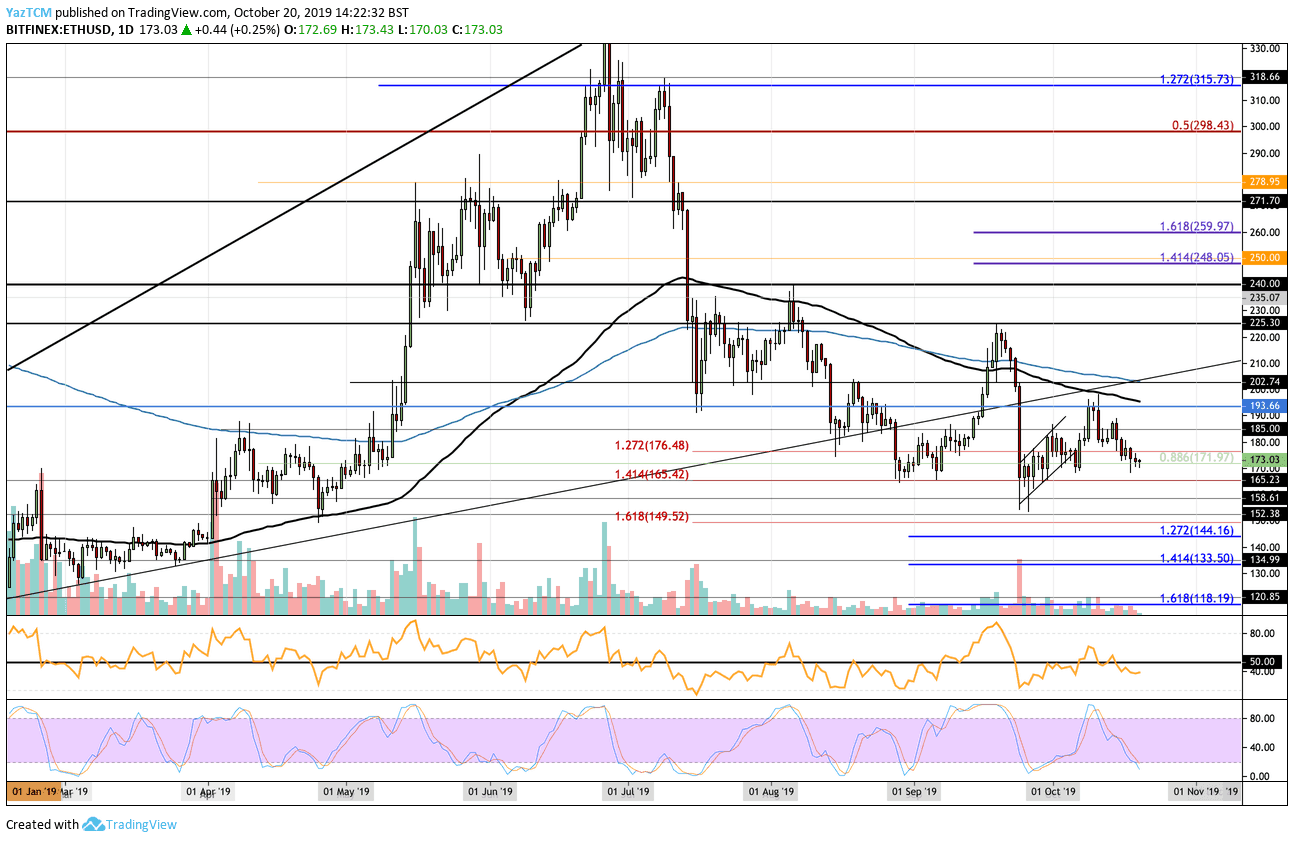
Looking at the ETH/USD 1-day chart:
- Since our previous ETH/USD analysis, the cryptocurrency fell beneath the support at $176.48 but managed to remain above the support at $171.97 (.886 Fib Retracement). The sentiment is looking pretty bearish and we can expect ETH to break beneath the current support.
- From above: The nearest level of resistance lies at $176.48. Above this, resistance lies at $185 and $194. Congestion is then to be expected between $195 and $203 due to both the 100-days EMA and 200-days EMA being located between here. Above $203, resistance lies at $210, $220, $225 (September high), and $240.
- From below: The nearest level of support beneath $171.87 lies at $165.42. Beneath this, support is found at $158.61, $152.38, and $150. Below $150, support can be found at $144.16, $140, and $133.
- The trading volume remains pretty low.
- The RSI has recently slipped beneath the 50 level which shows that the bears are taking charge of the market momentum. However, the Stocahstic RSI is reaching oversold conditions as we wait for a bullish crossover signal to send us higher.
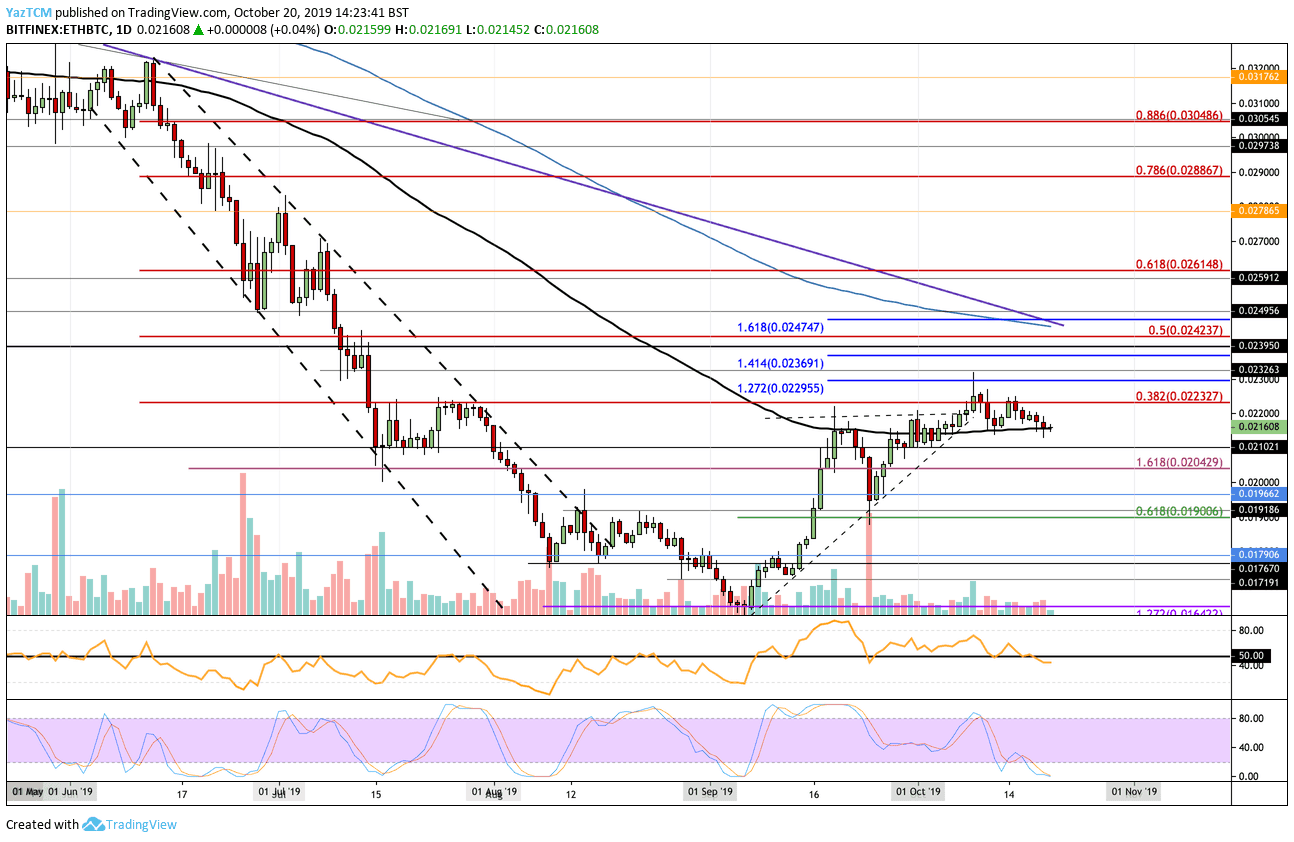
Looking at the ETH/BTC 1-day chart:
- Against BTC, ETH continued to drop after reaching the resistance at 0.02232 BTC. The coin has recently fallen into support at the 100-days EMA at around 0.0216 BTC – where it currently trades.
- From above: The nearest levels of resistance lie at 0.022 BTC and 0.02232 BTC (bearish .382 Fib Retracement). Above this, resistance is expected at 0.02295 BTC, 0.02370 BTC, and 0.02423 BTC (bearish .5 Fibonacci Retracement).
- From below: The nearest level of support beneath the 100-days EMA lies at 0.0021 BTC. Further support can be expected at 0.0204 BTC, 0.020 BTC, 0.0195 BTC, and 0.019 BTC.
- The trading volume remains low, but at the average level for October 2019.
- The Stocahstic RSI is in extreme oversold conditions and is primed for a bullish crossover signal to send the market higher.
SPECIAL OFFER (Sponsored)
Binance Free $600 (CryptoPotato Exclusive): Use this link to register new account and receive $600 exclusive welcome offer on Binance (
full details).
LIMITED OFFER 2024 for CryptoPotato readers at Bybit: Use this link to register and open a $500 BTC-USDT position on Bybit Exchange for free!
Disclaimer: Information found on CryptoPotato is those of writers quoted. It does not represent the opinions of CryptoPotato on whether to buy, sell, or hold any investments. You are advised to conduct your own research before making any investment decisions. Use provided information at your own risk. See Disclaimer for more information.
Cryptocurrency charts by TradingView.