Since our last price analysis, the whole market has seen a short free fall. We did notice the triangle’s breakout, but, it wasn’t a bullish one.
Bitcoin broke the triangle formation to the lower side (4 hours chart) but is still holding inside the borders of the descending triangle formation that has been developing since somewhere around April 2018.
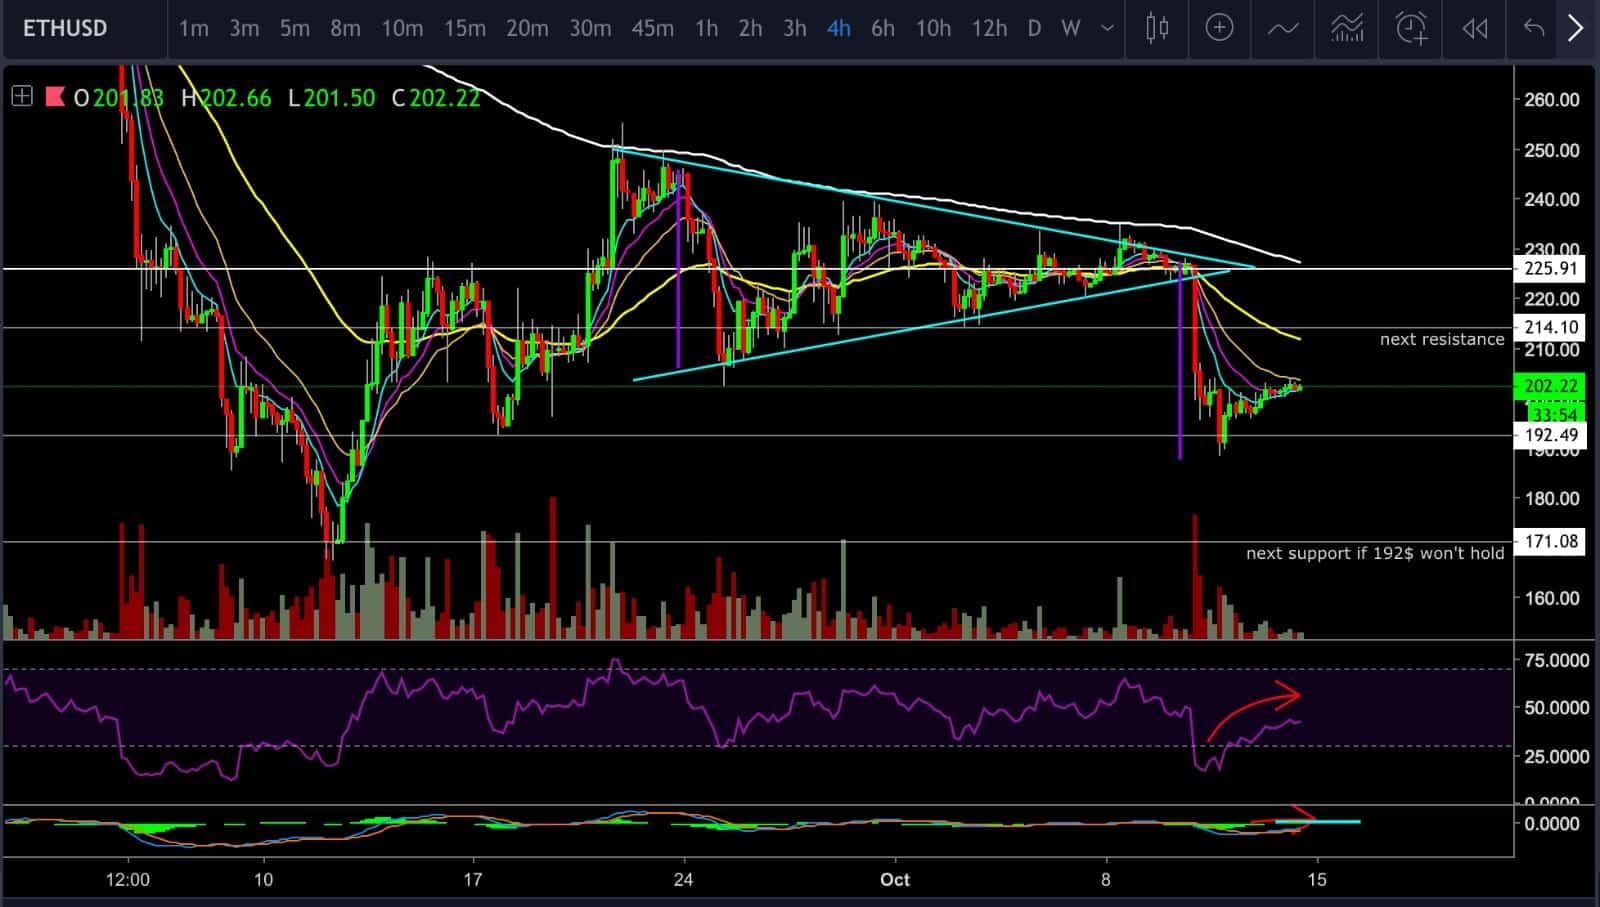
Ethereum suffered from a massive dump of almost 16% as the formation broke and got supported on the $192 price level, which is exactly the formation’s target. The downward move from the apex of the triangle took a five waves structure, and since then has managed to correct upward around 5%.
– In our previous ETH price analysis, we expected the breakout to take place in the next few days, and we marked the breakout below $214 as a bearish sign. That is precisely what we have got; ETH broke the $214 level with a big long red candle – followed by high volume.
– If the bulls manage to push the price higher, they will find the next support-turned resistance at the $214 level. This turned to be a critical price level and where the 55 EMA is currently located.
– On the contrary, if ETH continues downward, it is likely to re-test the $192 support level and a break down at that level will have a lower target at around $170 support level.
– RSI is currently back up at the 43 level after being severely oversold, but it seems as if the momentum of this
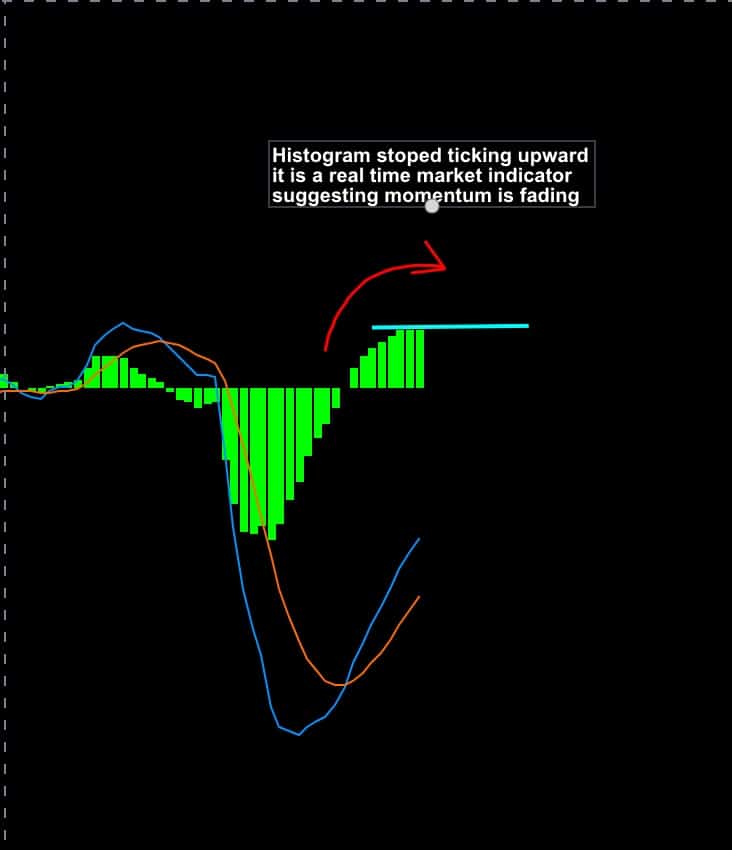
– The MACD histogram is also creating a negative parabolic shape and has stopped ticking higher, which suggests that the current mini uptrend might not hold for long.
– A brief look at the 1-hour chart shows that ETH currently has a resistance from the 55 EMA and the MACD histogram is ticking downward – which is a bearish signal.
As much as we want to be and feel bullish, we are 100% obligated to the technical analysis and to the signals we get from the charts in real-time.
Cryptocurrency charts by TradingView. Technical analysis tools by Coinigy.