Ethereum
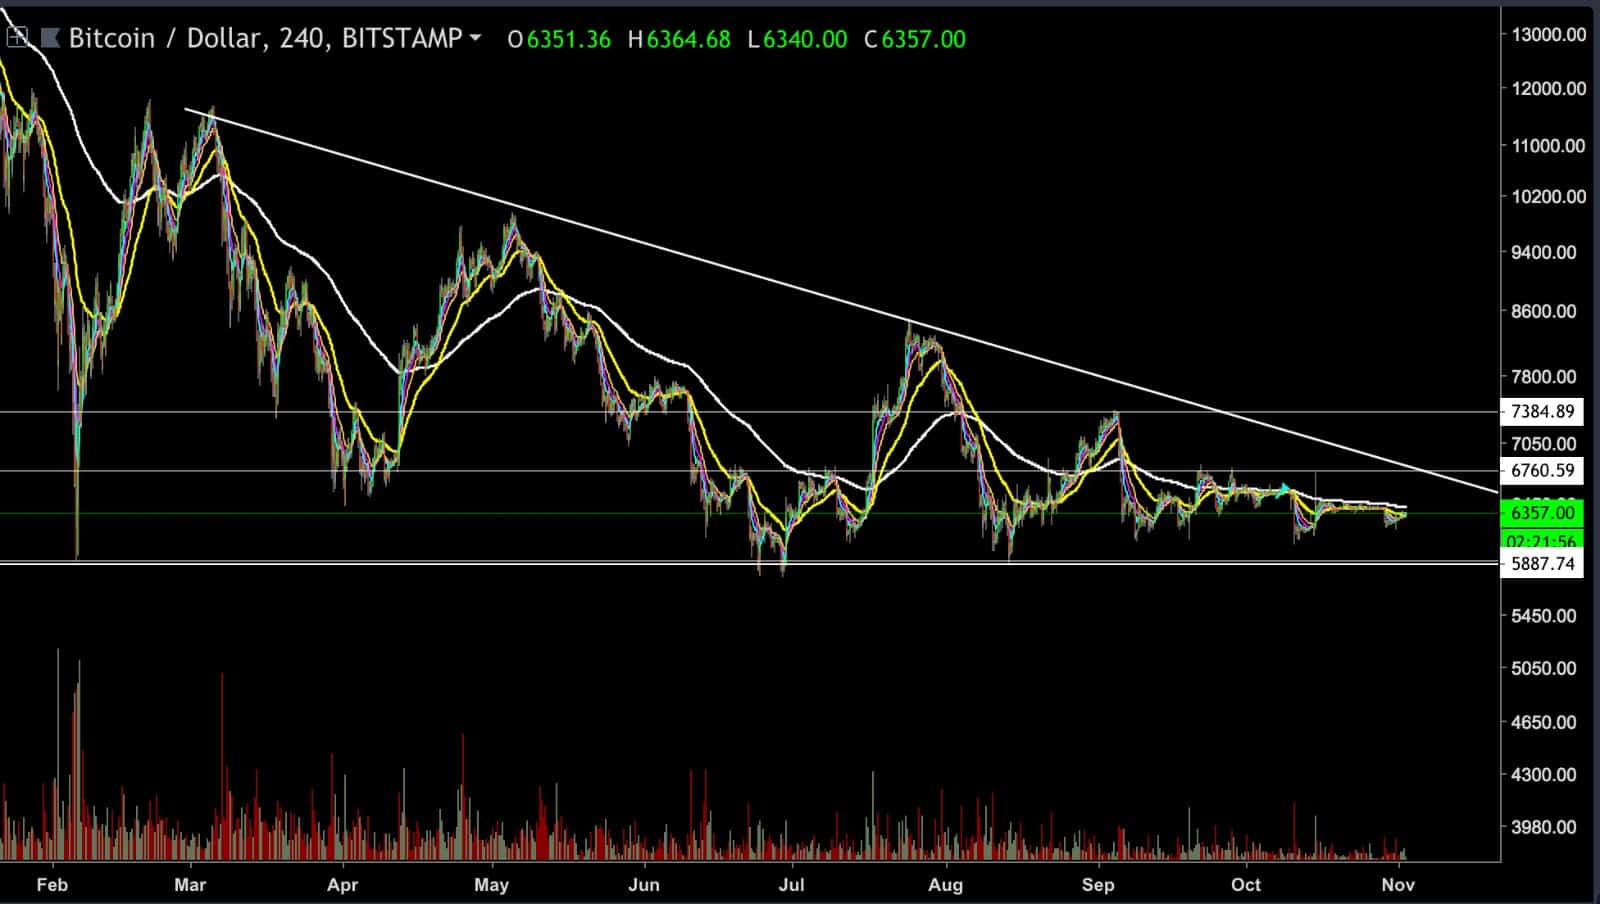
The BTC chart is currently trading in the middle part of the triangle formation from the daily chart.
This descending triangle or falling wedge formation (depending on your personal viewpoint) is the leading formation in the crypto market at the moment, and the break out of this formation will determine the market’s next direction.
The alt coins arena has been pretty hot lately with moves of 25-50% and a lot of risky opportunities to take advantage of.
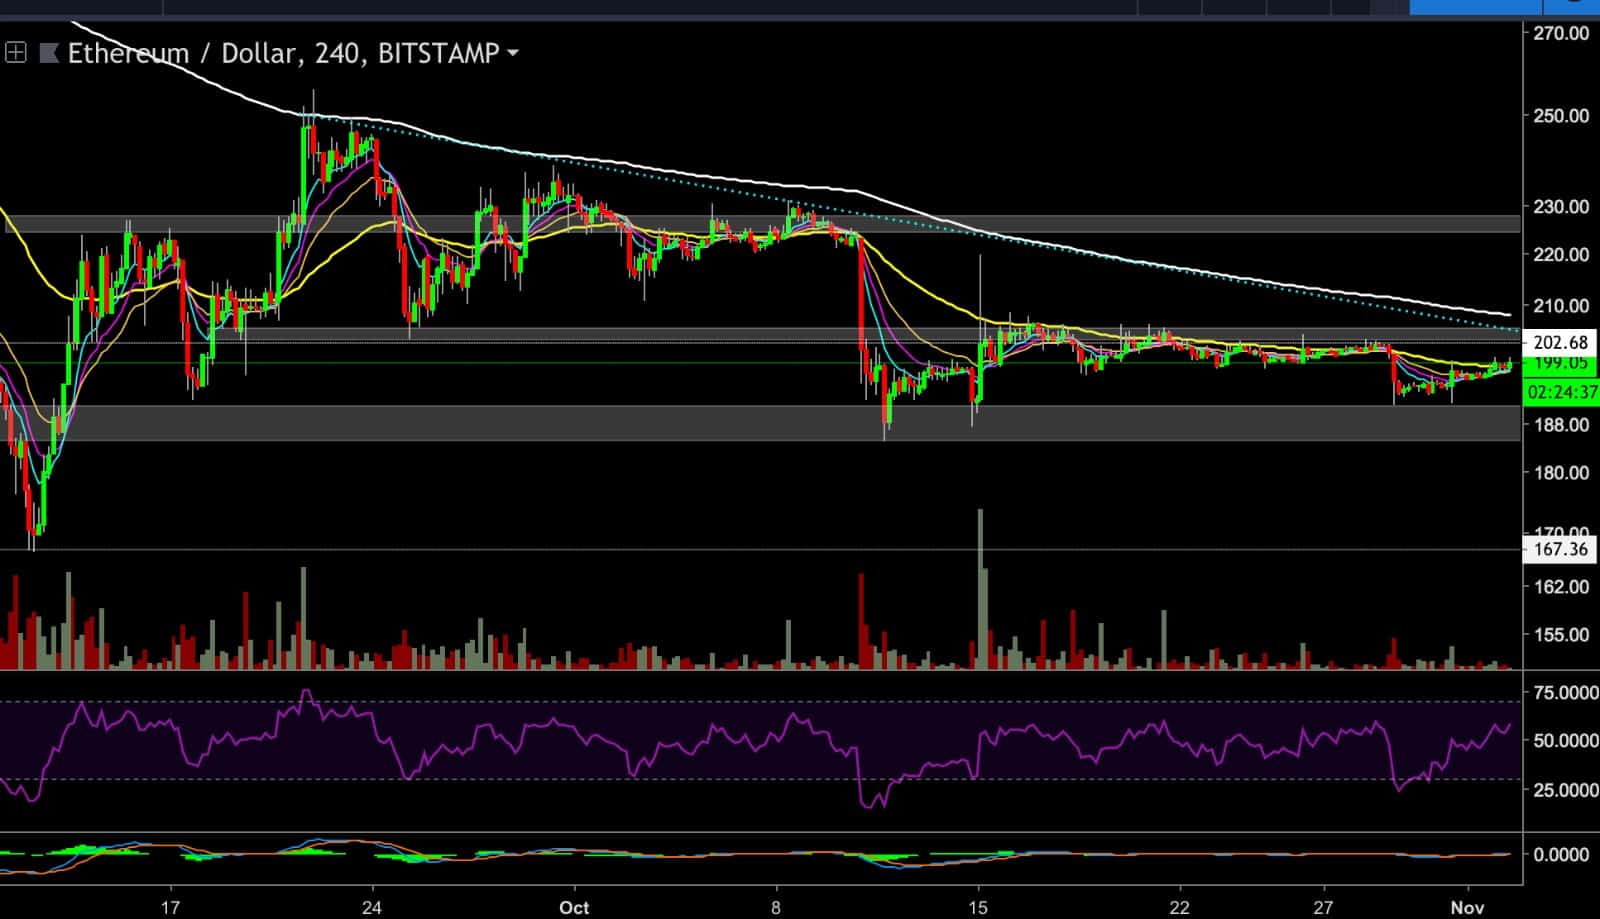
ETH wasn’t the most active coin; it has been trading in the $205 – $190 channel for 3 weeks now.
-It is very likely that the bulls will try to attack the $205 resistance level for the 4th time ( since the inception of this channel).
– If the bulls manage to break above the resistance level, then ETH will have to fight the 200 EMA and the downtrend line from the daily chart (blue) at the $208 area, and it won’t be an easy fight to win. If the bulls manage to climb above the daily trend line and the 200 EMA, then the next target might be at the $223 price level.
– On the other hand, if the bears take over, there will probably be another decline towards the lower side of the channel at the 192$ support level.
– RSI is currently climbing nicely. Looking at the lower time frames, the RSI is already getting very close to the over-bought regions.
-The ETH chart is currently getting supported by the 55 EMA and the smaller group of EMAs which gives ETH the strength to try the resistance level one more time.
Cryptocurrency charts by TradingView. Technical analysis tools by Coinigy.