Ethereum has seen a rebound over the past 24 hours which amounts to positive 3.78 percent, allowing its price to climb back above $250 where it currently trades at $251. Ethereum has now seen a 42% price surge over the past 30 days with a further 68% increase over the past 90 days.
Ethereum currently holds a market cap value of $26.63 billion which puts it in second place amongst the top cryptocurrencies.
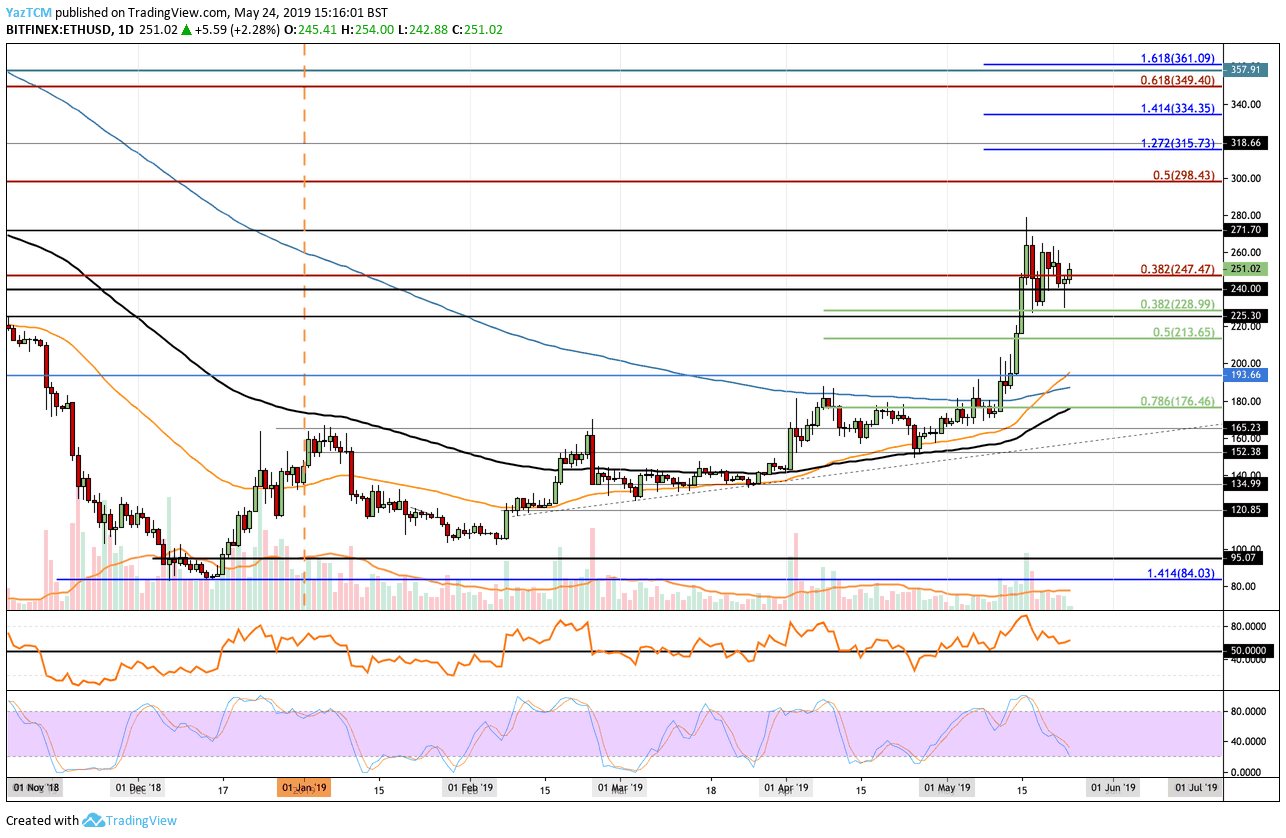
Looking at the ETH/USD 1-Day Chart:
- Since our previous ETH/USD analysis, we can see that ETH/USD had spiked lower into the highlighted support at $228, once again, before rebounding back above $250.
- From above: The nearest level of resistance now lies at $271 and $280. Above $280, further resistance lies between $298 – $300. The resistance at $300 is strengthened by the bearish .5 Fibonacci Retracement level (marked in red) located at $298. Above $300, further resistance lies at $315, $334 and $349.
- From below: The nearest level of support now lies at $250. Beneath $250, further support lies at $240 and $228. Below $228 support lies at $213 and $200.
- The Stochastic RSI has recently approached overbought conditions. We will watch for the crossover above to provide a bullish signal higher.
- The trading volume has started to slowly increase back toward the May 2019 average.
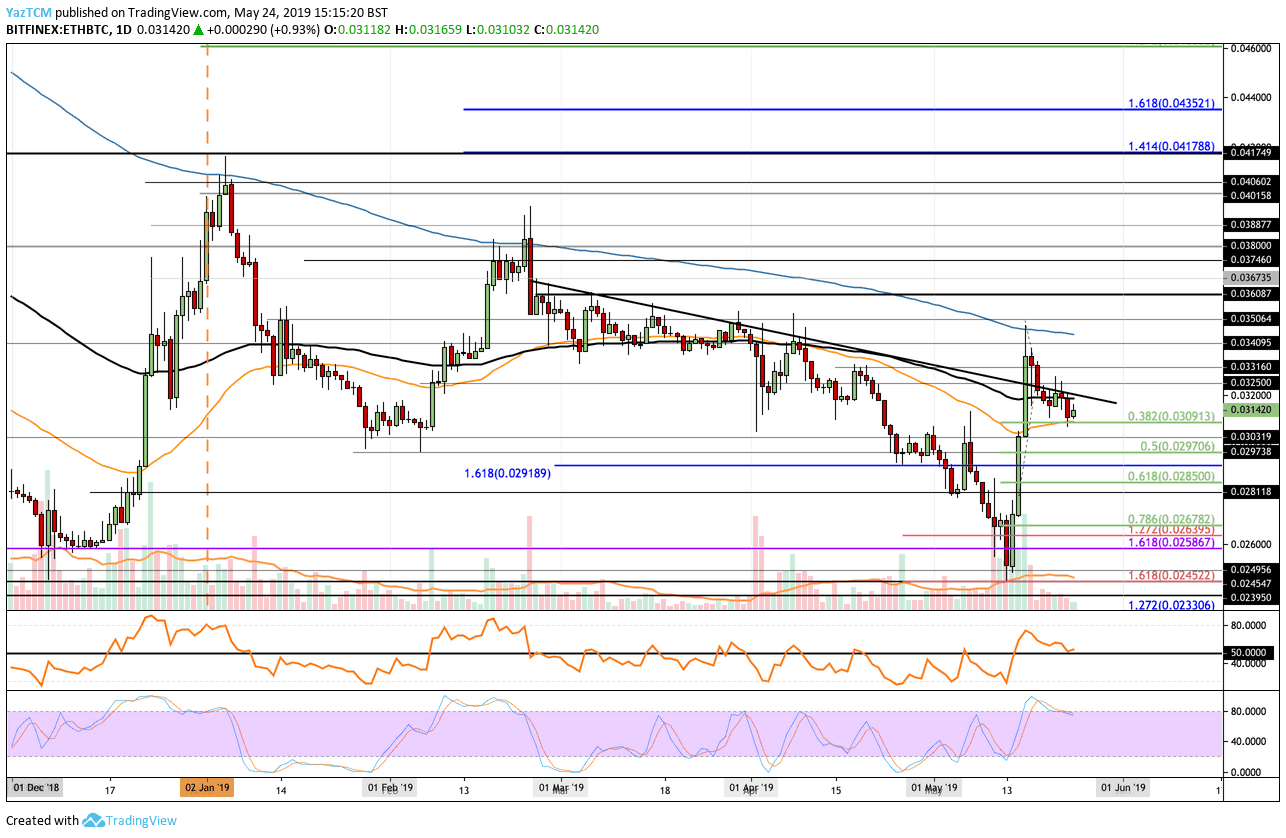
Looking at the ETH/BTC 1-Day Chart:
- Against Bitcoin, we can see that ETH/BTC continues to hold the support around the 0.0309 BTC level and has rebounded higher to where it currently trades at around 0.03142 BTC.
- From above: The nearest level of resistance now lies at 0.032 BTC which contains the 100-day moving average Above this, higher resistance is then expected at 0.0325 BTC, 0.03316 BTC, 0.034 BTC, and 0.035 BTC.
- From below: The nearest level of support now lies at 0.030 BTC. Beneath 0.03 BTC, further support lies at 0.02970 BTC, 0.02918 BTC, 0.0285 BTC and 0.028 BTC.
- The trading volume still remains far below the average in May 2019.
- The Stochastic RSI warns traders to be cautious as it trades in overbought conditions. A crossover below would signal a push lower.
SPECIAL OFFER (Sponsored)
LIMITED OFFER 2024 for CryptoPotato readers at Bybit: Use this link to register and open a $500 BTC-USDT position on Bybit Exchange for free!
Disclaimer: Information found on CryptoPotato is those of writers quoted. It does not represent the opinions of CryptoPotato on whether to buy, sell, or hold any investments. You are advised to conduct your own research before making any investment decisions. Use provided information at your own risk. See Disclaimer for more information.
Cryptocurrency charts by TradingView.