Ethereum has seen a rollercoaster of price swings over the past couple of days as the coin was able to break above the $200 level for the first time since November 2018. However, the cryptocurrency was unable to sustain above the $200 level and has dropped back below by a total of -4.45% over the past 24 hours. ETH is currently trading around $185.55.
Ethereum remains ranked in 2nd place amongst the top cryptocurrency projects by market cap value as it presently holds a $19.55 billion market cap.
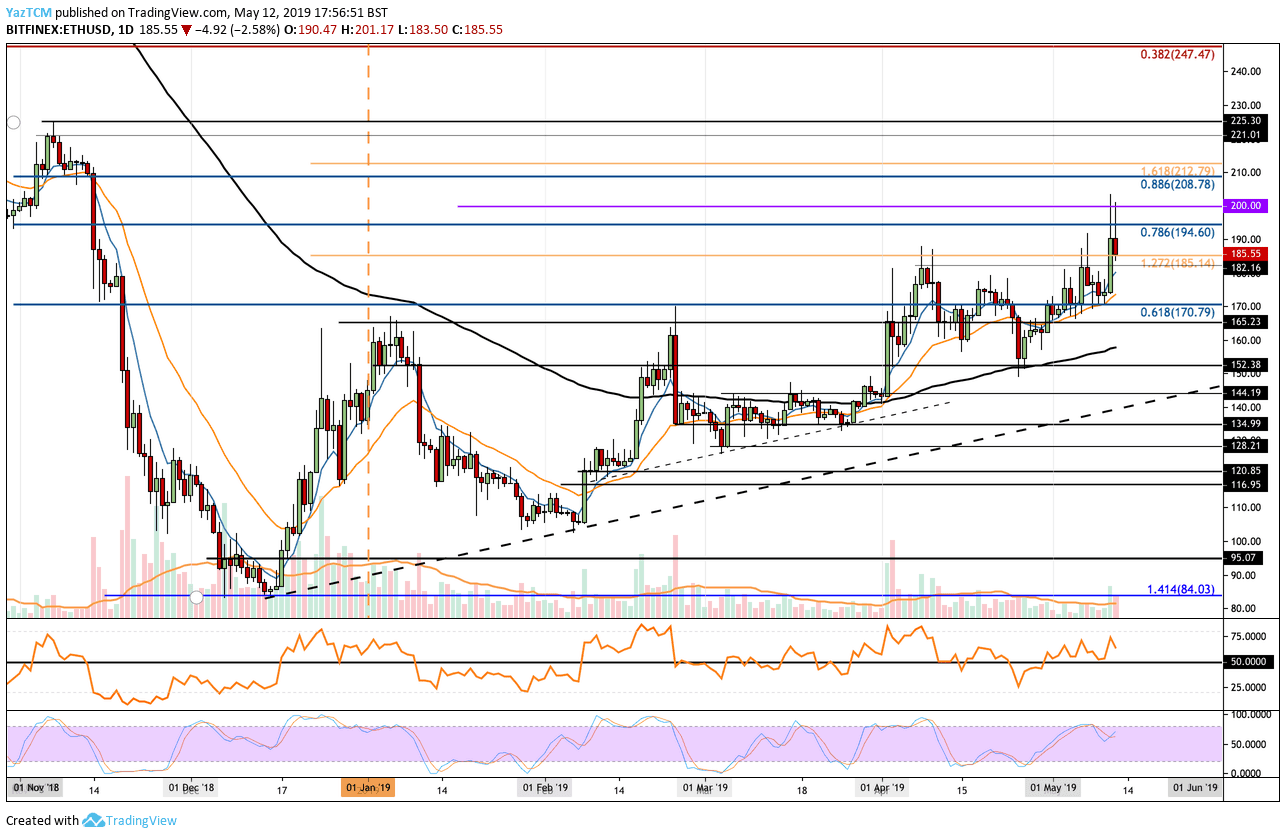
Looking at the ETH/USD 1-Day Chart:
- Since our previous ETH/USD analysis, we can see that ETH/USD had managed to break above the strong resistance at the $185 level and climb further higher above the $200 level. However, we can see ETH/USD has dropped back below $200 and is now trading at the previous $185 resistance level which should now act as strong support.
- From above: The nearest level of resistance now lies at $194.60 and $200. If the buyers continue above $200, further resistance lies at $208, $212 and $221.
- From below: The nearest level of strong support now lies at $185. Further support then lies at $180, $170, $165 and $160. The support at $160 is further increased by the 100-days moving average line.
- The trading volume has seen a recent surge over the past two days.
- The RSI remains above 50 which indicates that the bulls are still in control of the momentum. However, if the RSI falls beneath 50 on the retracement, Bitcoin could fall back toward $160.
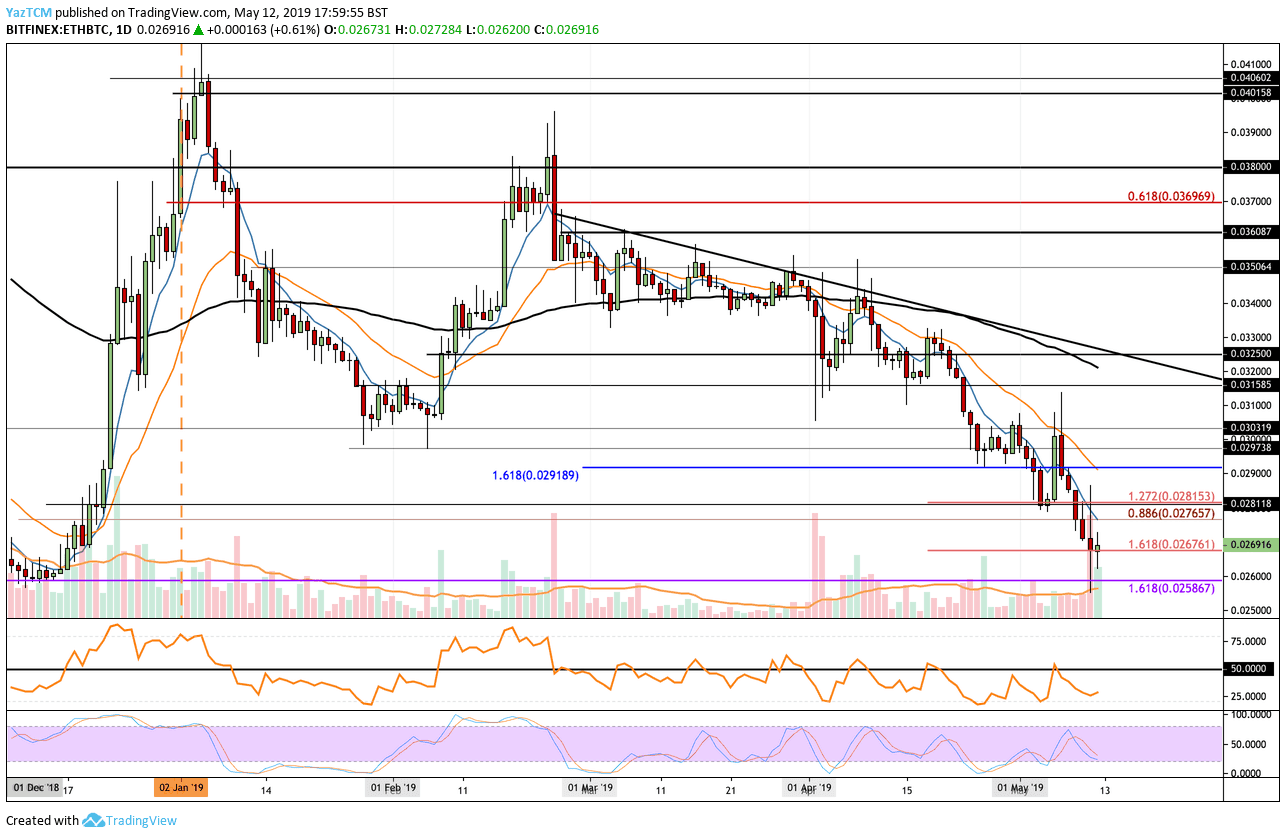
Looking at the ETH/BTC 1-Day Chart:
- Following our previous ETH/BTC analysis, we can see after a short rebound, ETH/BTC crashed below the previous support at 0.02815 BTC and continued further below into our highlighted support at 0.0267 BTC. This level of support is provided by a downside 1.618 FIbonacci Extension level (marked in orange).
- From above: The nearest level of resistance now lies at 0.0276 BTC and 0.028 BTC. Further resistance lies at 0.029 BTC and 0.030 BTC.
- From below: The nearest level of support now lies at 0.02676 BTC. Below lies the significant 0.02586 BTC level. This level had provided strong support for the market during the 2017 bull-run and is therefore expected to provide strong support moving forward.
- The RSI continues to remain beneath the 50 level. For a recovery in ETH/BTC, we would need to see the RSI rise and break back above 50.
SPECIAL OFFER (Sponsored)
LIMITED OFFER 2024 for CryptoPotato readers at Bybit: Use this link to register and open a $500 BTC-USDT position on Bybit Exchange for free!
Disclaimer: Information found on CryptoPotato is those of writers quoted. It does not represent the opinions of CryptoPotato on whether to buy, sell, or hold any investments. You are advised to conduct your own research before making any investment decisions. Use provided information at your own risk. See Disclaimer for more information.
Cryptocurrency charts by TradingView.