Ethereum has continued to remain under consolidation as the coin trades within the formation of a triangle, both against the USD and BTC. The market has dropped by 6% over the past 30 days as an ETH trades around $138.
Ethereum remains ranked in second position as the 4 years old project now holds a $14.46 billion market cap valuation.
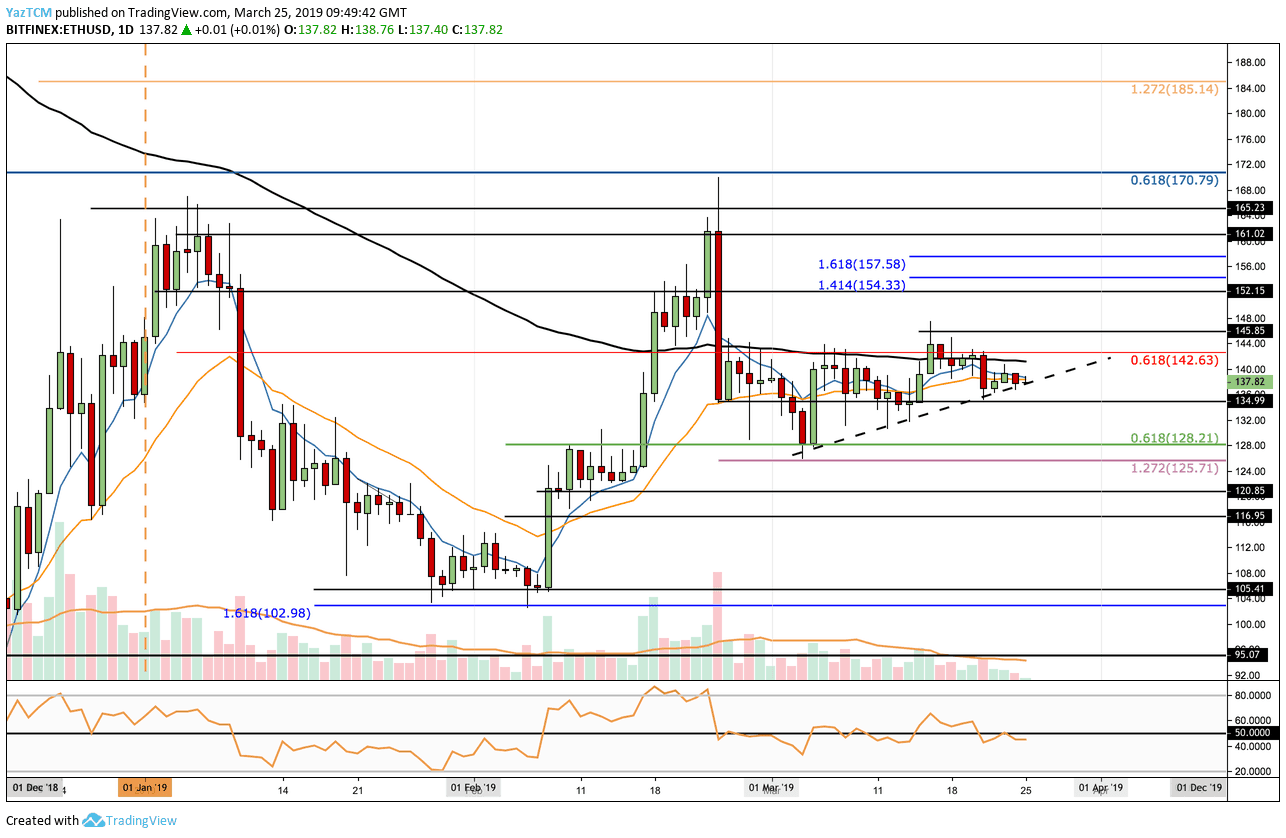
Looking at the ETH/USD 1-Day Chart:
- Since our previous ETH/USD analysis, we can see that the coin has continued to move sideways. The market has now established somewhat of an ascending triangle formation as the coin continues to consolidate. We can see the market is currently trading at the rising trend line of the triangle. The next move of the market will be essential to establish if Ethereum will break below or manage to stay up within the boundaries.
- From above: The nearest level of resistance lies at the upper boundary of the triangle at $143. Above this, we can expect further resistance at $152, and $157. If the bulls can overcome $160, higher resistance is located at $165 and $170.
- From below: If the coin falls breaks down the triangle formation, we can expect immediate support retest at $135. Below lies $130, and further support lies at $128 which contains the short term .618 Fibonacci Retracement level. Further support beneath $128 lies at $125, $120 and $116.
- The RSI remains along the 50 levels as the market seems steady undecided.
- The trading volume has remained consistently low during March 2019.
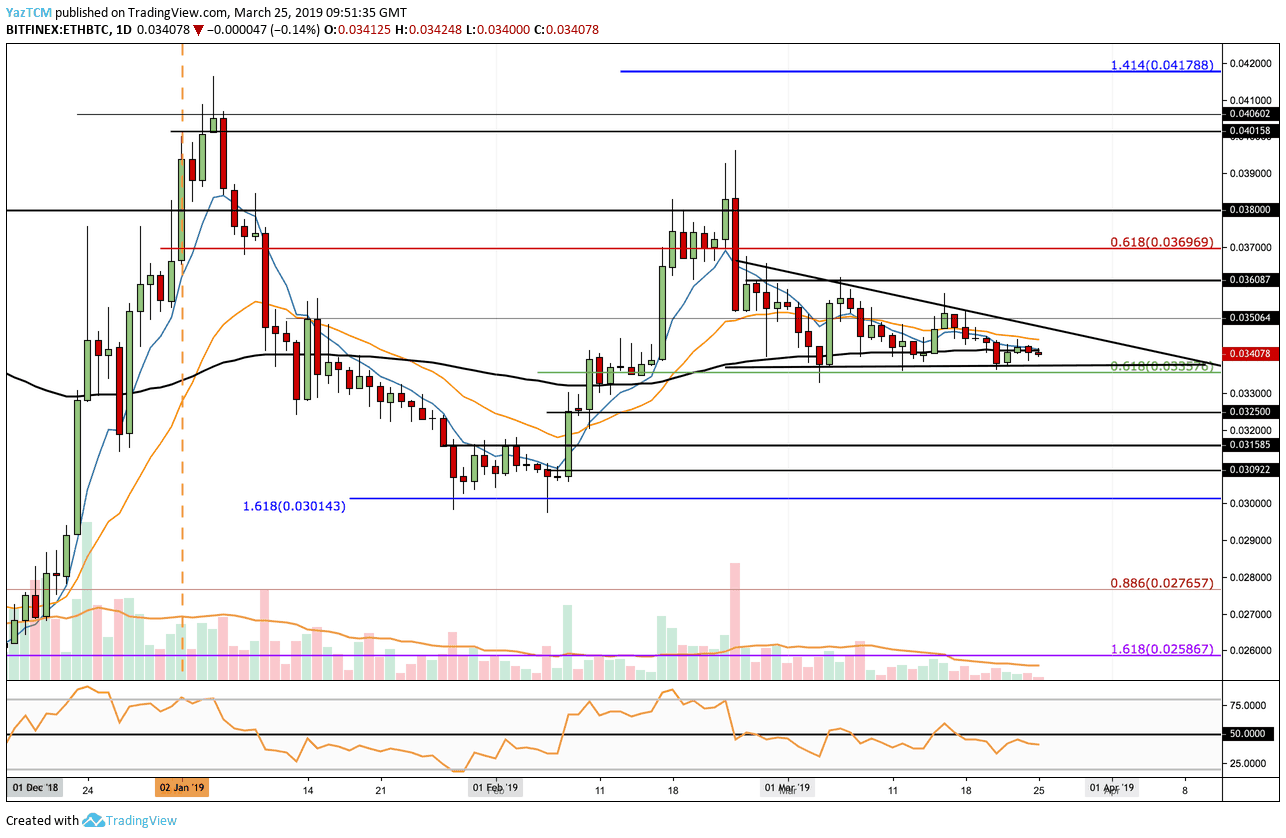
Looking at the ETH/BTC 1-Day Chart:
- Following our previous analysis we can see that the coin has continued its sideways action against Bitcoin as well. Unlike the ETH/USD market, the ETH/BTC market has been forming a descending triangle and has been trading within its boundaries for the entirety period of March 2019.
- From above: The nearest level of resistance lies at the upper boundary of the triangle. If the bulls break up the triangle, more resistance lies at 0.035 BTC and 0.036 BTC. Further resistance lies at 0.03696 BTC at the bearish .618 Fibonacci Retracement level. This is then followed with more resistance at 0.038 BTC and 0.040 BTC.
- From below: The nearest support lies at the lower boundary of the triangle. If the sellers break beneath the triangle, support lies at 0.00325 BTC and 0.03185 BTC.
- The RSI is trading slightly below the 50 level as the bears take slight control of the market momentum. If we would like to see a positive breakout, we would need the RSI to rise above the 50 level and continue higher.
- The trading volume has remained significantly lower than average during March 2019.
SPECIAL OFFER (Sponsored)
LIMITED OFFER 2024 for CryptoPotato readers at Bybit: Use this link to register and open a $500 BTC-USDT position on Bybit Exchange for free!
Disclaimer: Information found on CryptoPotato is those of writers quoted. It does not represent the opinions of CryptoPotato on whether to buy, sell, or hold any investments. You are advised to conduct your own research before making any investment decisions. Use provided information at your own risk. See Disclaimer for more information.
Cryptocurrency charts by TradingView.