Despite the fact that ETH may have seen a slight price decline over the past seven days, the market is still up by roughly 50% over the past 90 days. Ethereum is currently trading for $133 as the upside remains on hold until ETH/USD would overcome the significant resistance of $142.
ETH is the second largest crypto following a $14 billion current market cap.
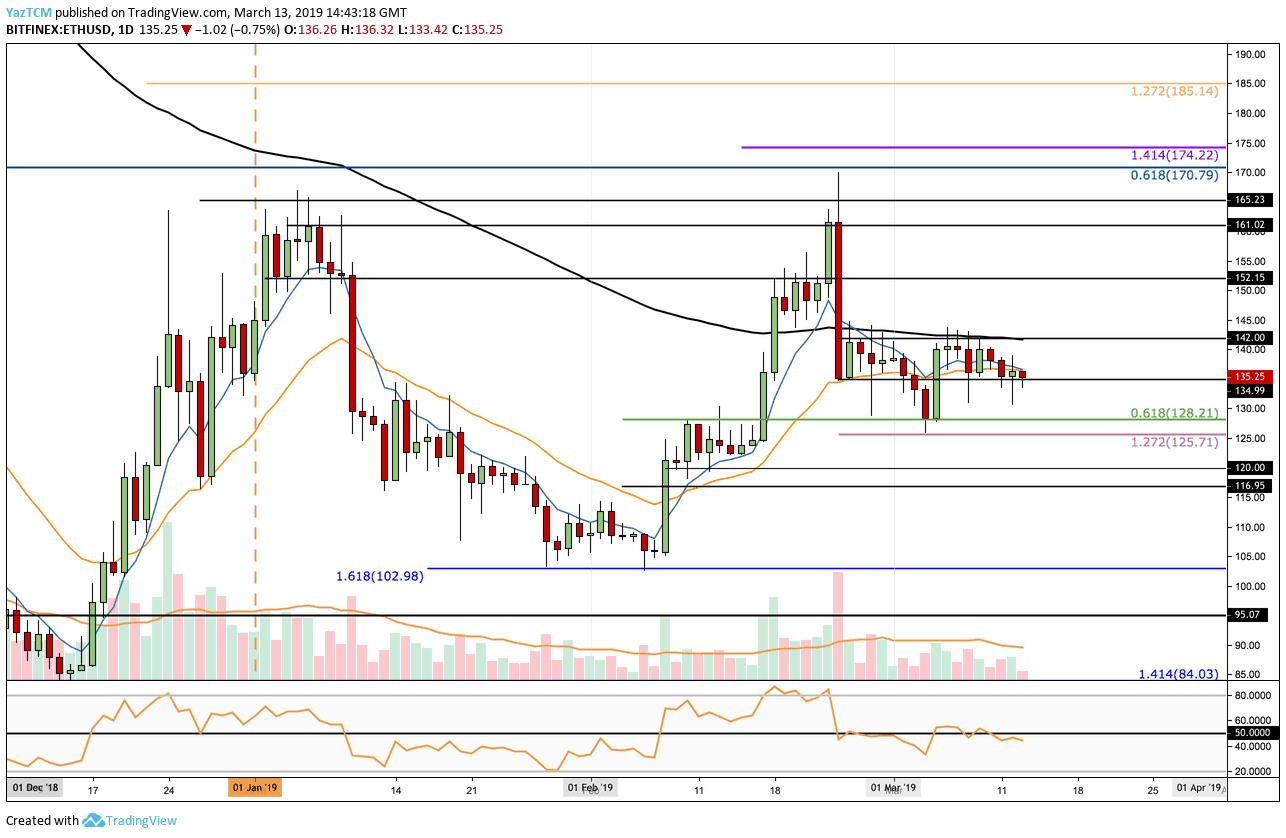
Looking at the ETH/USD 1-Day Chart:
- Since our previous ETH/USD analysis, we can see that the market has left ‘trapped’ within the range between $142 from above and $135 from below. Price action has not been able to break above $142, but the bulls are struggling massively to defend the $135 level as the coin trades around this price area.
- From above: The nearest resistance lies at the upper boundary of the range at $142. If the bulls break above $142, higher resistance is expected at $152, $161 and $170. If the bulls succeed in breaking above $170, further resistance lies at $174 and $185.
- From below: Breaking below the $135 price area, and the next support lies at $128 where lies the short term .618 Fibonacci Retracement level. Beneath $128, further support lies at $120, $117 and $110.
- The RSI has been trading along the 50 levels for the majority of the past two weeks, which indicates the indecision within the market. The RSI has recently dropped slightly below 50 which may suggest that there may be more sell-offs ahead.
- The trading volume has been considerably lower than usual during March.
Looking at the ETH/BTC 1-Day Chart:
- Following our previous ETH/BTC analysis, we can see that Ethereum has dropped slightly against Bitcoin. The market has recently rebounded from the support level at 0.03357 BTC, where lies the short term .618 Fibonacci Retracement. Price action is currently consolidating around the support provided by the 100 days moving average line.
- The Golden Cross mentioned in our previous analysis might turn into a bullish move in case of breaking up. So far it seems that the MA-50 is moving down along with ETH towards a Death Cross of the MA-200.
- From above: The nearest resistance above lies at 0.035 BTC and 0.0359 BTC. Further resistance lies at 0.038 BTC and 0.040 BTC levels.
- From below: The nearest support lies at 0.03357 BTC. Below we can expect more support at 0.0325 BTC, 0.0315 BTC, and 0.03 BTC.
- The RSI has also recently dropped beneath the 50 levels which may indicate that the bearish pressure may increase in the coming days pushing down the market.
- The trading volume has been slightly below average as of recently.
SPECIAL OFFER (Sponsored)
LIMITED OFFER 2024 for CryptoPotato readers at Bybit: Use this link to register and open a $500 BTC-USDT position on Bybit Exchange for free!
Disclaimer: Information found on CryptoPotato is those of writers quoted. It does not represent the opinions of CryptoPotato on whether to buy, sell, or hold any investments. You are advised to conduct your own research before making any investment decisions. Use provided information at your own risk. See Disclaimer for more information.
Cryptocurrency charts by TradingView.