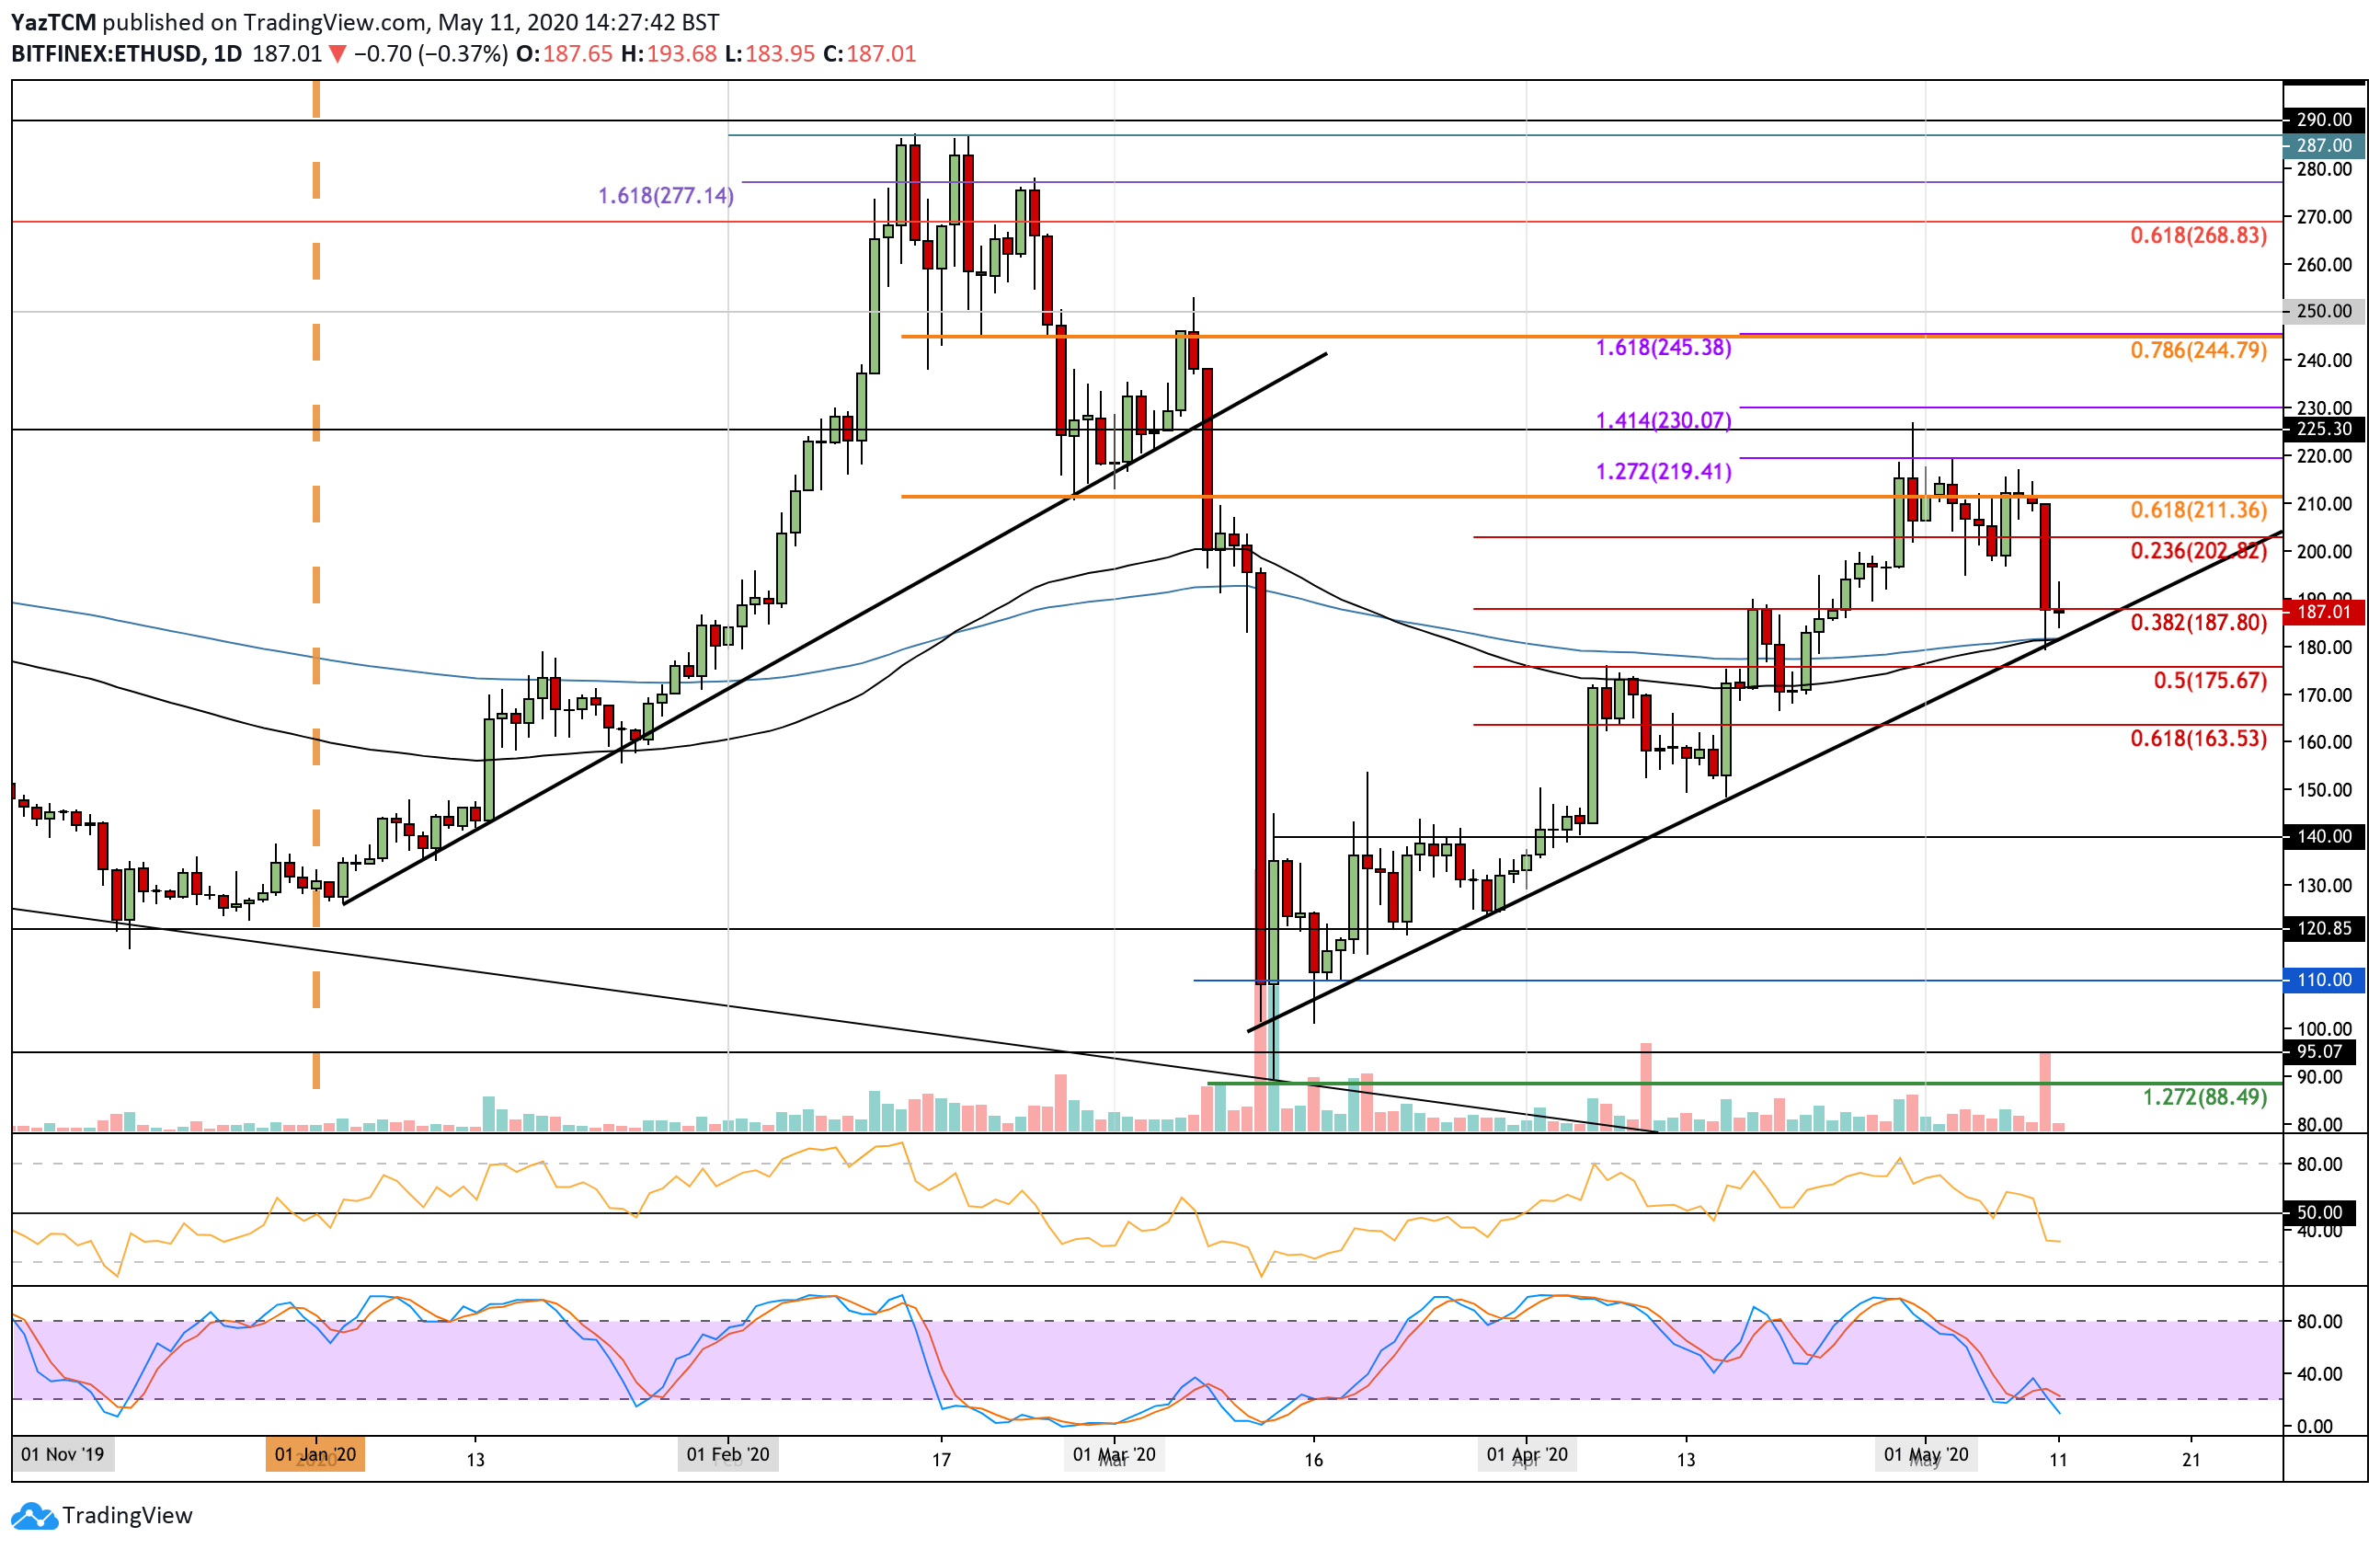
ETH/USD:
Support: $180, $175, $170.
Resistance: $190, $200, $211.
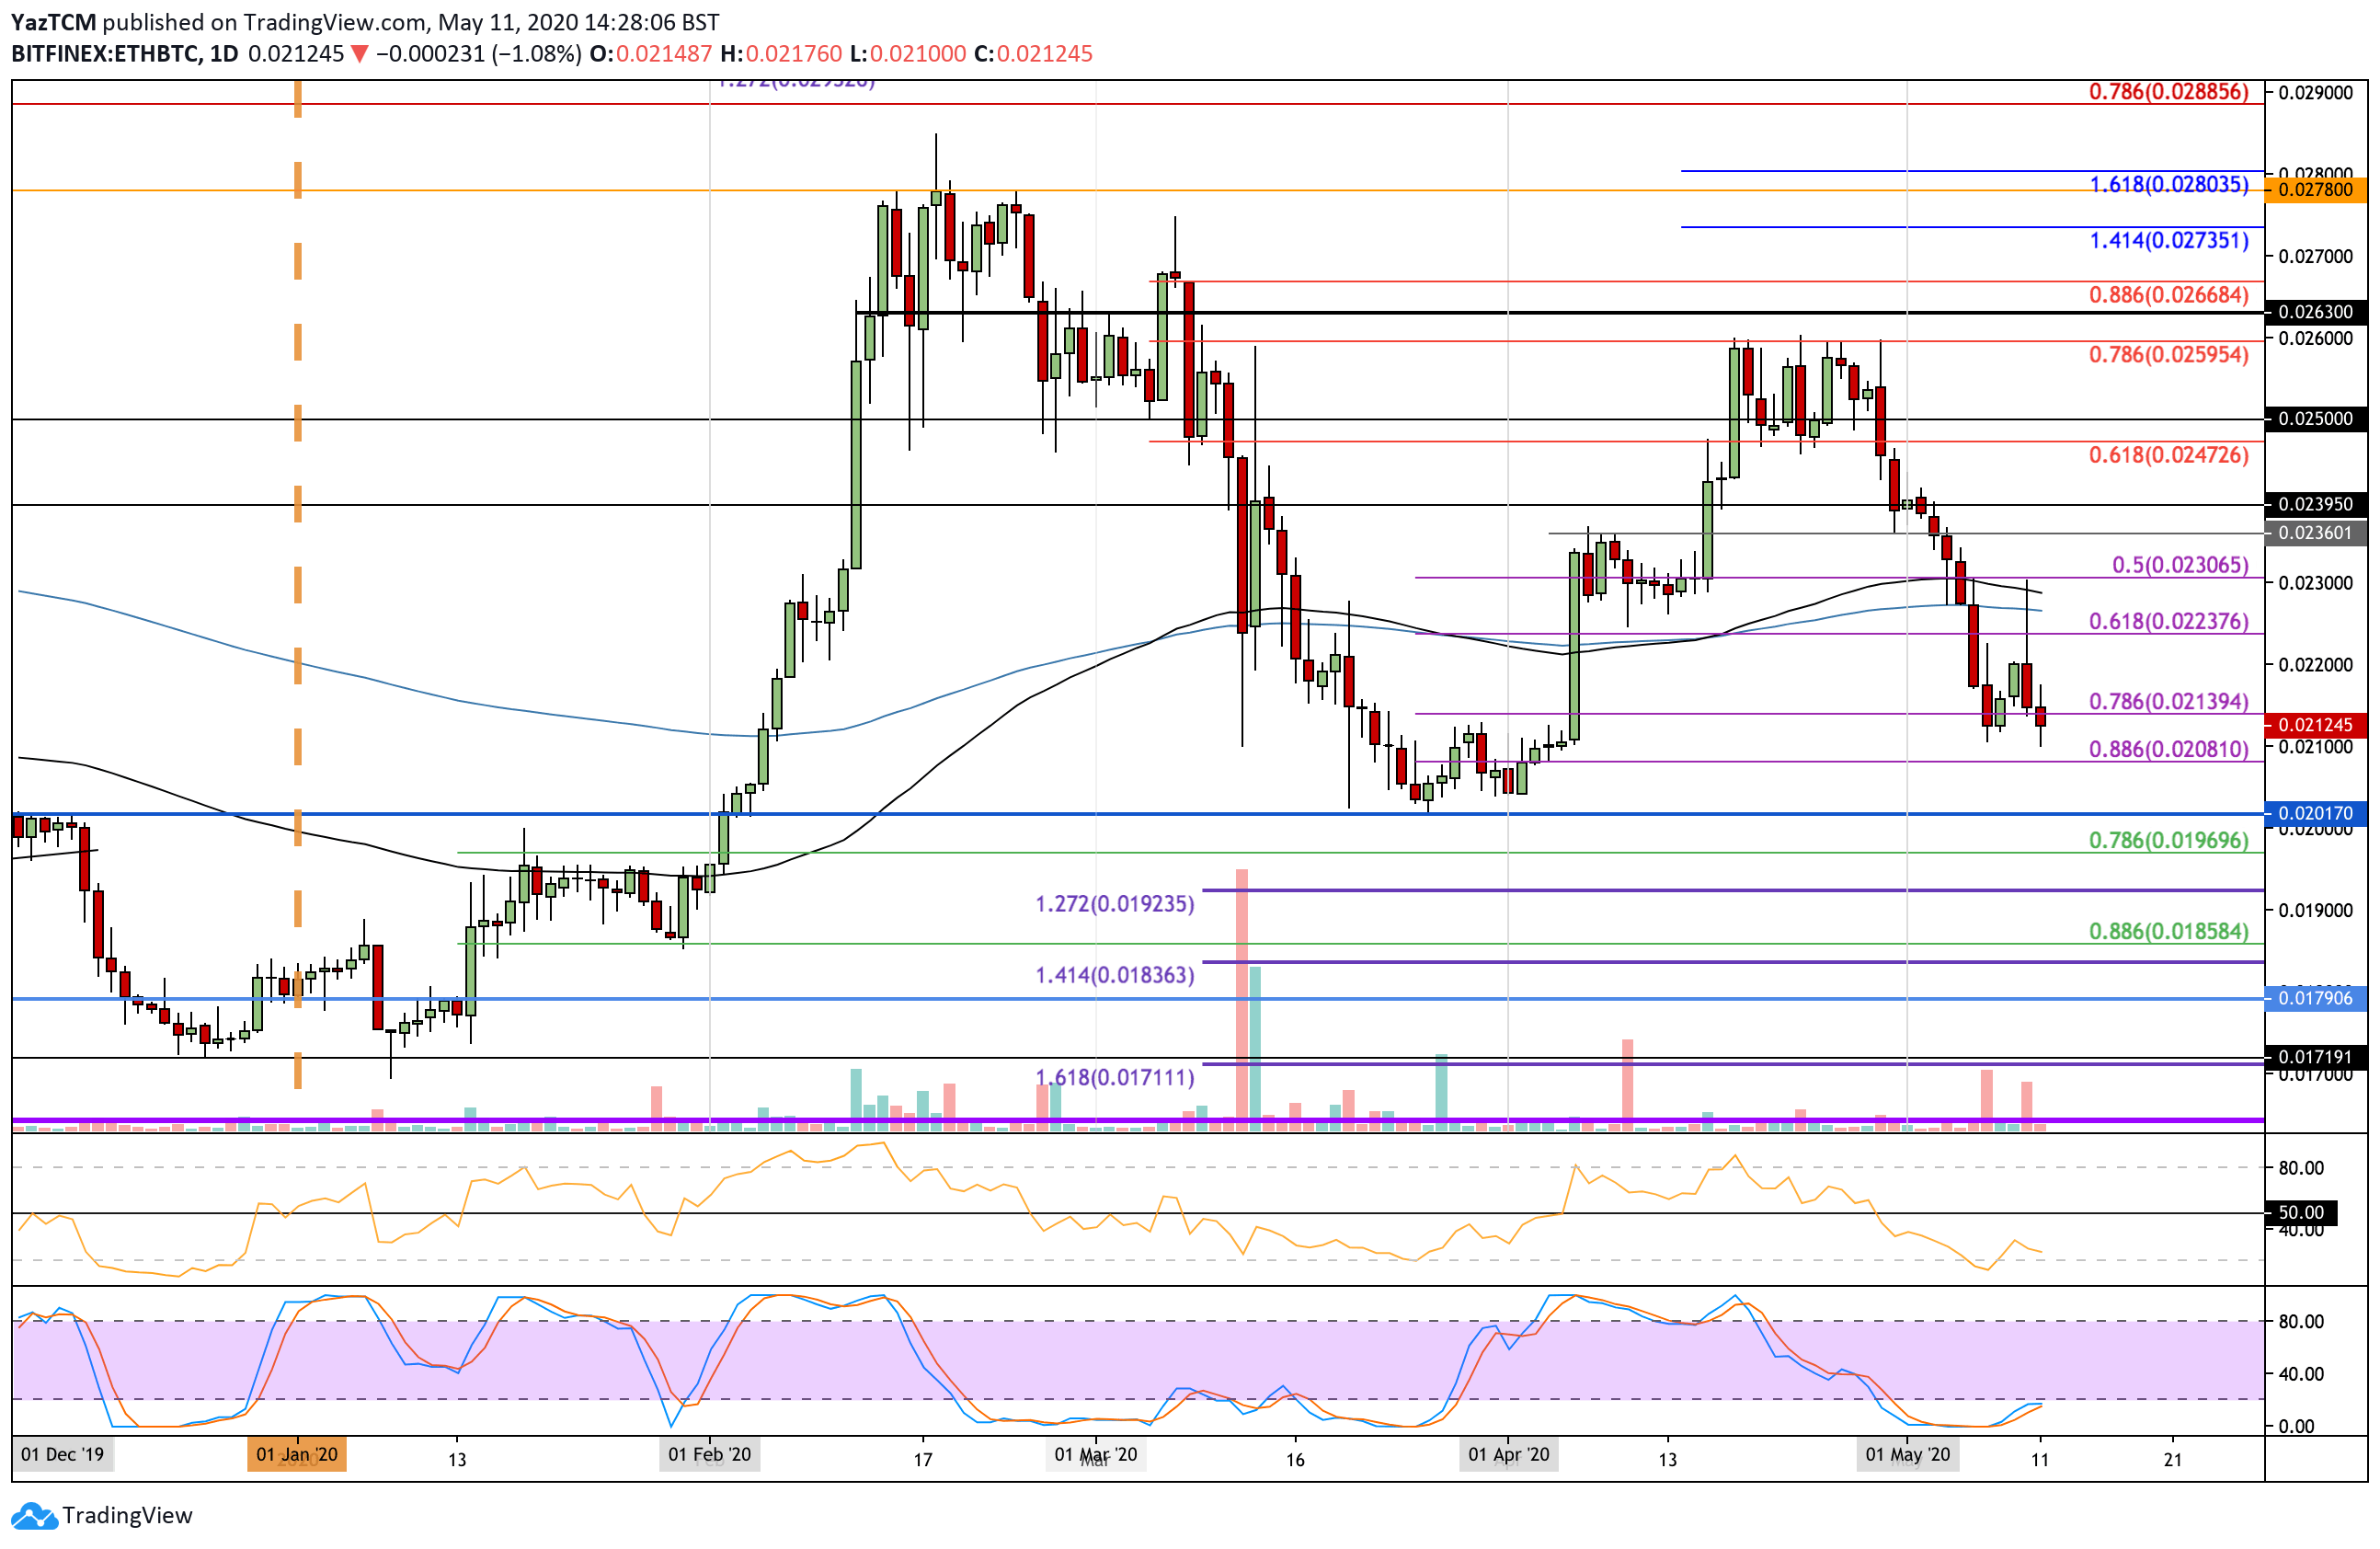
ETH/BTC:
Support: 0.021 BTC, 0.0208 BTC, 0.02 BTC.
Resistance: 0.022 BTC, 0.0225 BTC, 0.023 BTC.
Ethereum saw a sharp price decline over the weekend as it fell beneath the $200 level and dropped as low as $180. It found strong support at a rising trend line that has been in action for around 2-months of trading. It rebounded from here to close above the support at $187 (.382 Fib Retracement).
This price decline was largely caused by the fact that BTC saw a sharp 20% sell-off during the weekend as it dropped from above $9,600 to reach as low as $8,100.
If the sellers continue to drive ETH lower, the first level of support is located at $180, where lies the 200-days EMA, the 100-days EMA, and the rising support trend line. If they push beneath this level, added support is found at $175 (.5 Fib Retracement), $170, and $164 (.618 Fib Retracement).
On the other hand, if the buyers push higher, the first two levels of resistance lie at $190 and $200. Above this, resistance is found at $211 (bearish .618 Fib Retracement), $220 (1.272 Fib Extension), $225, and $230 (1.414 Fib Extension).
The weekend price decline caused ETH to drop beneath the 50 line on the RSI, which indicates that the sellers took control of the market momentum. To break $200 again, the RSI must rise back above the 50 line to let the bulls reclaim the momentum of the market.
Ethereum has seen a depressing month in May 2020. The coin started the month trading at 0.024 BTC and went on to drop by around 13% over the last 11-days. It reached 0.021 BTC today as the bulls battle to keep ETH above this level.
A break beneath 0.02 BTC could be catastrophic for ETH and would likely see the coin unwinding back into the 2020 lows at around 0.017 BTC.
If the sellers do push beneath 0.021 BTC, the first level of support lies at 0.0208 BTC (short term .886 Fib Retracement). Beneath this, support is found at 0.0201 BTC, 0.20 BTC, and 0.0196 BTC.
Alternatively, if bulls push higher, the first level of resistance is at 0.022 BTC. Above this, resistance can be located at 0.0225 BTC (200-days EMA), 0.023 BTC, and 0.0236 BTC.
The RSI is well beneath 50 as the bears dominate the market momentum. If the RSI starts to rise, this will be the first sign that the bearish momentum is starting to fade. Additionally, the Stochastic RSI is in extremely oversold conditions and is primed for a bullish crossover signal.