The market is currently cooling up to build momentum for another potential move.
Notice the symmetric triangle formation that is evolving on the Bitcoin’s chart: A positive break of this formation could easily lead to a breach of the inverse Head and Shoulders trigger line. In such scenario, BTC could potentially rally toward one of the formation’s targets.
A reasonable target in such scenario could be found around the $5000 – $5200 price level, but as we mentioned before, targets (as well as TA) are not science.
Before reaching the $5K area, there is a strong resistance level at $4500. It won’t be easy for the bulls to break through this resistance level.
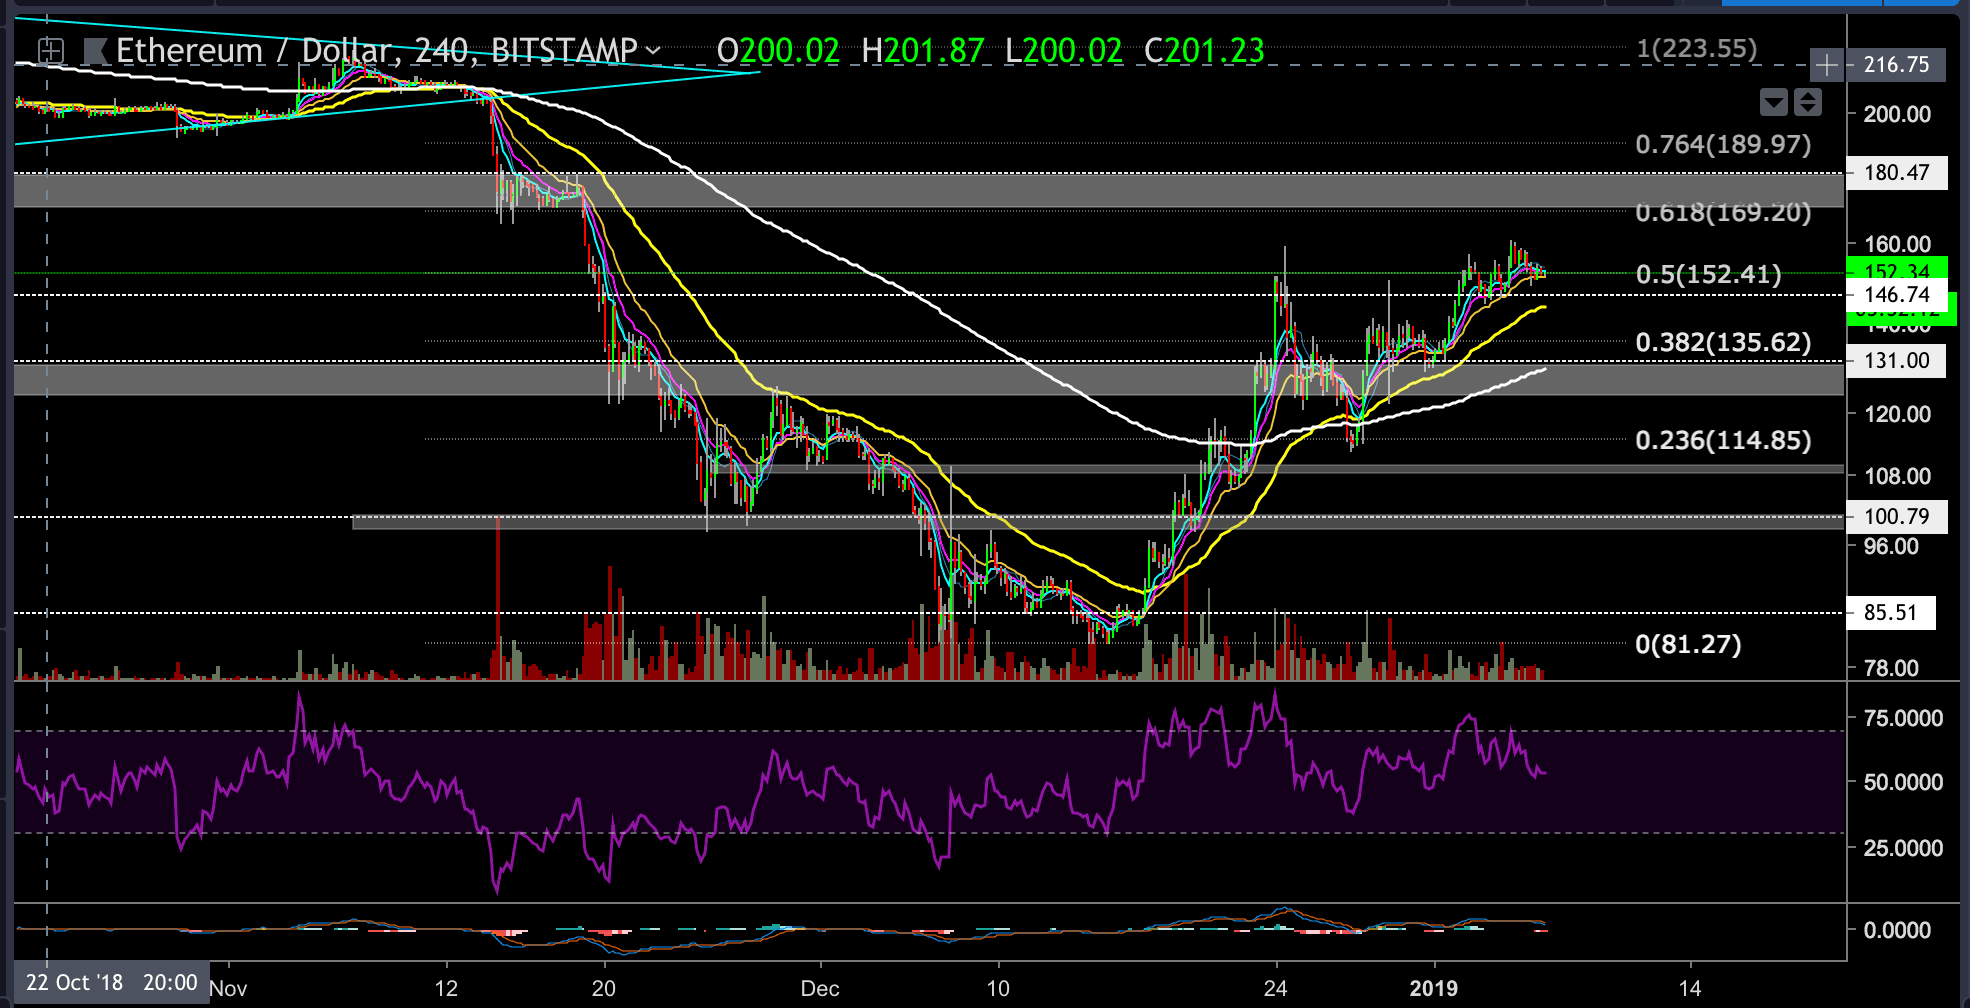
Now, let’s talk about Ethereum: ETH is currently trading at the $152.35 price level, as of now.
ETH retested the $160 resistance and got rejected one more time. A lot depends on Bitcoin, but breaking the $160 is essential to continue North.
Looking at the 4-hour chart (Bitstamp)
- ETH is currently trading between the $146 support level and the $160 resistance level.
- The Next potential bullish target could be found at the $170 – $180 resistance level (which is a 10%-17% move). It is also the 0.618 – 0.764 Fibonacci retracement level and a sweet spot for the bears to re-enter their short positions, so Bull’s longing should be looking at the $170-$180 price levels for a right place to take some risk of the table.
- On the other hand, failing to break up the $160 level is likely to send ETH to retest the $146 support level or even lower – the next support lies around $131 – $124 range.
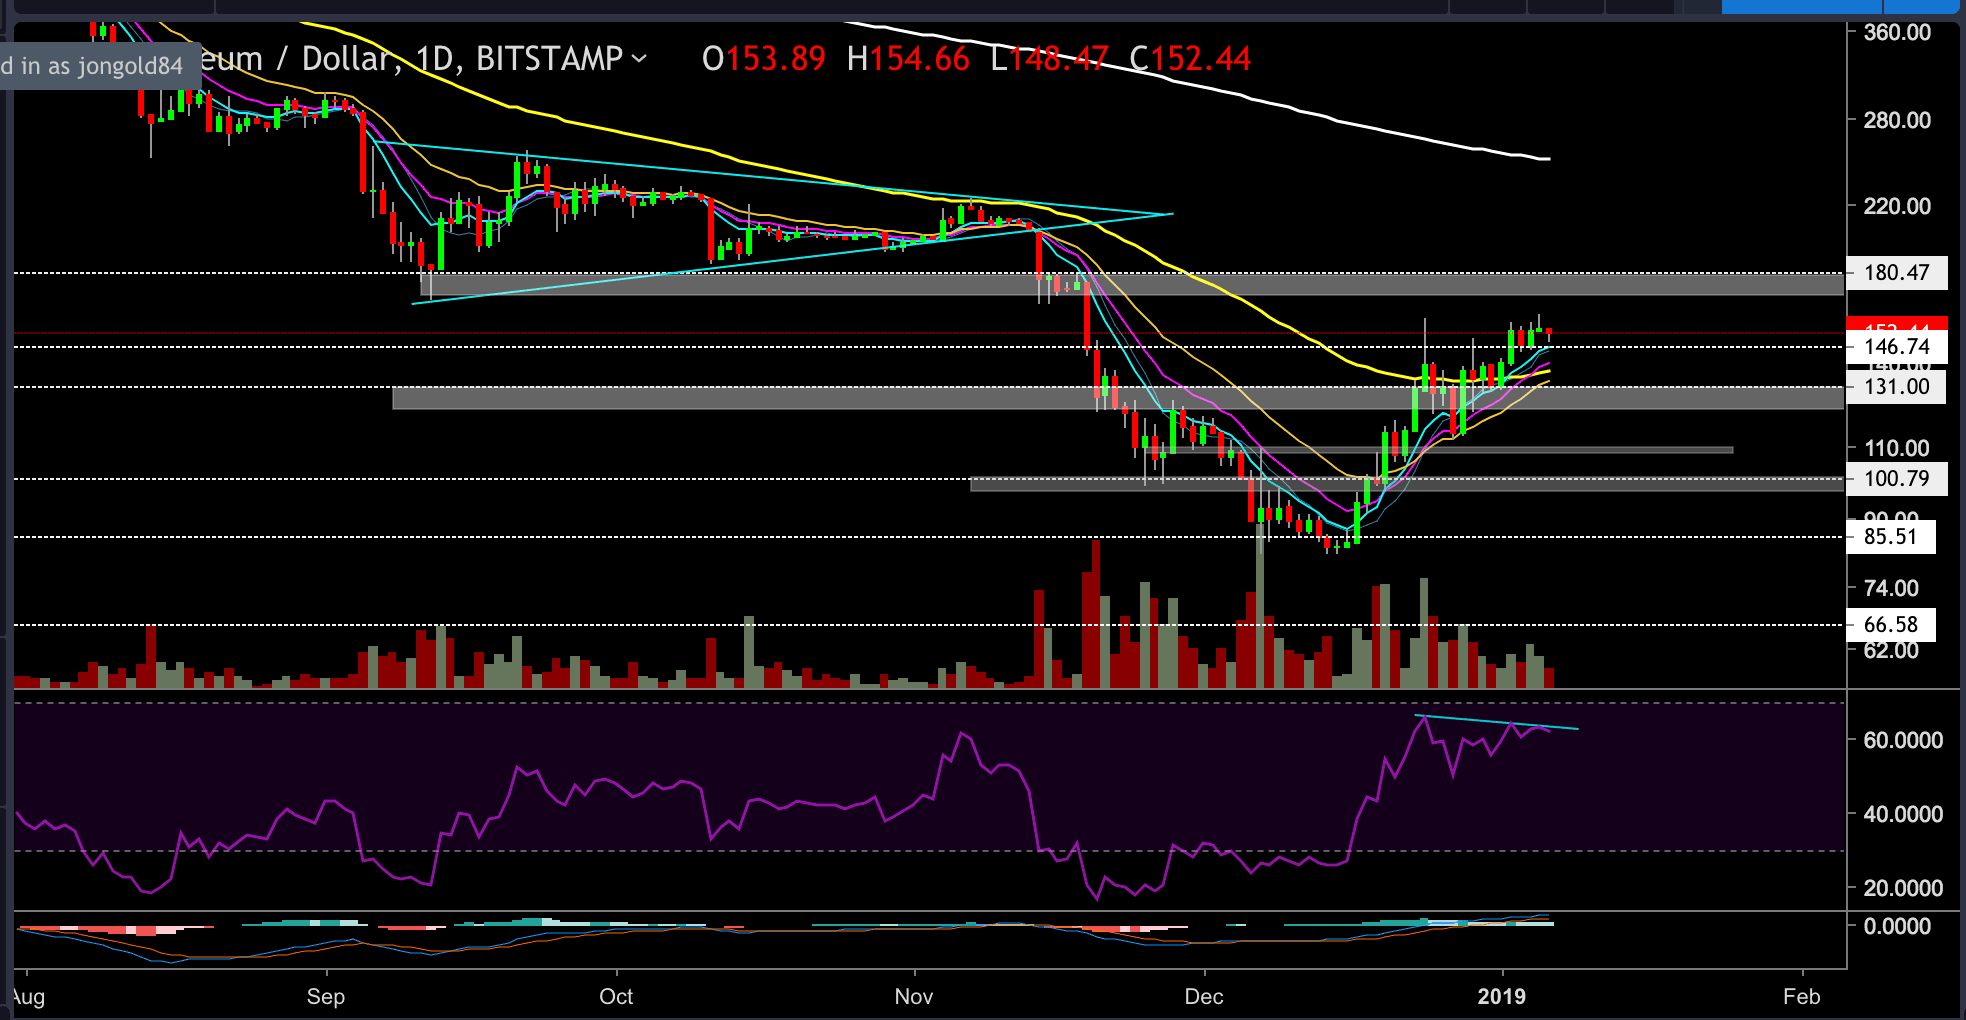
Looking at the ETH 1-day chart (Bitstamp)
- We can notice how the 8, 13 and 21 days EMA’s are crossing above the 55 EMA (the yellow line on the following chart). It is a bullish sign for a potentially positive move. We would like to see those EMA’s climbing vertically above the 55 EMA.
- If the bulls manage to rally toward the $170 – $180 resistance level and to breach above it, then the $214 price level could be the next target, but as of now, it is too early to say.
- The RSI indicator is consolidating nicely at the upper side of the channel. If the light-blue trend line gets breached up, then it could signal a mini-rally.
SPECIAL OFFER (Sponsored)
LIMITED OFFER 2024 for CryptoPotato readers at Bybit: Use this link to register and open a $500 BTC-USDT position on Bybit Exchange for free!
Disclaimer: Information found on CryptoPotato is those of writers quoted. It does not represent the opinions of CryptoPotato on whether to buy, sell, or hold any investments. You are advised to conduct your own research before making any investment decisions. Use provided information at your own risk. See Disclaimer for more information.
Cryptocurrency charts by TradingView.