Over the past two days, BTC has been going sideways. This consolidation came up following a very bearish hourly candle that dropped BTC from $3690 to $3470 (Bitstamp).
It is unclear at the moment if this consolidation will turn into a bear flag formation (more bearish action to come) or a “drop base rally” formation (inverted Bart pattern) which will typically lead to a bounce back upward.
ETH, at the same time, retested the last support level of $113.6 and is currently ‘locked up’ in a channel. The range of $111 – $113 serves as a support level and $121 – $126 as a resistance level.
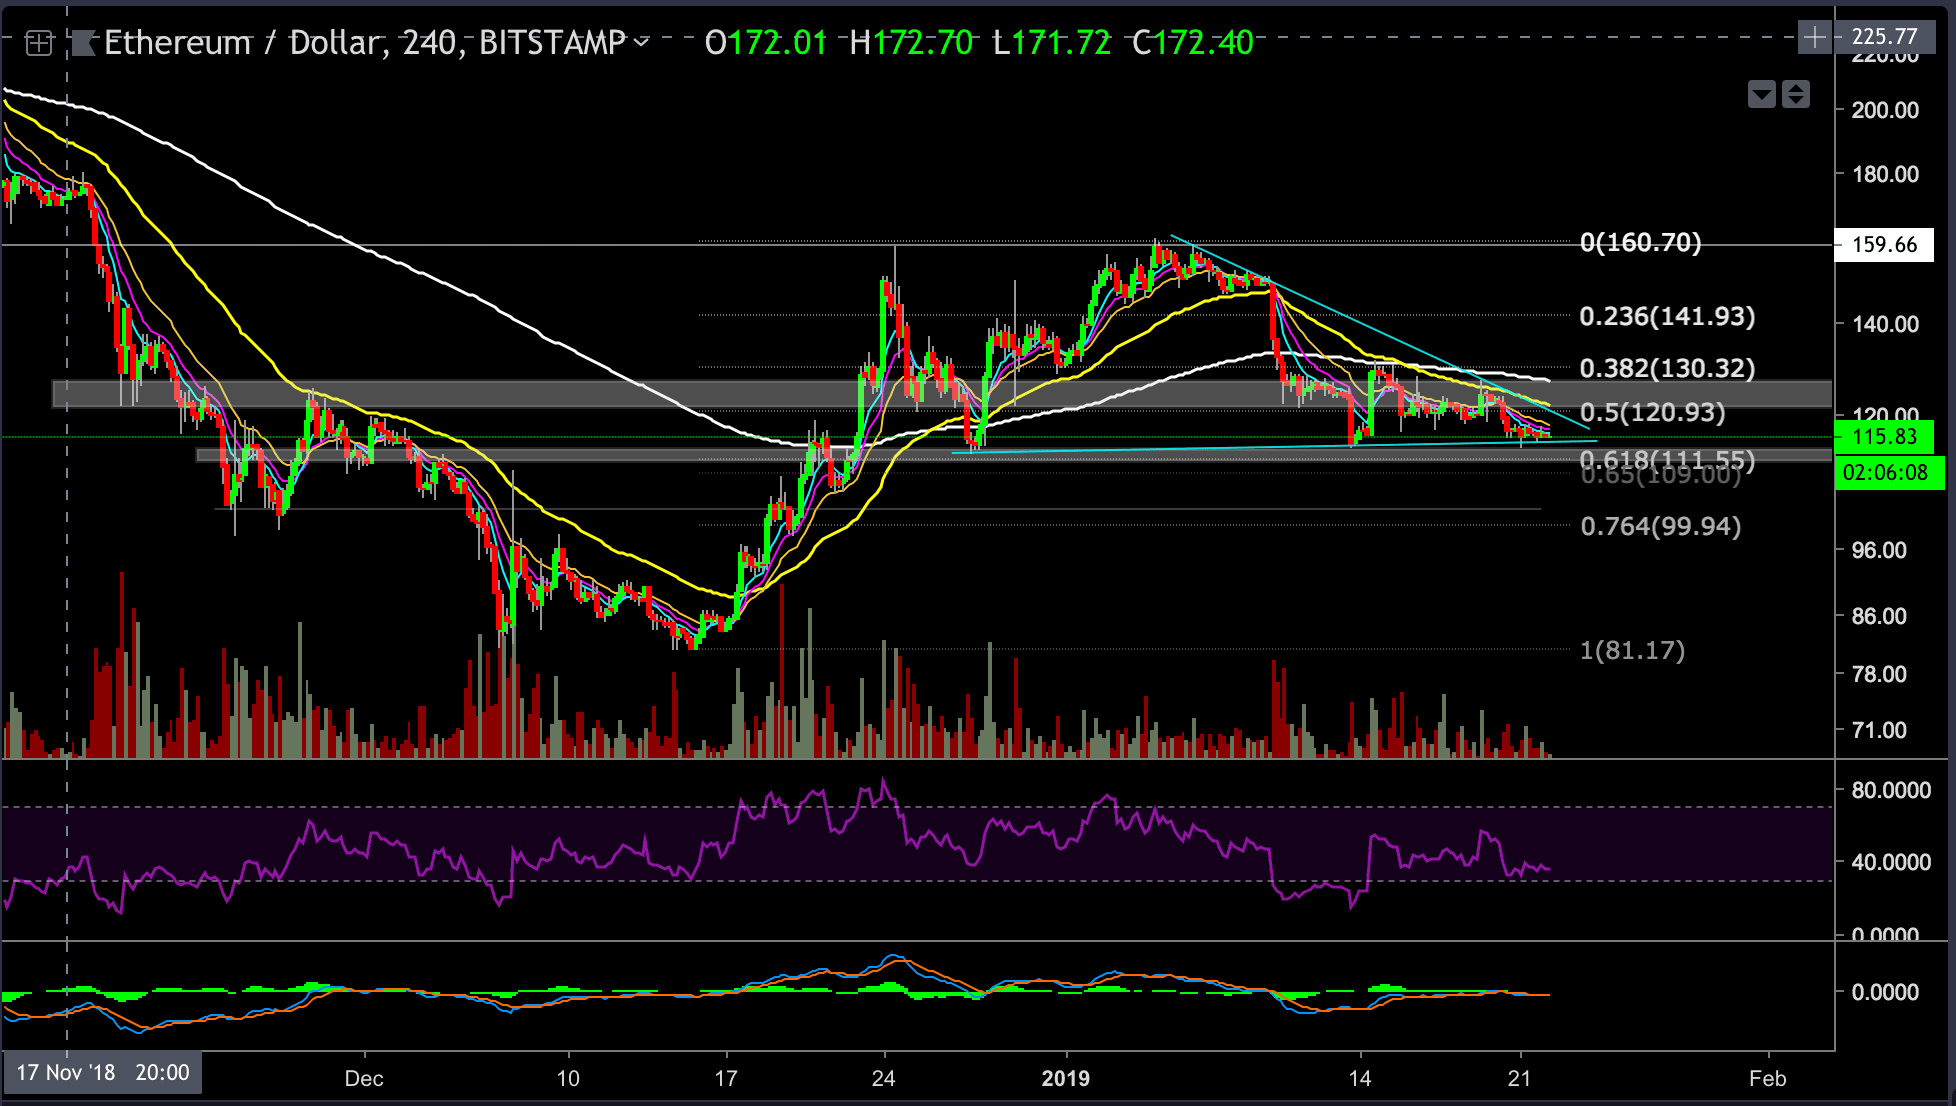
Looking at the 4-hour ETH-USD chart
- At the moment of writing this post, ETH is trading at the $116 price level, and very likely to test the mentioned support level of $111 – $113 one more time shortly.
- A break below the support level might lead to a bearish continuation toward the next support range of $100 – $105.
- There is a clear bearish triangle visible on the ETH chart; if this formation plays out, it has a target at around the $100 price level area (which is the next support level).
- In the case of a positive bounce, ETH might try to test the channel resistance level at $121-$126. A break above that resistance could send ETH for the next target, at the $130 support turned resistance level.
- ETH is still trading around the 0.5 – 0.618 Fibonacci retracement level (calculated form the last rally’s peak), while the Bulls wish to see a stronger reaction at this critical support level. The lack of these signs of strength might be a red flag for the Bulls.
- Notice that ETH is trading below all EMA’s.
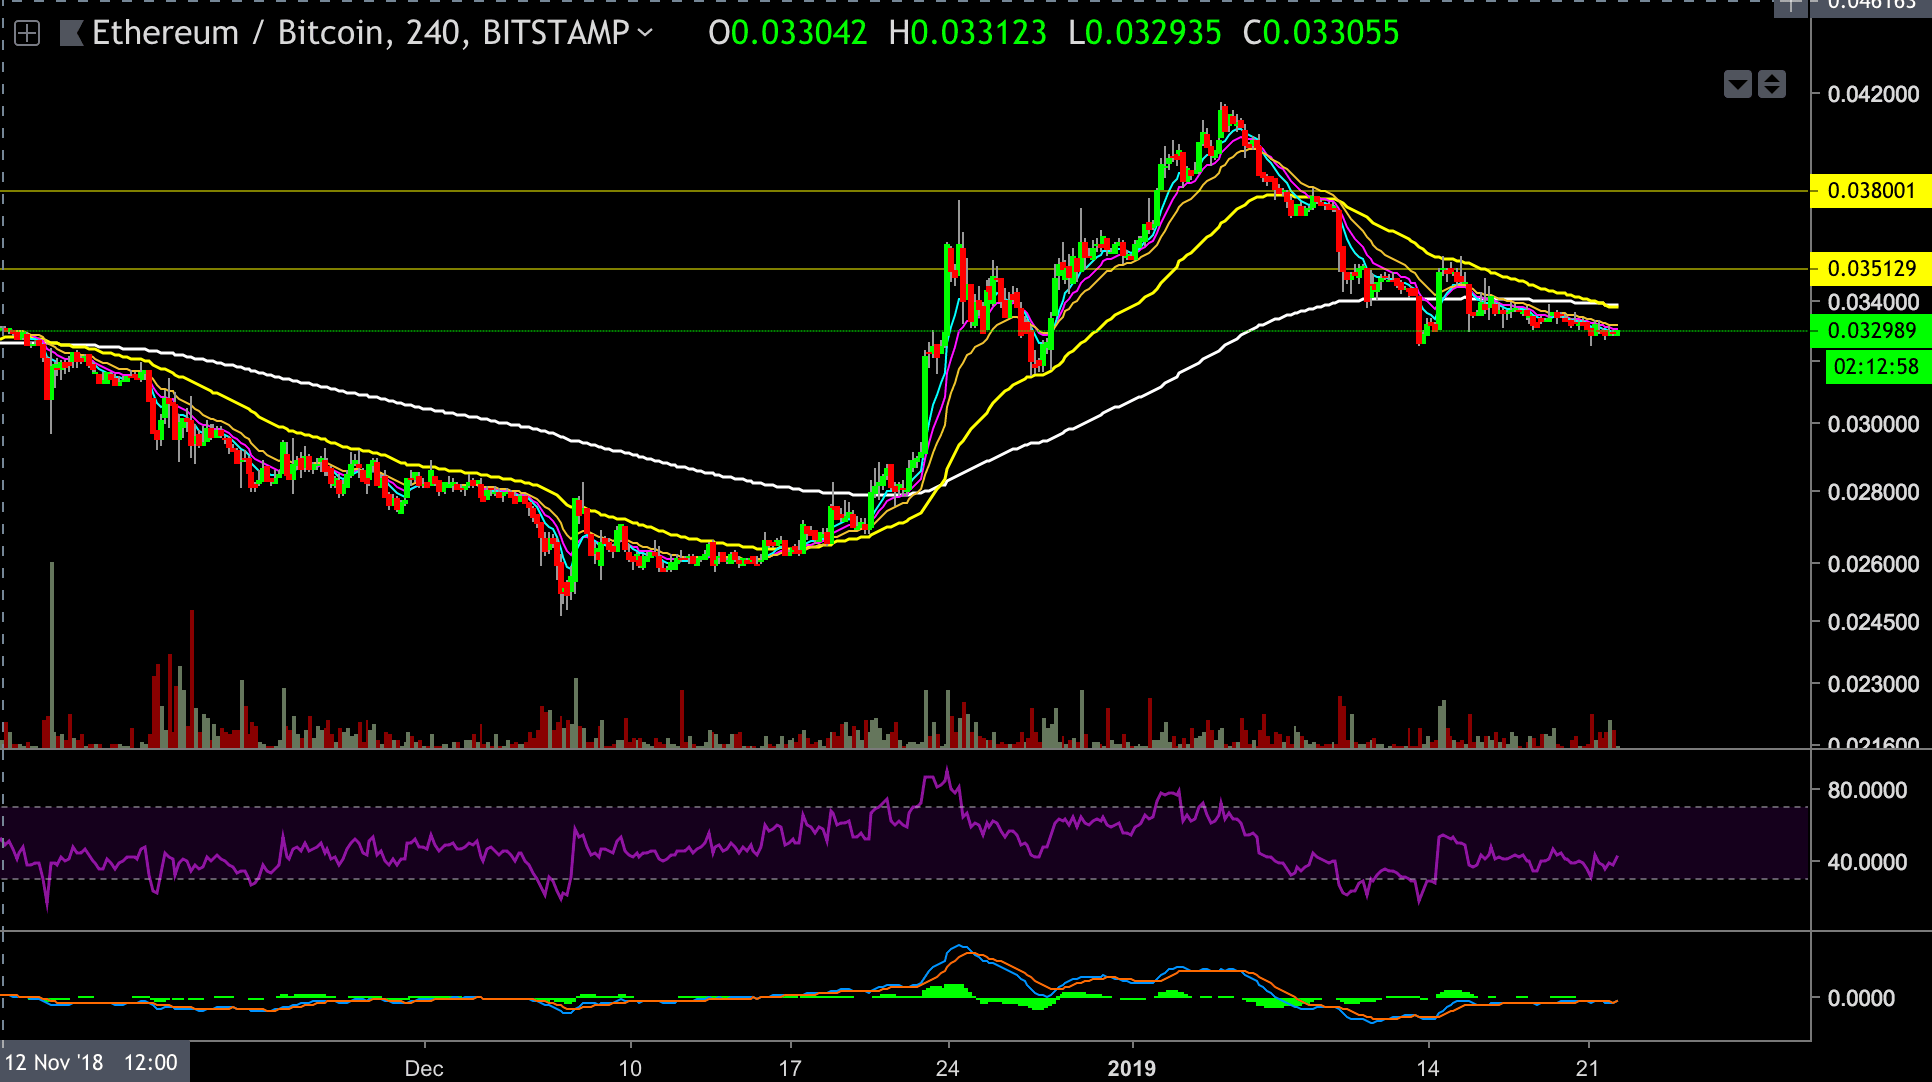
Looking at the 4-hour ETH-BTC chart
- The 55 EMA (marked by a yellow line) is crossing below the 200 EMA (marked by a white line). This cross is known as a Death Cross, and might become a very bearish signal, with that said, the 55 EMA could still bounce back above as a fake cross.
- The RSI indicator found support at the 30 area, above the oversold territories.
SPECIAL OFFER (Sponsored)
Binance Free $600 (CryptoPotato Exclusive): Use this link to register new account and receive $600 exclusive welcome offer on Binance (
full details).
LIMITED OFFER 2024 for CryptoPotato readers at Bybit: Use this link to register and open a $500 BTC-USDT position on Bybit Exchange for free!
Disclaimer: Information found on CryptoPotato is those of writers quoted. It does not represent the opinions of CryptoPotato on whether to buy, sell, or hold any investments. You are advised to conduct your own research before making any investment decisions. Use provided information at your own risk. See Disclaimer for more information.
Cryptocurrency charts by TradingView.