BTC price couldn’t find the needed momentum for another leg up, and the bears took advantage of the situation and slammed the price of BTC down by 6.5%. The big Altcoins followed as well with a significant downward vertical move that took their price down by 15-20%.
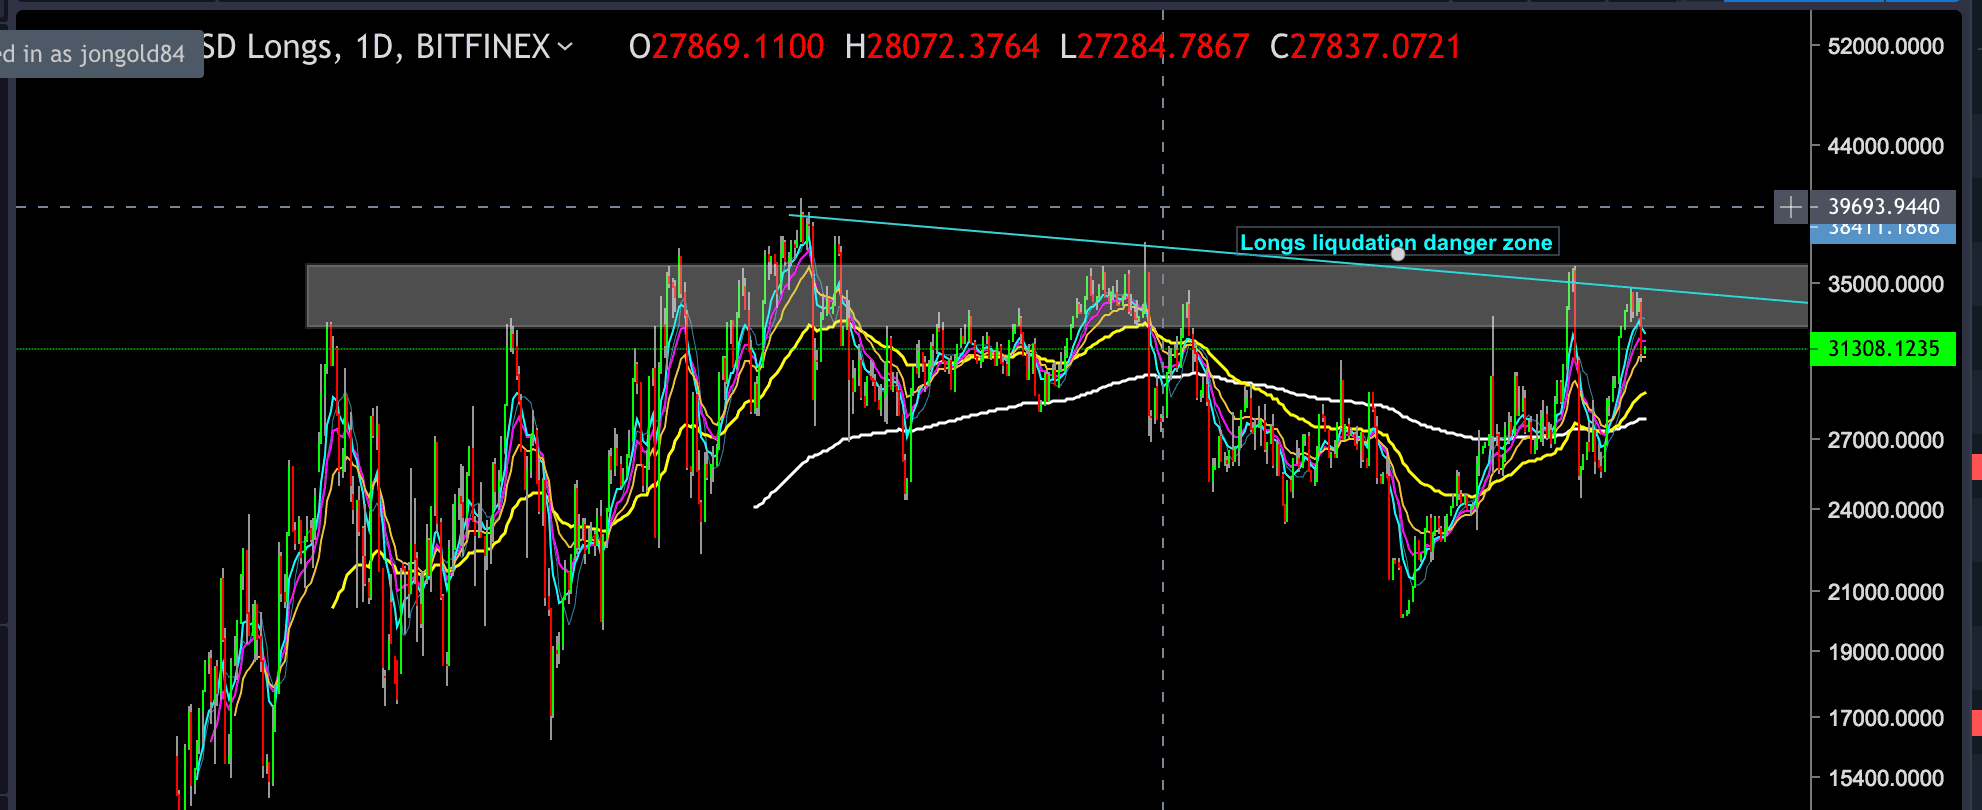
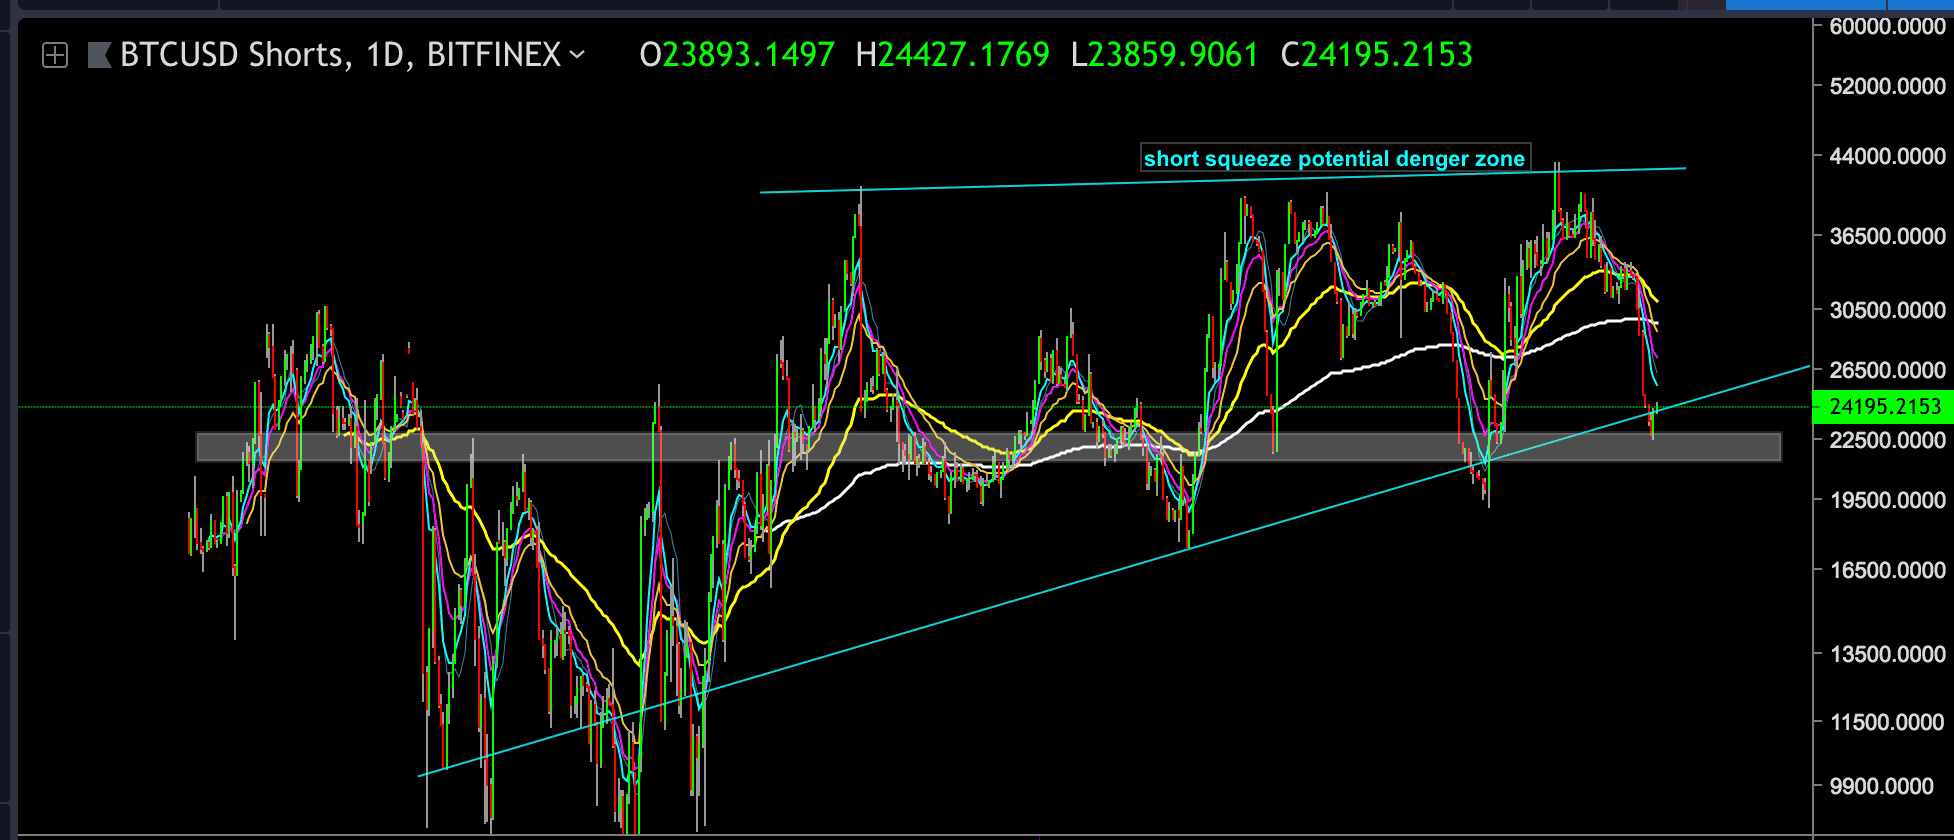
It is always important to follow the BTCUSD shorts VS BTCUSD Longs charts (attached bellow). Looking at the shorts/long charts can assist in understanding the market’s current situation. We can notice that the amount of short opened positions declined to a very low level of 23,000 which acted as a support level (marked on the attached chart), while the long opened positions chart went up in the sky toward the resistance level.
Whenever the Short/Long opened positions chart gets to a critic value it is a good signal that a big move will probably take place. Bulls are squeezing the Bears or in our case Bears liquidating the Bulls. There were too many long positions open for BTCUSD, and the bears just slammed the price below the longs stop loss common area to close their position.
The BTC free fall affected the all market immediately, as it is the market’s leader.
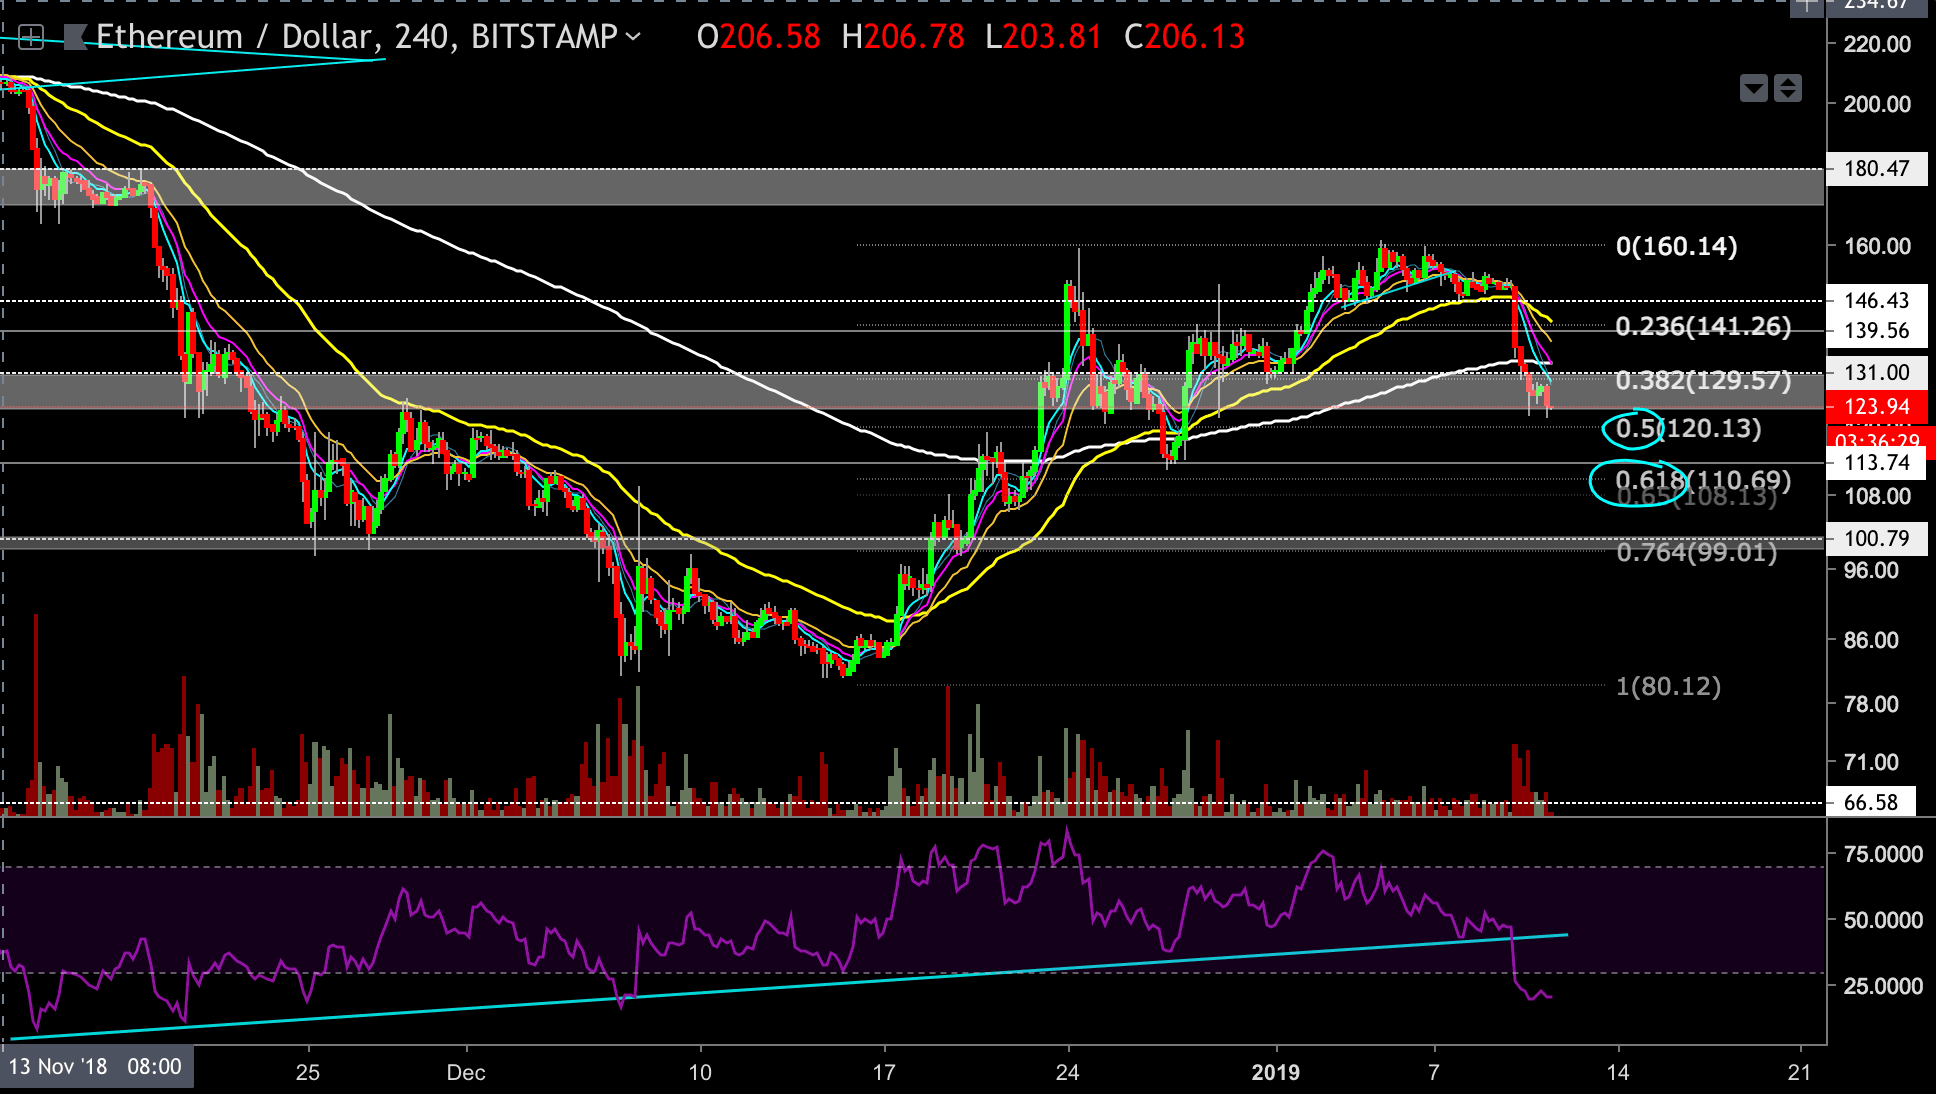
Ethereum like all the other big Altcoins reacted the same with a 17% drop and is currently trading at the $127 price level.
In our previous analysis, we alerted that if the bulls wouldn’t find the strength to breach the $160 resistance level, then ETH is likely to retest the support level of $146 or lower support of $131-$124. And without any coincidence, ETH falls exactly to the $131 support level held there for few hours and did another leg down toward the $124 level.
So what’s now…?
Looking at The 4-Hour ETH-USD Chart (Bitstamp)
- ETH is currently getting supported by the $131-$124 support level and is likely to test lower support levels as well, as selling volume is high. This level is also the 0.5 Fibonacci retracement level as well. In case this level won’t hold the bears then ETH is likely to fall toward the $114 support level which is the 0.618 Fibonacci retracement level. When and if we get to this level ETH probably will bounce up as the 0.618 is a sweet spot for bulls to attempt to reload their long positions after such a free fall, for a quick trade or even as an attempt to catch a reversal.
- In case that the $114 support level won’t hold against the bears then next the target for the decline could be found at the $100 price level.
- On the other hand, if the bulls try to fight ETH chart might retest the $131 or $140 as resistance. This move could act as bear flag move before another leg down or as part of a “drop base rally” pattern which we tend to see a lot in the crypto market, and some even call it a “Bart”, as it looks like Bart Simpson’s head.
- The 4 hours RSI is at the oversold regions with a current value of 21, it broke our drawn support trend line drastically.
- Also, notice that the price of ETH breached below the 200 EMA which is now acting as a resistance level. And that the 55 EMA (yellow line) is moving down toward the 200 EMA and could death cross him very soon.
- This type of free falls usually takes place when everybody is looking for the next move upward. Due to the volume of this down move, the probability is that ETH will test lower support levels as described above.
BTCUSD Shorts and Longs Charts (Bitfinex)
SPECIAL OFFER (Sponsored)
LIMITED OFFER 2024 for CryptoPotato readers at Bybit: Use this link to register and open a $500 BTC-USDT position on Bybit Exchange for free!
Disclaimer: Information found on CryptoPotato is those of writers quoted. It does not represent the opinions of CryptoPotato on whether to buy, sell, or hold any investments. You are advised to conduct your own research before making any investment decisions. Use provided information at your own risk. See Disclaimer for more information.
Cryptocurrency charts by TradingView.