ETH/USD Daily Chart. Source: TradingView.
Key Support Levels: $3350, $3185, $3000.
Key Resistance Levels: $3600, $3790, $3875.
Ethereum suffered a very sharp price crash over the past 24 hours. Yesterday, the coin lost as much as 23% from a high of $3946 to reach as low as $3025. However, the market recovered slightly by the end of the day to close at the 20-day MA.
Today, ETH slipped a little, which put the price beneath the 20-day MA. Yesterday’s price drop was quite extreme, and it is unlikely that a quick recovery would take place to take ETH back toward $4000.
Looking ahead, if the sellers continue to push lower, the first support lies at $3350 (August resistance). This is followed by $3185 (.786 Fib), $3000 (50-day MA), and $2890.
On the other side, the first resistance lies at the 20-day MA. Above this, resistance lies at $3600, $3790 (bearish .786 Fib), $3875 (1.272 Fib Extension), and $4060 (1.414 Fib Extension – blue).
As expected, the RSI has tumbled into the midline as indecision is now present within the market. If the RSI continues beneath the midline, the bears will take control of the momentum and will likely push ETH lower.
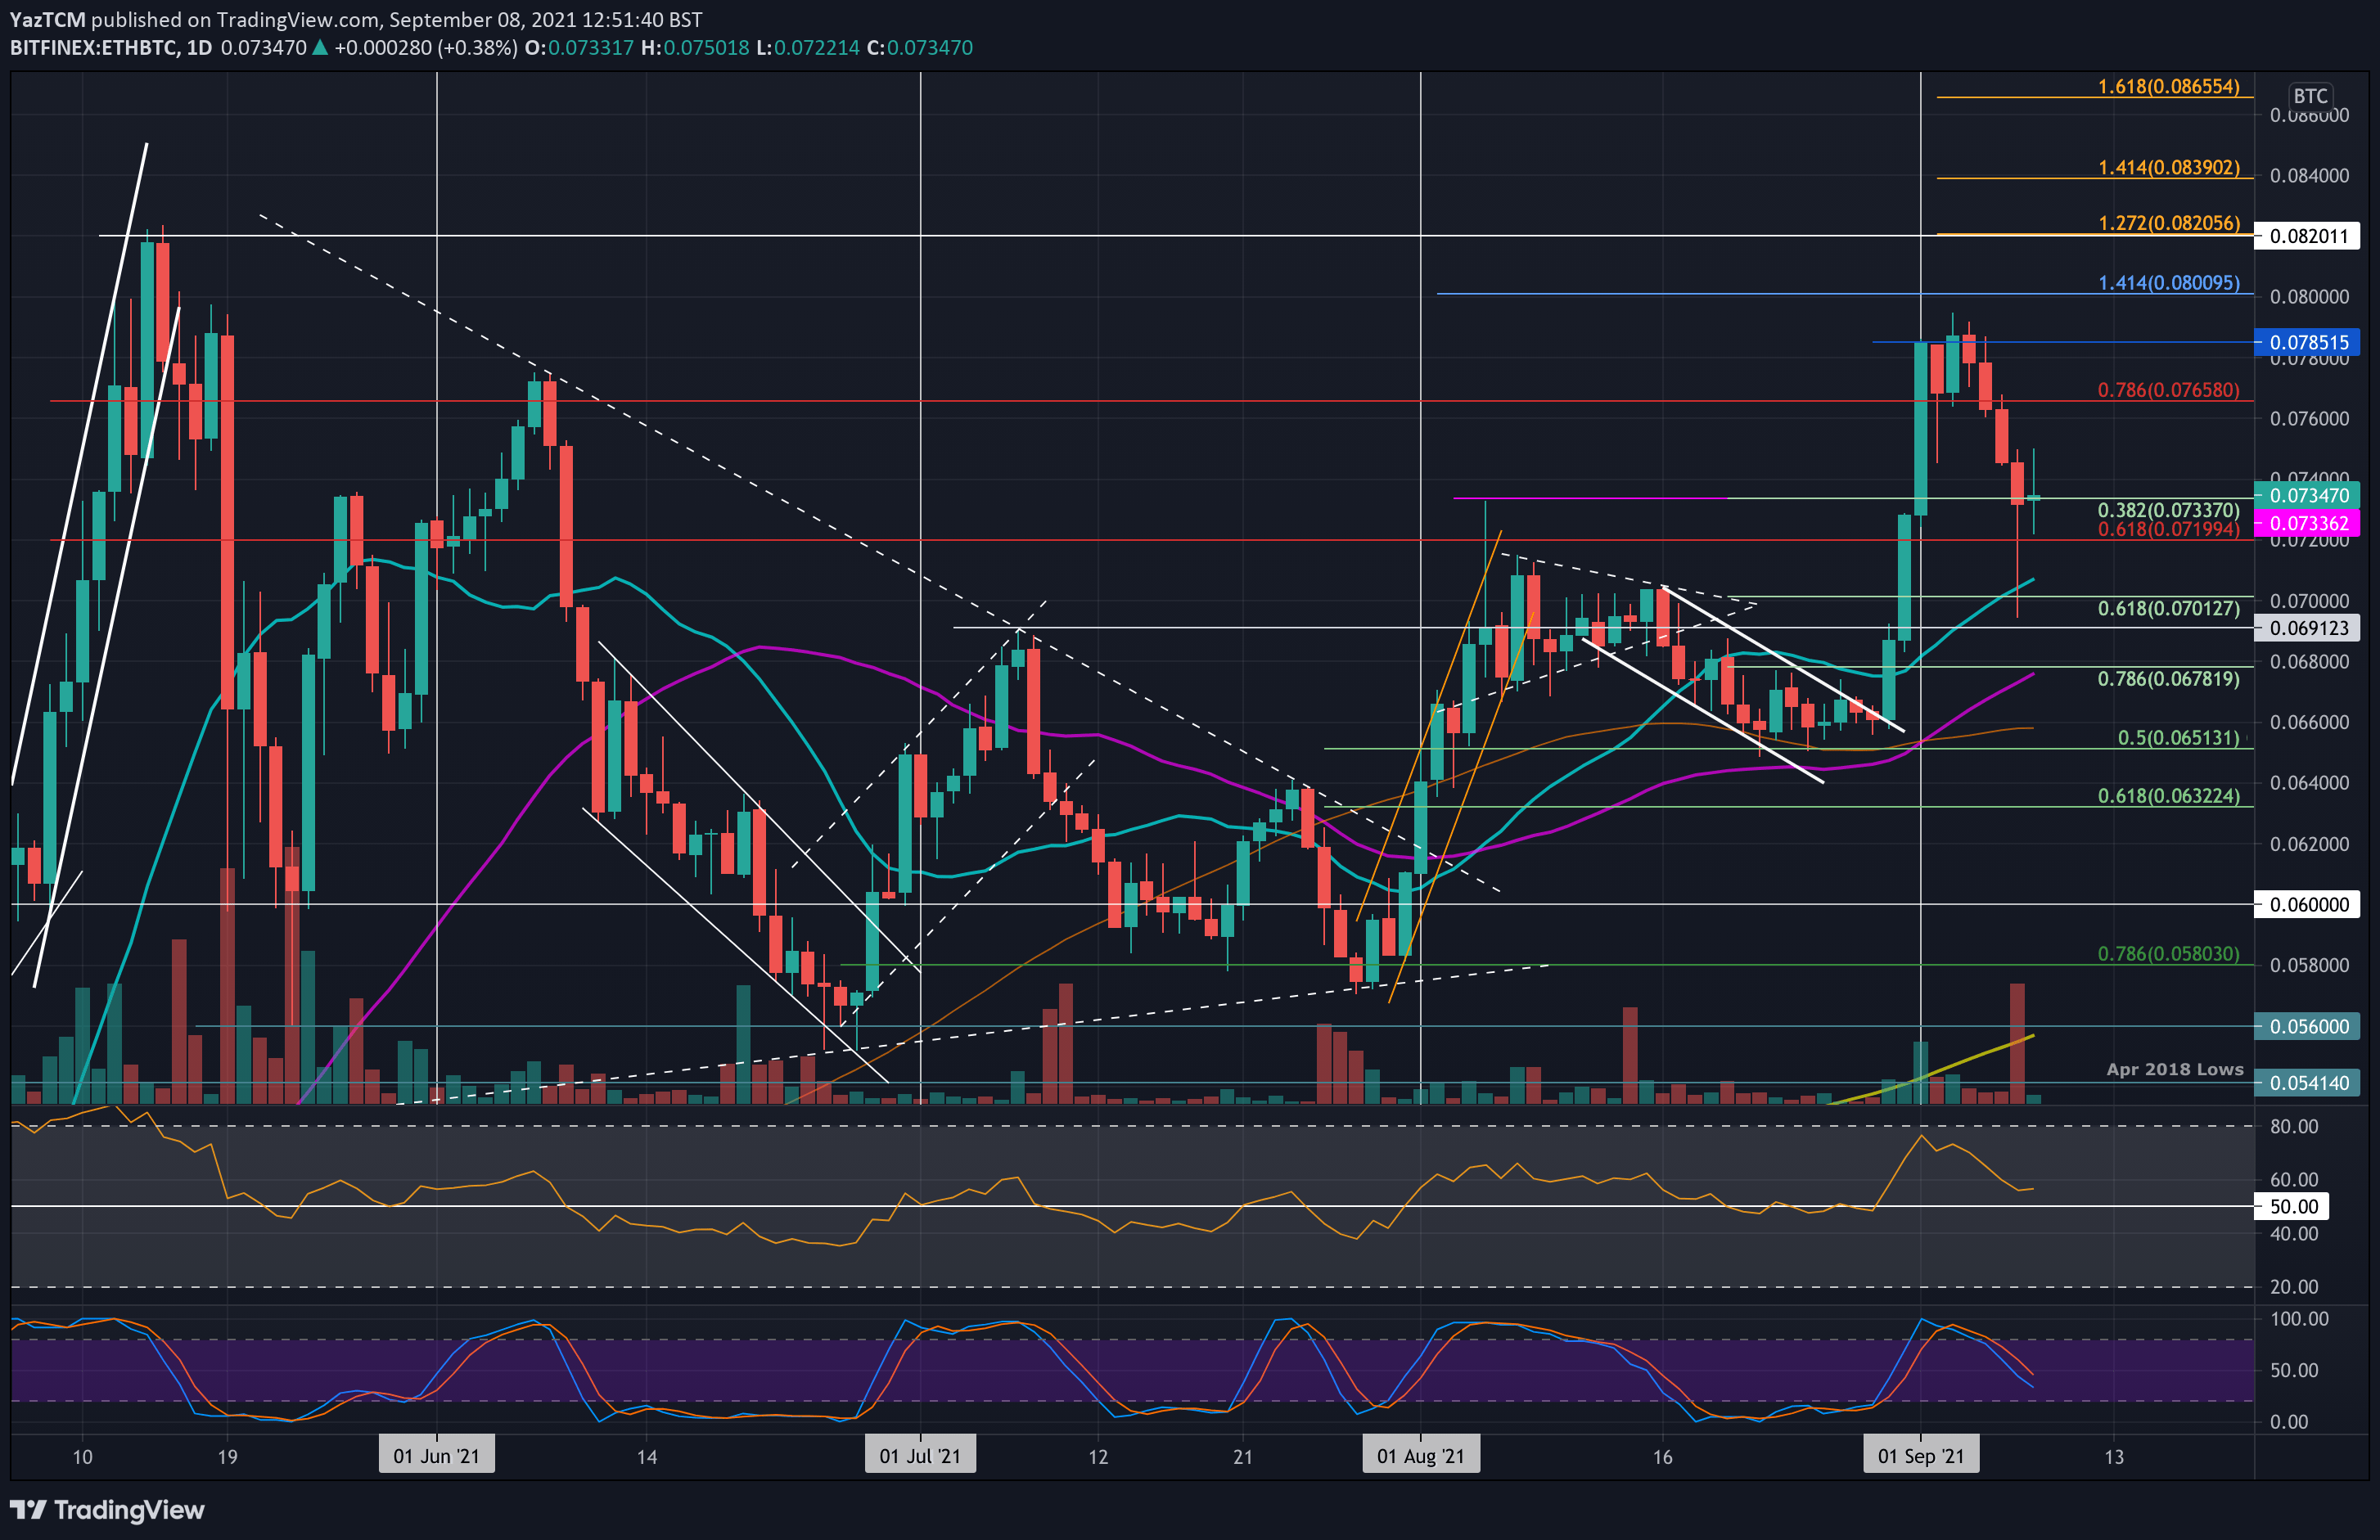
Key Support Levels: 0.0733 BTC, 0.072 BTC, 0.07 BTC.
Key Resistance Levels: 0.0765 BTC, 0.0785 BTC, 0.08 BTC.
ETH also saw a drastic fall against BTC yesterday as the coin fell as low as 0.07 BTC. The coin had been falling since it rolled over from the 0.079 BTC resistance over the weekend.
After hitting yesterday’s low, the buyers quickly regrouped and pushed the market higher to close the daily candle at 0.0733 BTC (.382 Fib), where it currently sits.
Moving forward, if the sellers continue beneath 0.0733 BTC, the first support lies at 0.072 BTC. This is followed by 0.07 BTC (20-day MA & .618 Fib), 0.0691 BTC, 0.0678 BTC (.786 Fib & 50-day MA).
On the other side, the first resistance lies at 0.0765 BTC (beraish .786 Fib). This is followed by resistance at 0.0785 BTC, 0.08 BTC, and 0.082 BTC (1.272 Fib Extension).
The RSI is heading lower but is still in the buyers’ favor as it sits above the midline. If the RSI can remain above the midline, ETH might develop a run against BTC.