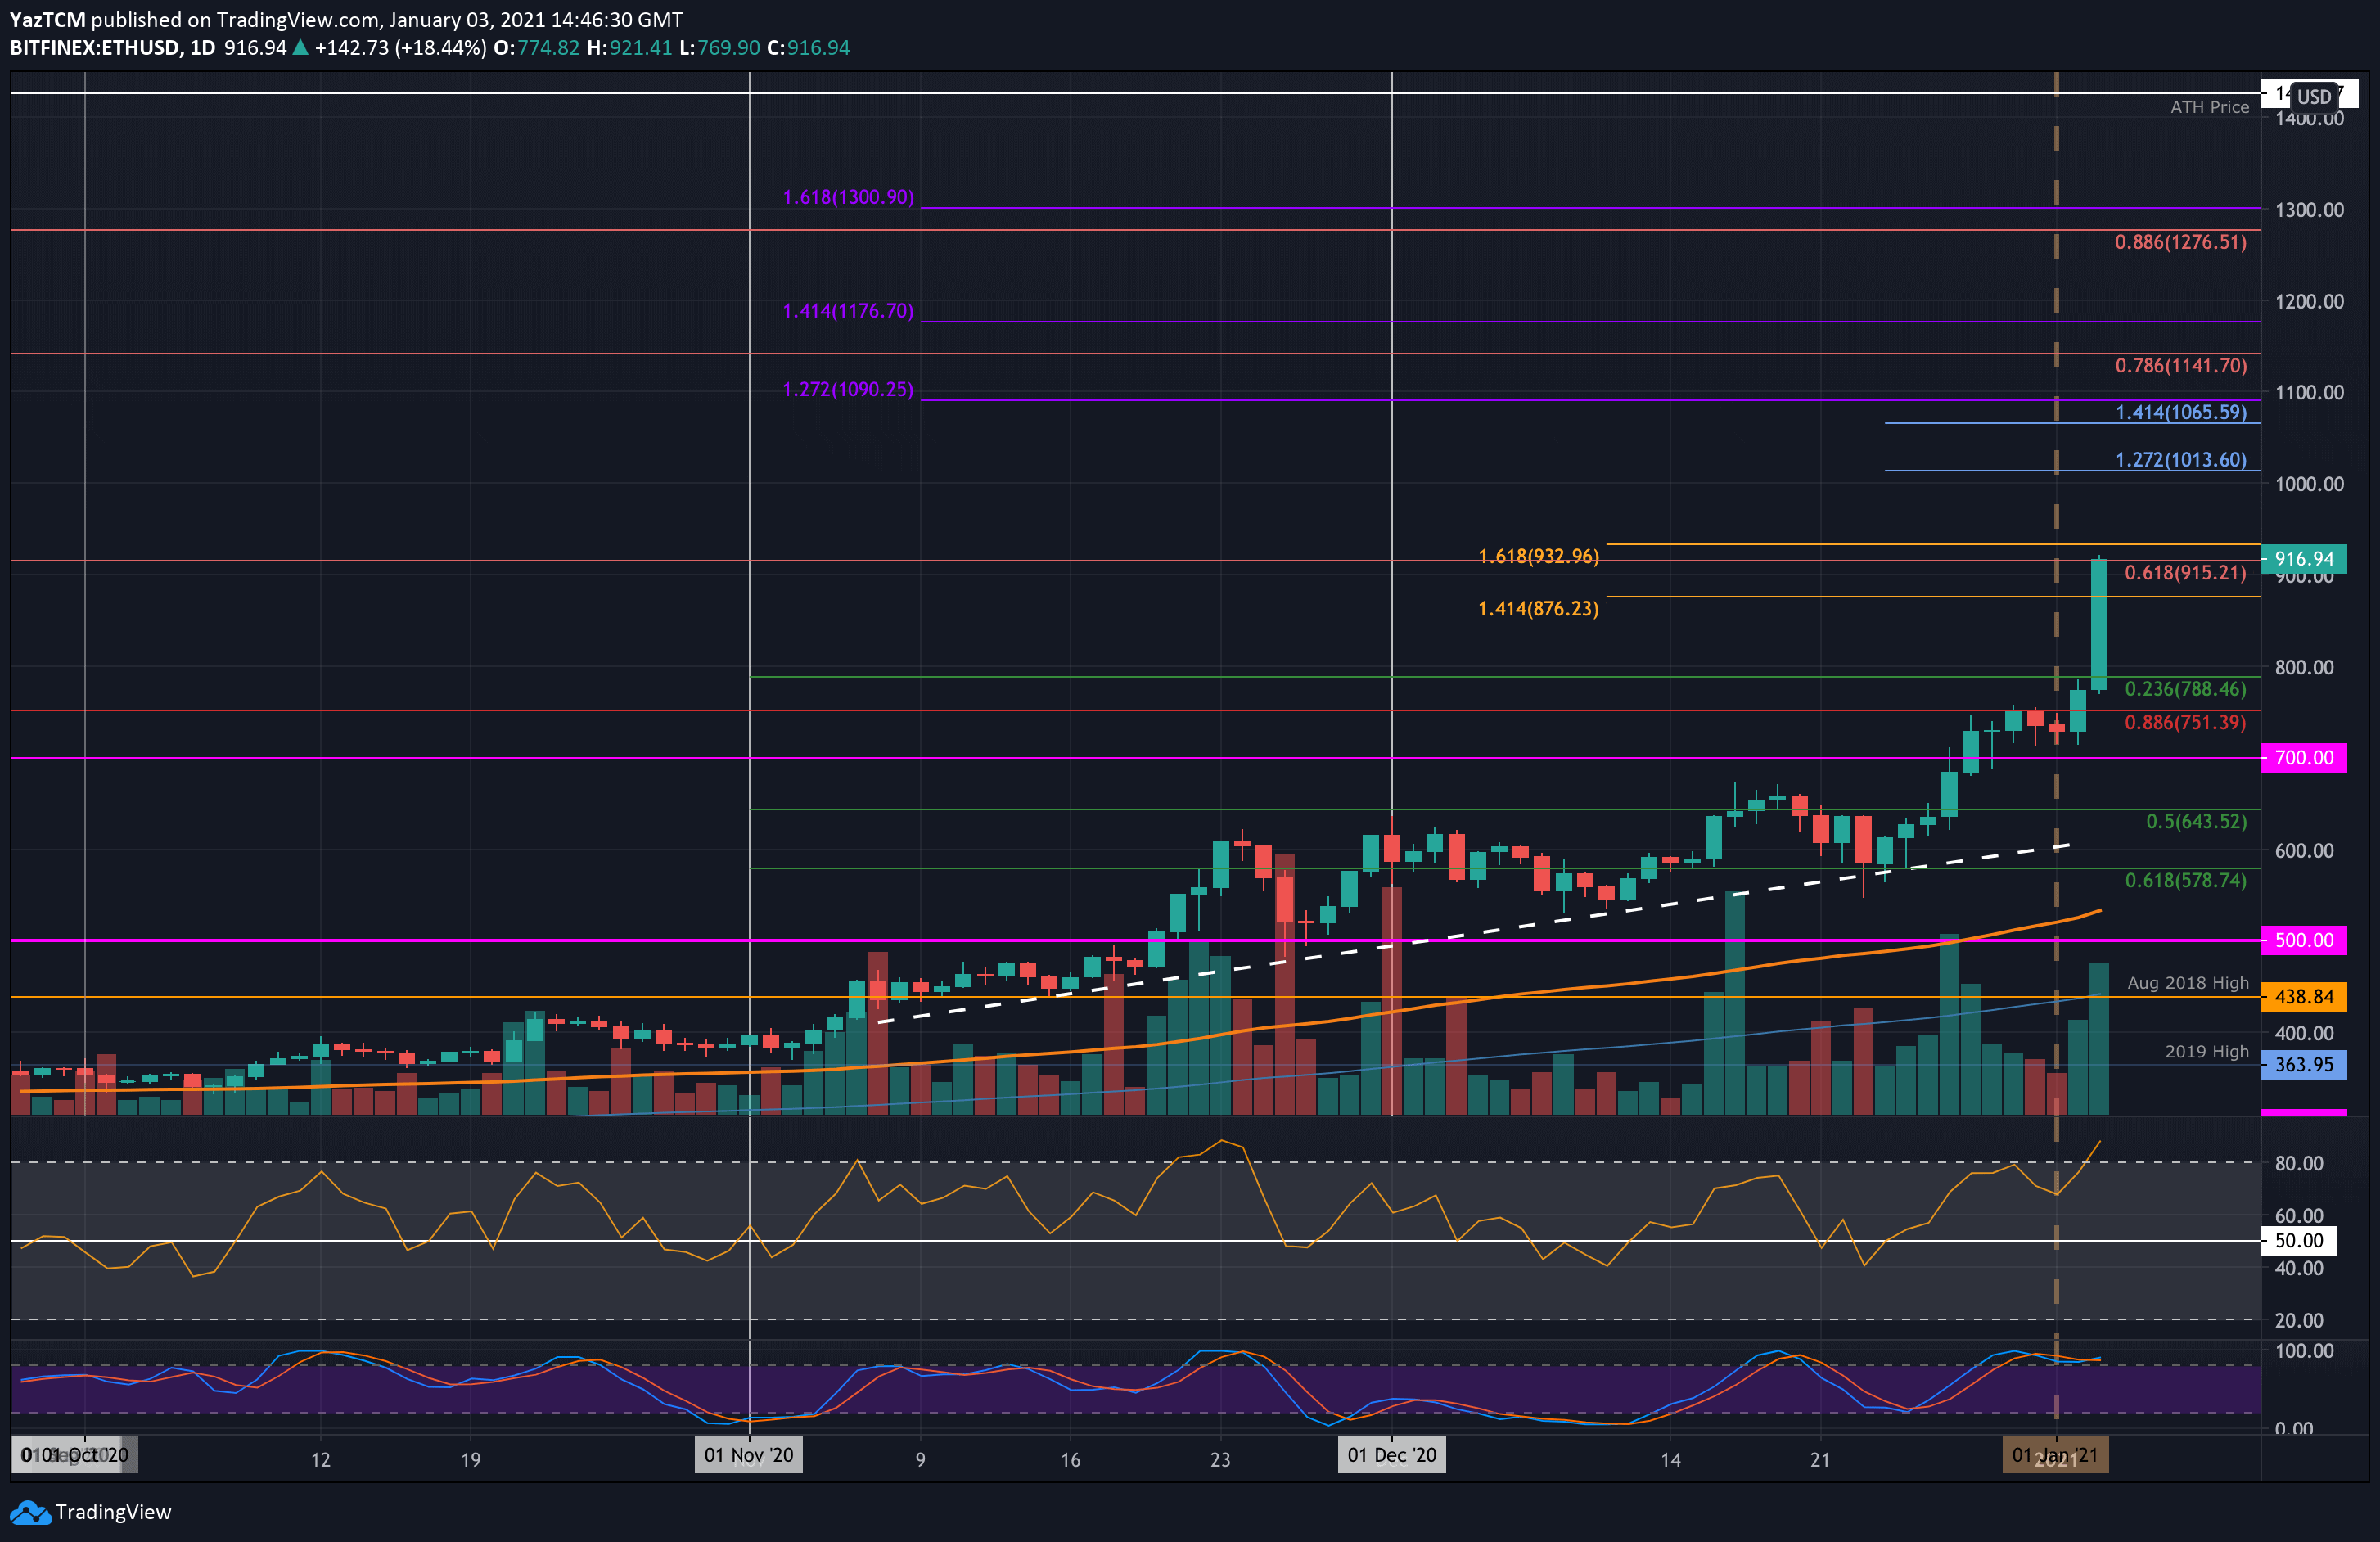
ETH/USD Daily Chart. Source: TradingView
Key Support Levels: $875, $850, $800.
Key Resistance Levels: $933, $950, $1000.
Etheruem saw an impressive 19% price surge today, causing the coin to break above $800 and $900 in a short 7-hour period. It was struggling to break resistance at $750 (bearish .886 Fib) for most of the week but eventually penetrated above it yesterday.
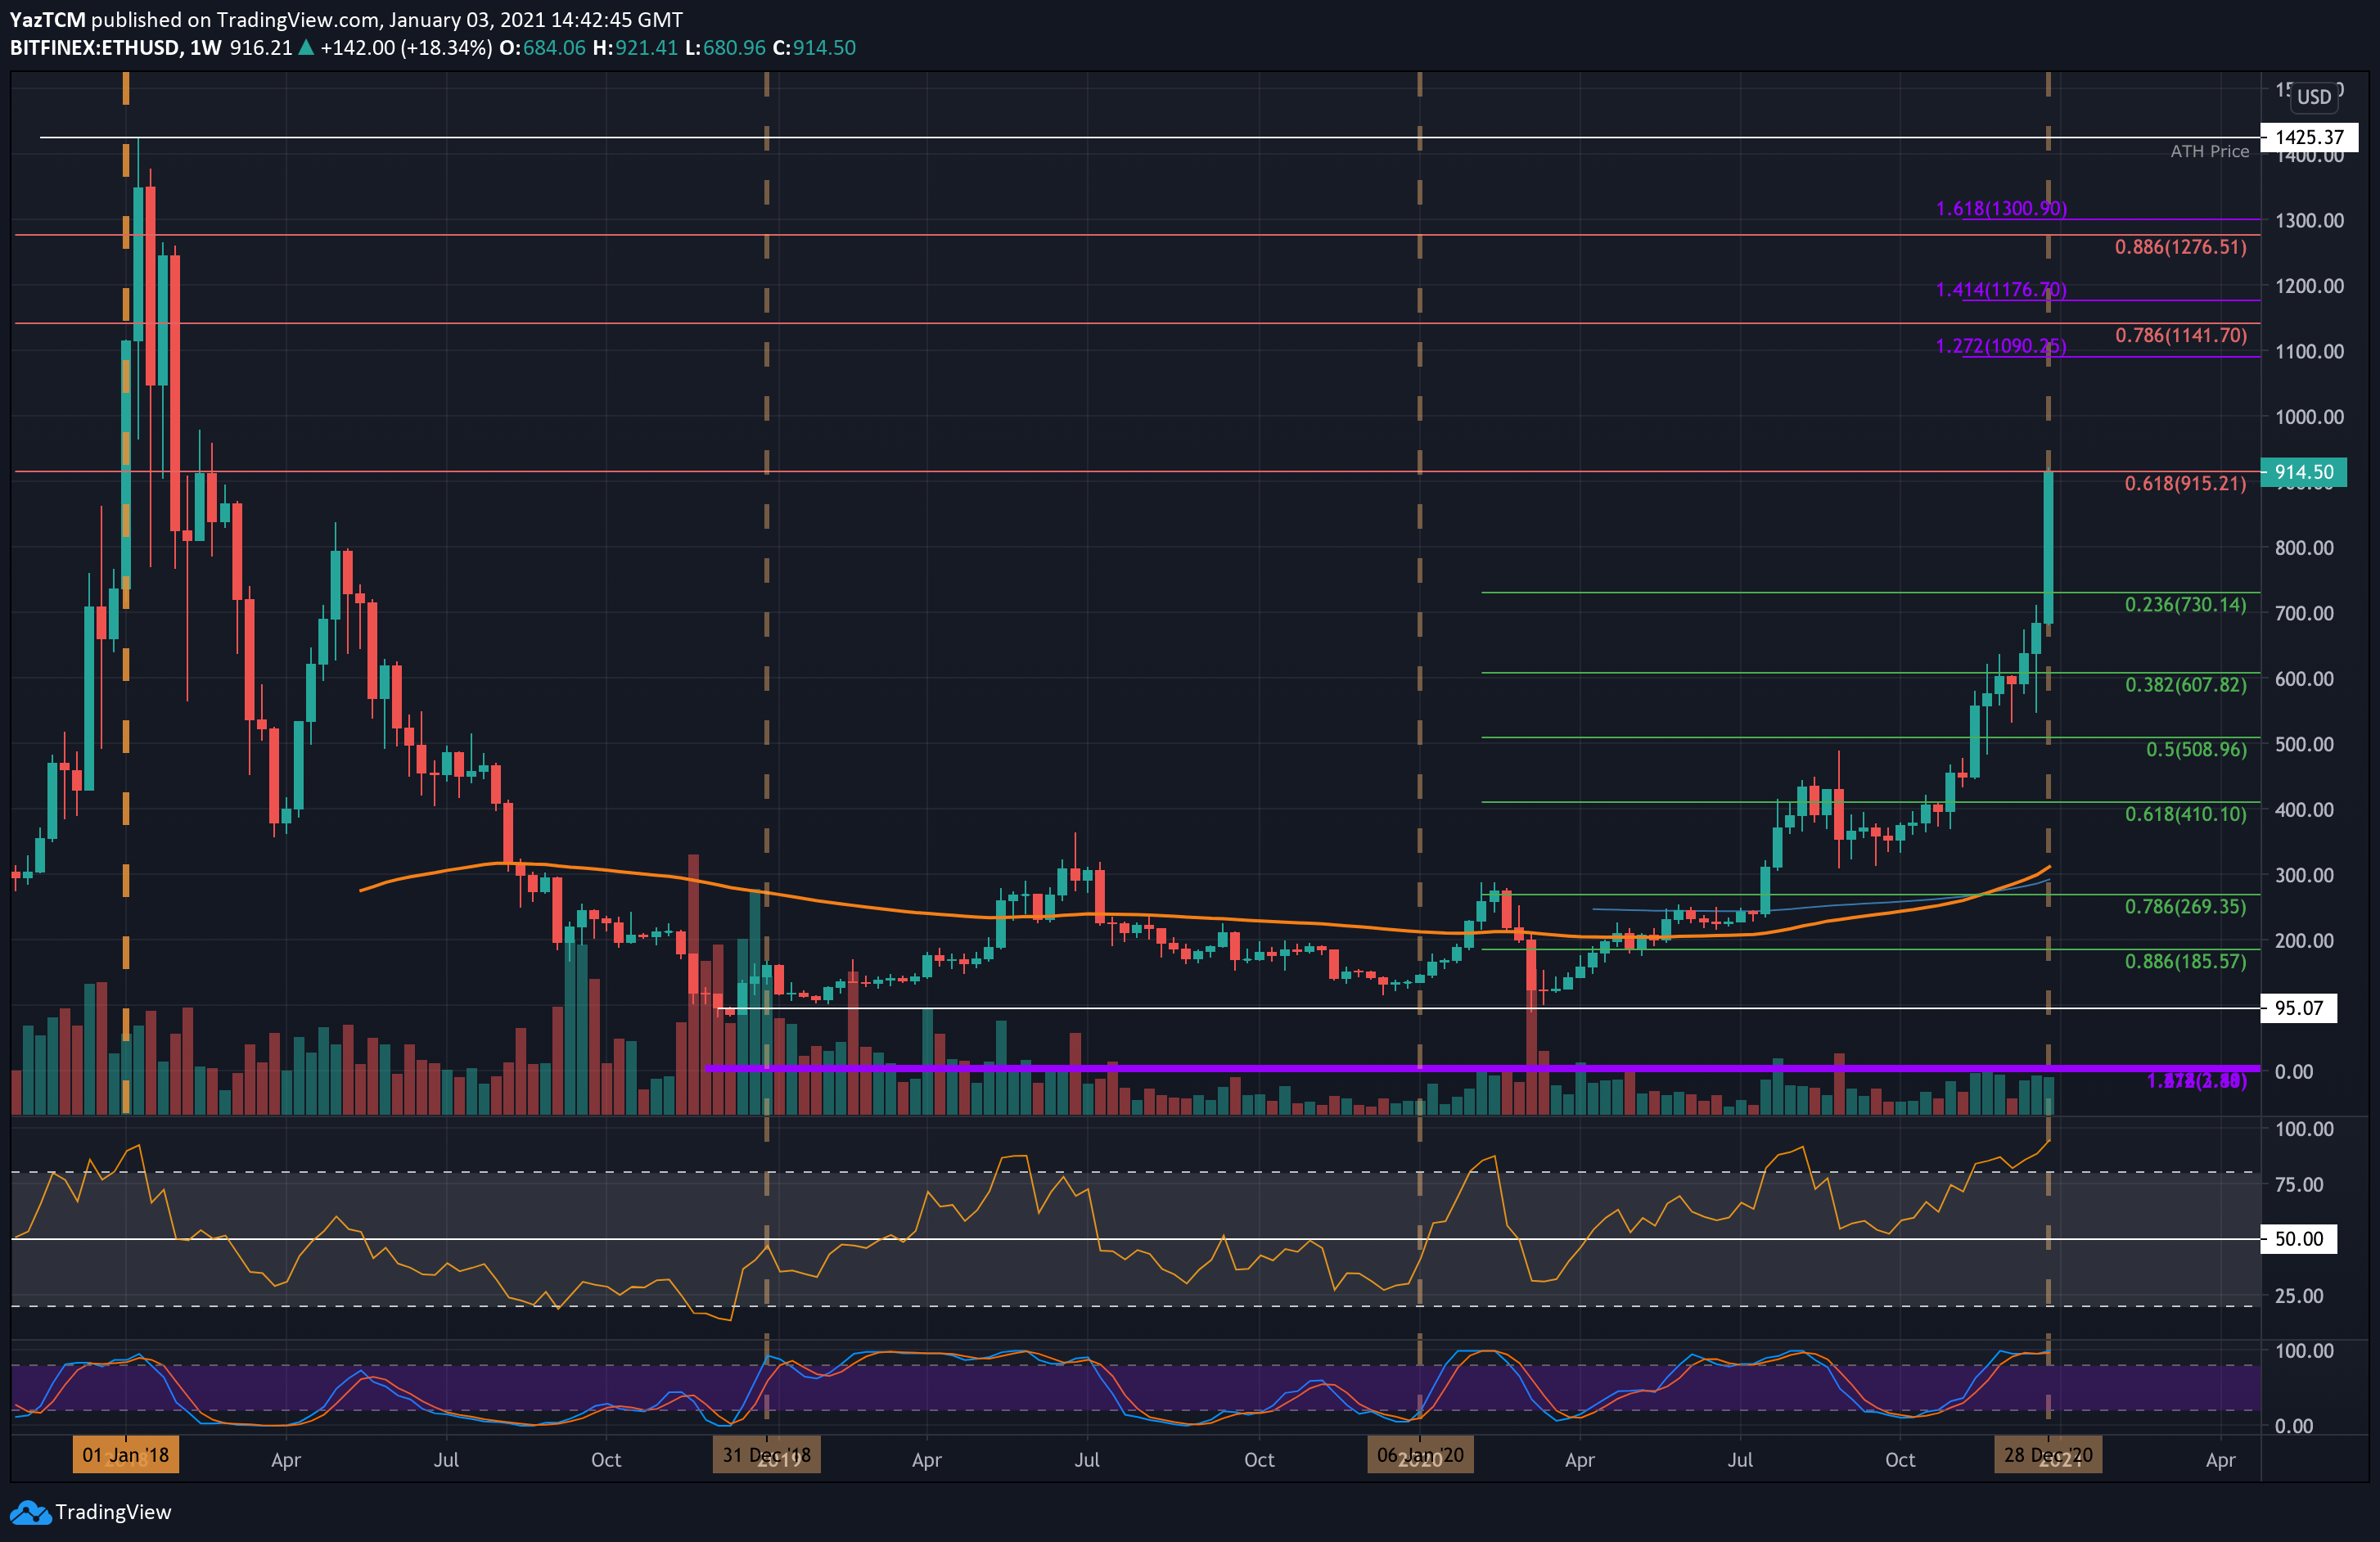
The cryptocurrency continued above $900 until it met resistance at a long term .618 Fibonacci Retracement level at $915. ETH is now up by a total of 41% over the past week, allowing the coin to set a new 34-month high today.
Looking ahead, the first level of resistance lies at $933 (near-term 1.618 Fib Extension). This is followed by $950, $1000, $1065 (1.414 Fib extension – blue), $1090 (med-term 1.272 Fib Extension), and $1100.
On the other side, the first level of support lies at $875. This is followed by $850, $800, and $788 (.236 Fib). Added support is found at $750, $700, and $645 (.5 Fib).
The daily RSI Is extremely overbought and has only been this extreme once in the past two months on December 16th, when BTC broke above $20,000. The Stochastic RSI is also overbought and is primed for a bearish crossover signal.
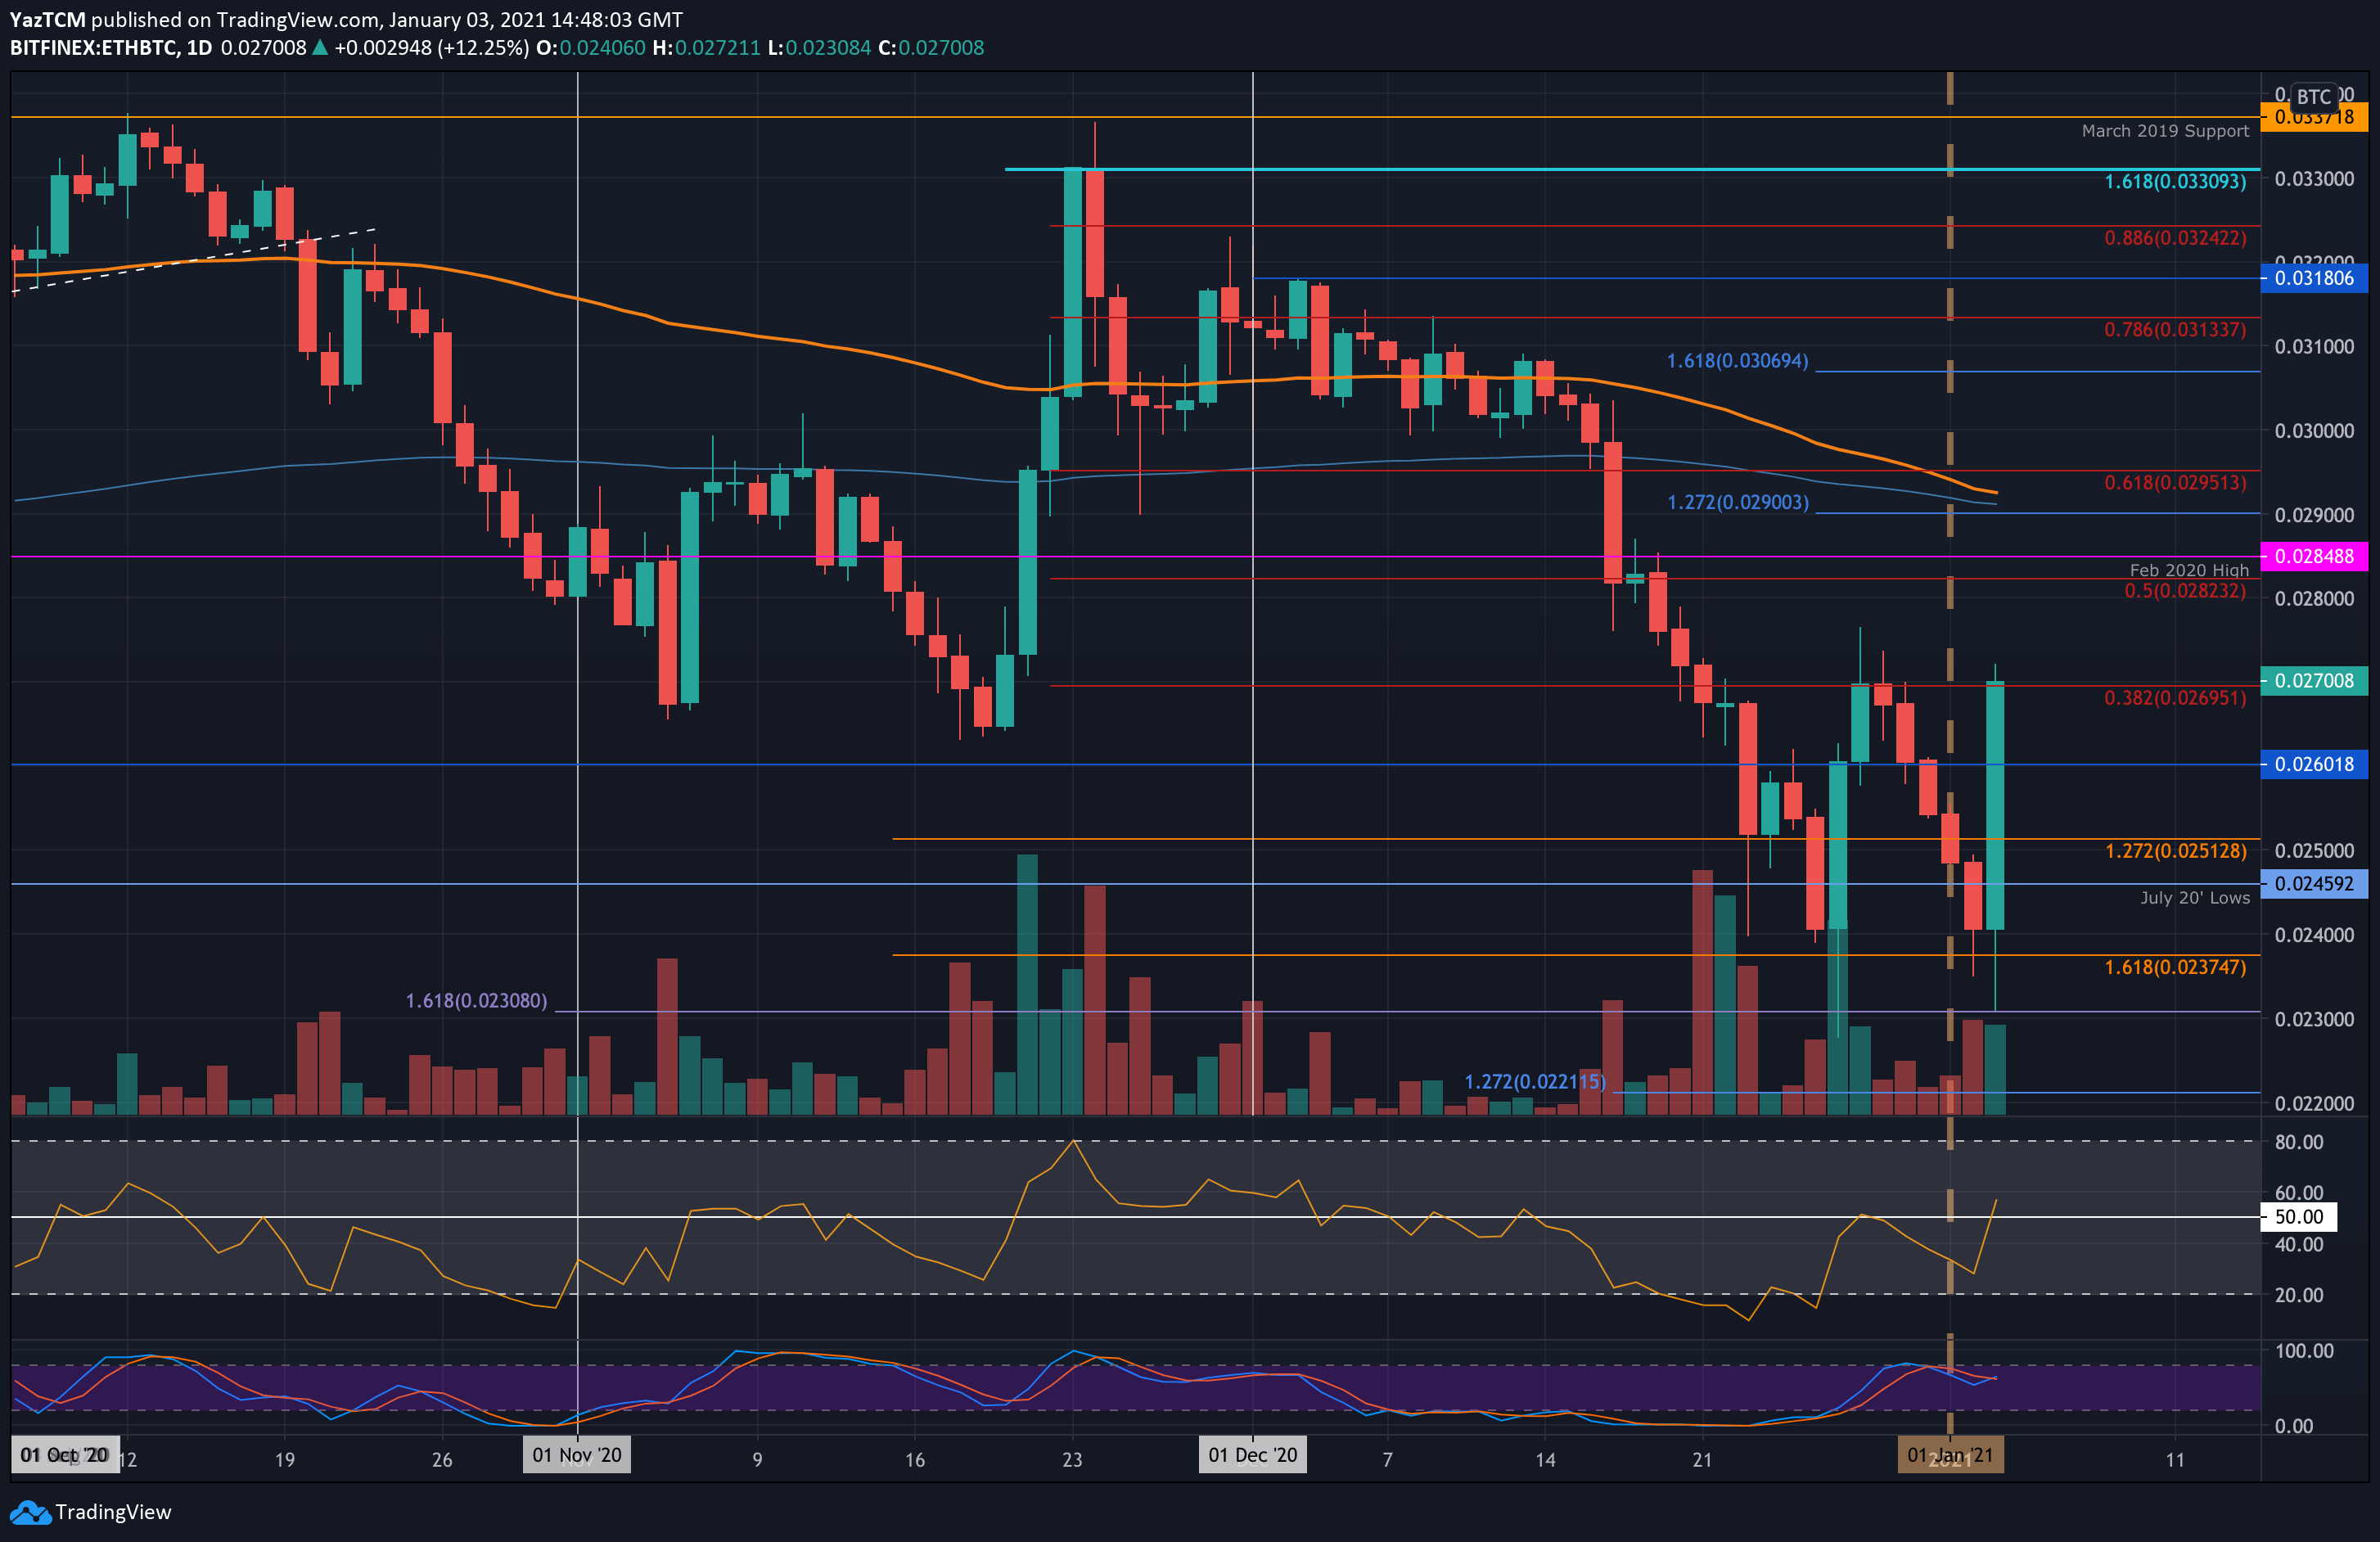
Key Support Levels: 0.026 BTC, 0.025 BTC, 0.0245 BTC.
Key Resistance Levels: 0.0282 BTC, 0.0285 BTC, 0.029 BTC.
Against Bitcoin, ETH was heading lower throughout the week as it fell from above 0.027 BTC to reach the support at 0.024 BTC yesterday. Today, the coin briefly spiked lower into 0.023 BTC, but the bulls regrouped and turned the market around.
After rebounding from 0.023 BTC, ETH pushed back above 0.026 BTC to reach the current 0.027 BTC resistance (bearish .382 Fib Retracement).
Looking ahead, if the buyers continue beyond 0.027 BTC, the first level of resistance lies at 0.0282 BTC (bearish .5 Fib). This is followed by 0.0285 BTC (Feb 2020 High), 0.029 BTC (200-days EMA), and 0.0295 BTC (bearish .618 FIb).
On the other side, the first level of support lies at 0.026 BTC. This is followed by 0.025 BTC, 0.0245 BTC (July 2020 Lows), and 0.024 BTC.
The RSI recently crossed the mid-line to signal the buyers have regained control of the market momentum.