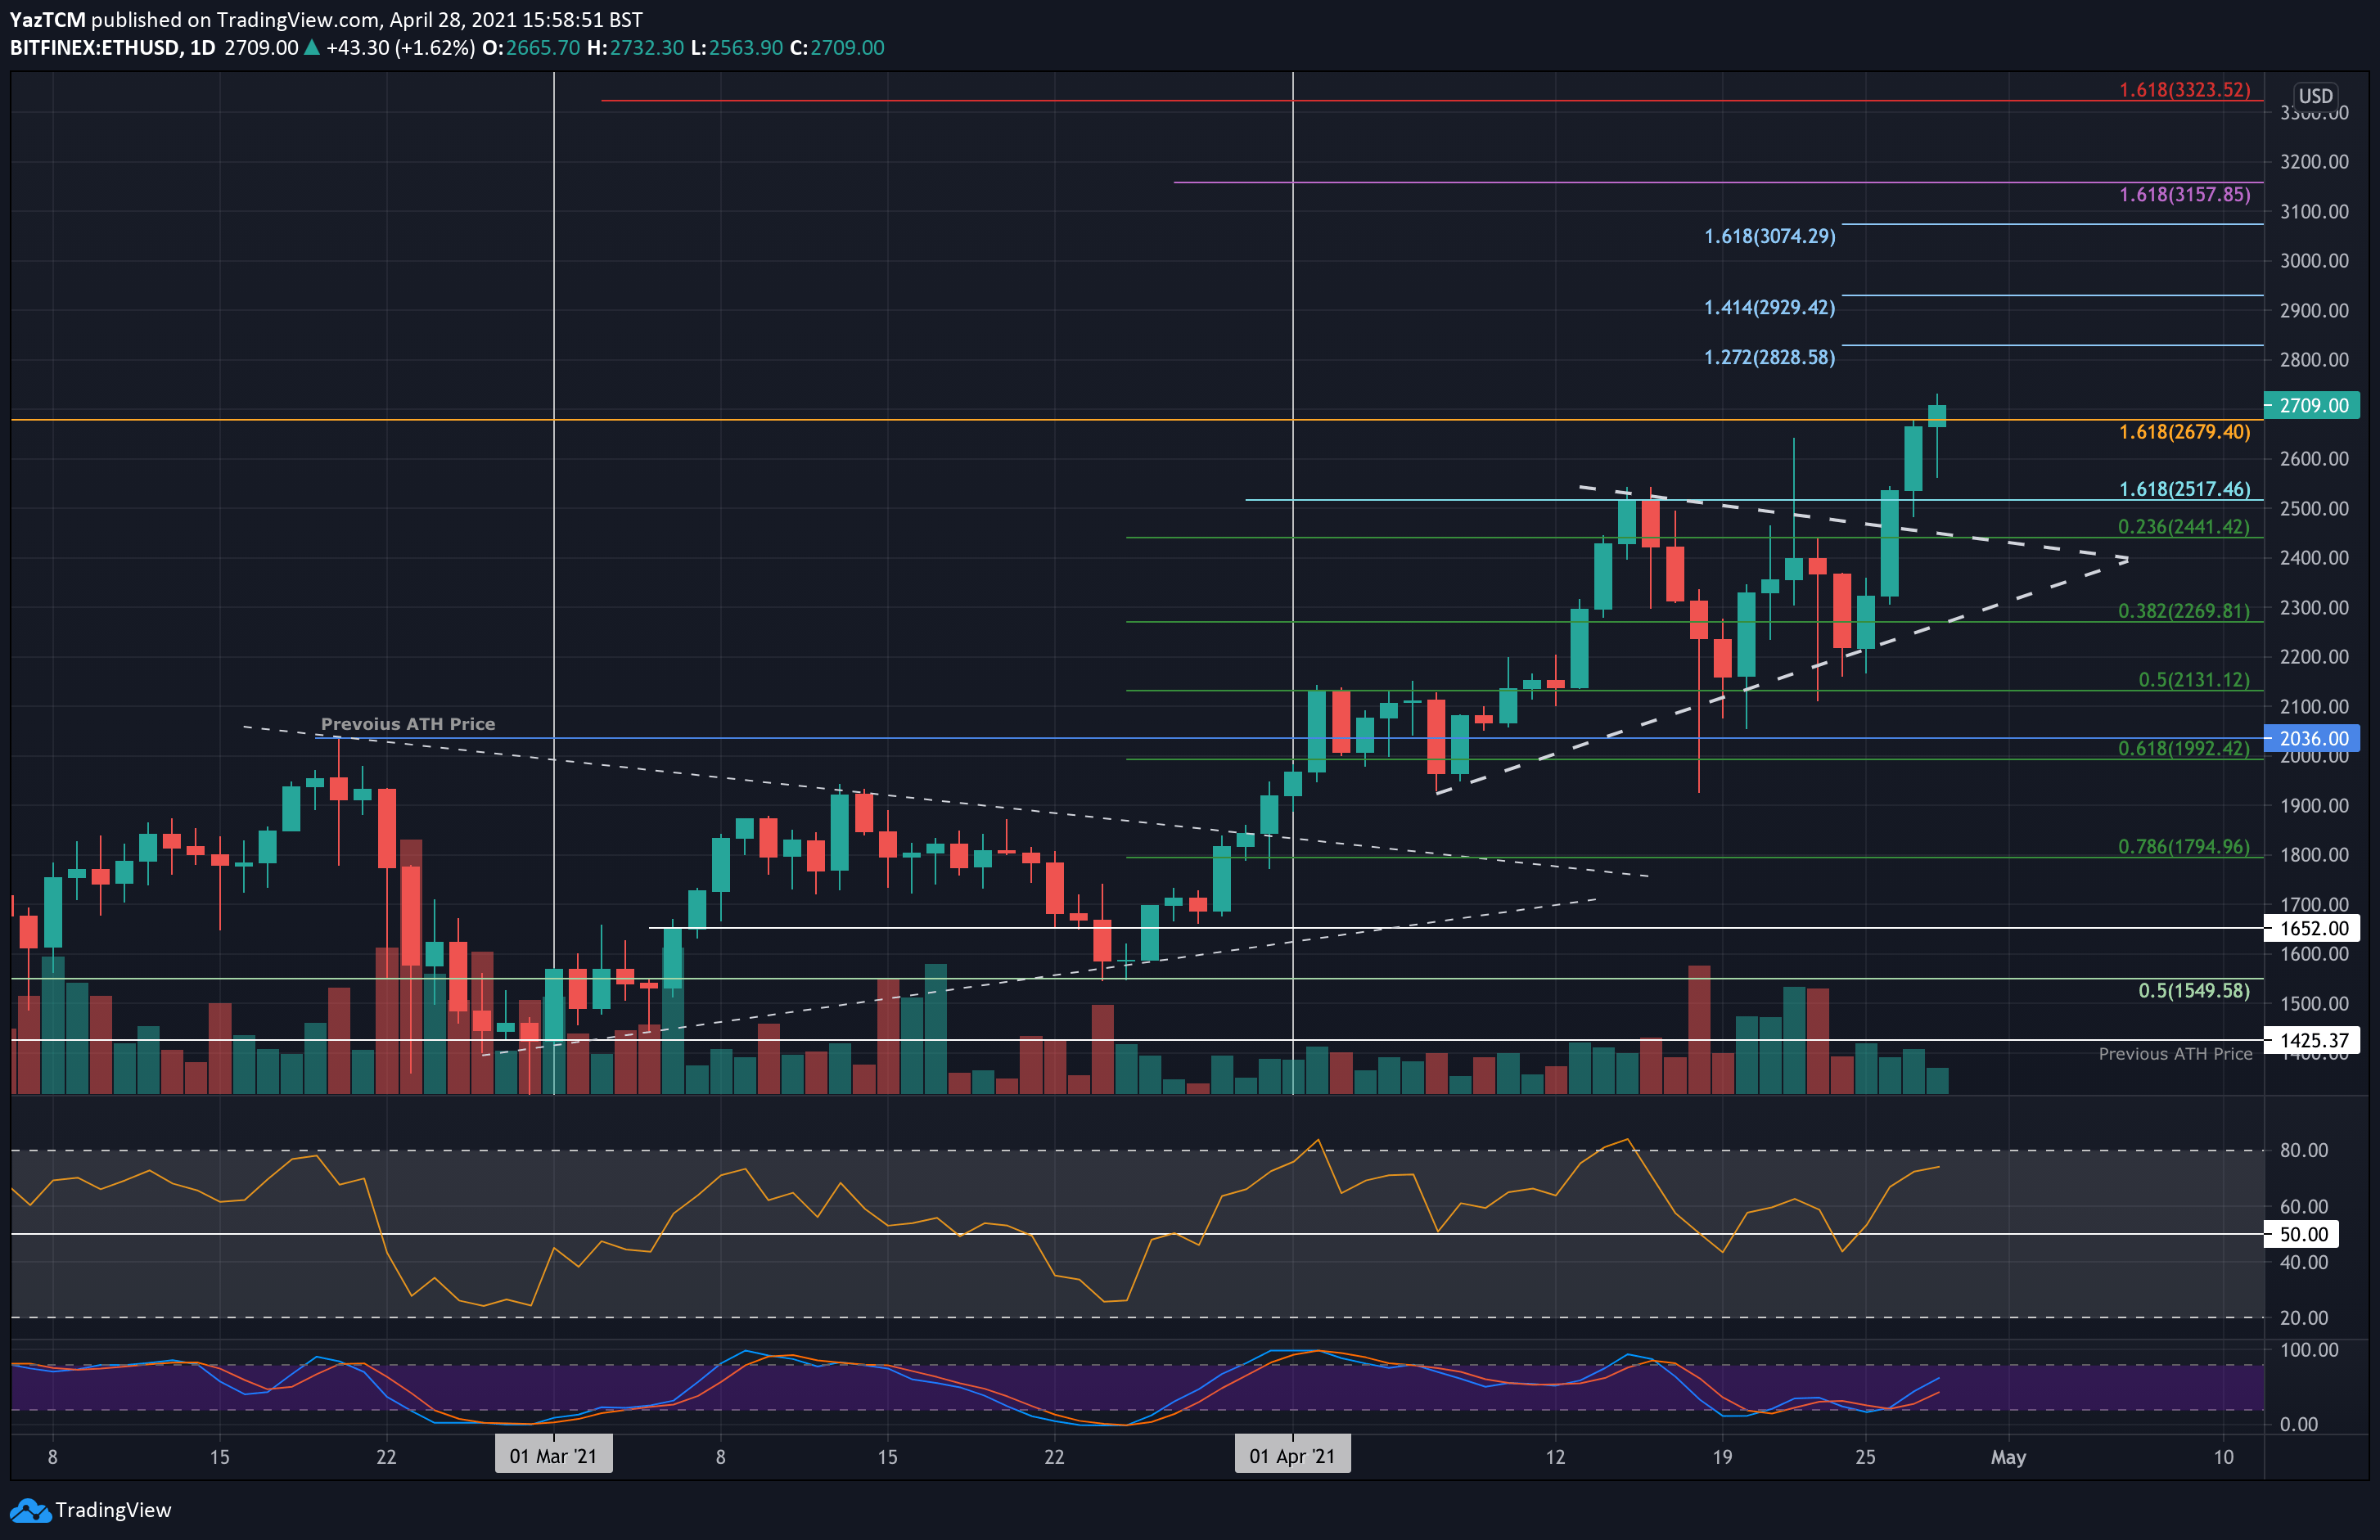
ETH/USD Daily Chart. Source: TradingView
Key Support Levels: $2600, $2520, $2440.
Key Resistance Levels: $2830, $2930, $3000.
Ethereum is up by an impressive 16% this week as the cryptocurrency set a new ATH today at $2732. The coin found support around $2200 on Sunday as it rebounded from the lower boundary of a symmetrical triangle pattern.
This consolidation pattern was broken on Monday as ethereum pushed above $2520. The bullish pressure continued yesterday as ETH reached the resistance at $2680 (1.618 Fib Extension). Today, it increased by another 3% to set the new ATH. It has since dropped slightly and is trading at around $2700.
Looking ahead, the first level of resistance lies at $2830 (1.272 Fib Extension). This is followed by $2930 (1.414 Fib Extension), $3000, and $3076 (1.618 Fib Extension).
On the other side, the first support lies at $2600. This is followed by $2520, $2440 (.236 Fib), $2400, and $2270 (.382 Fib).
The RSI is back above the midline this week as the bulls take control of the market momentum. There is still room to push higher before the market becomes overbought.
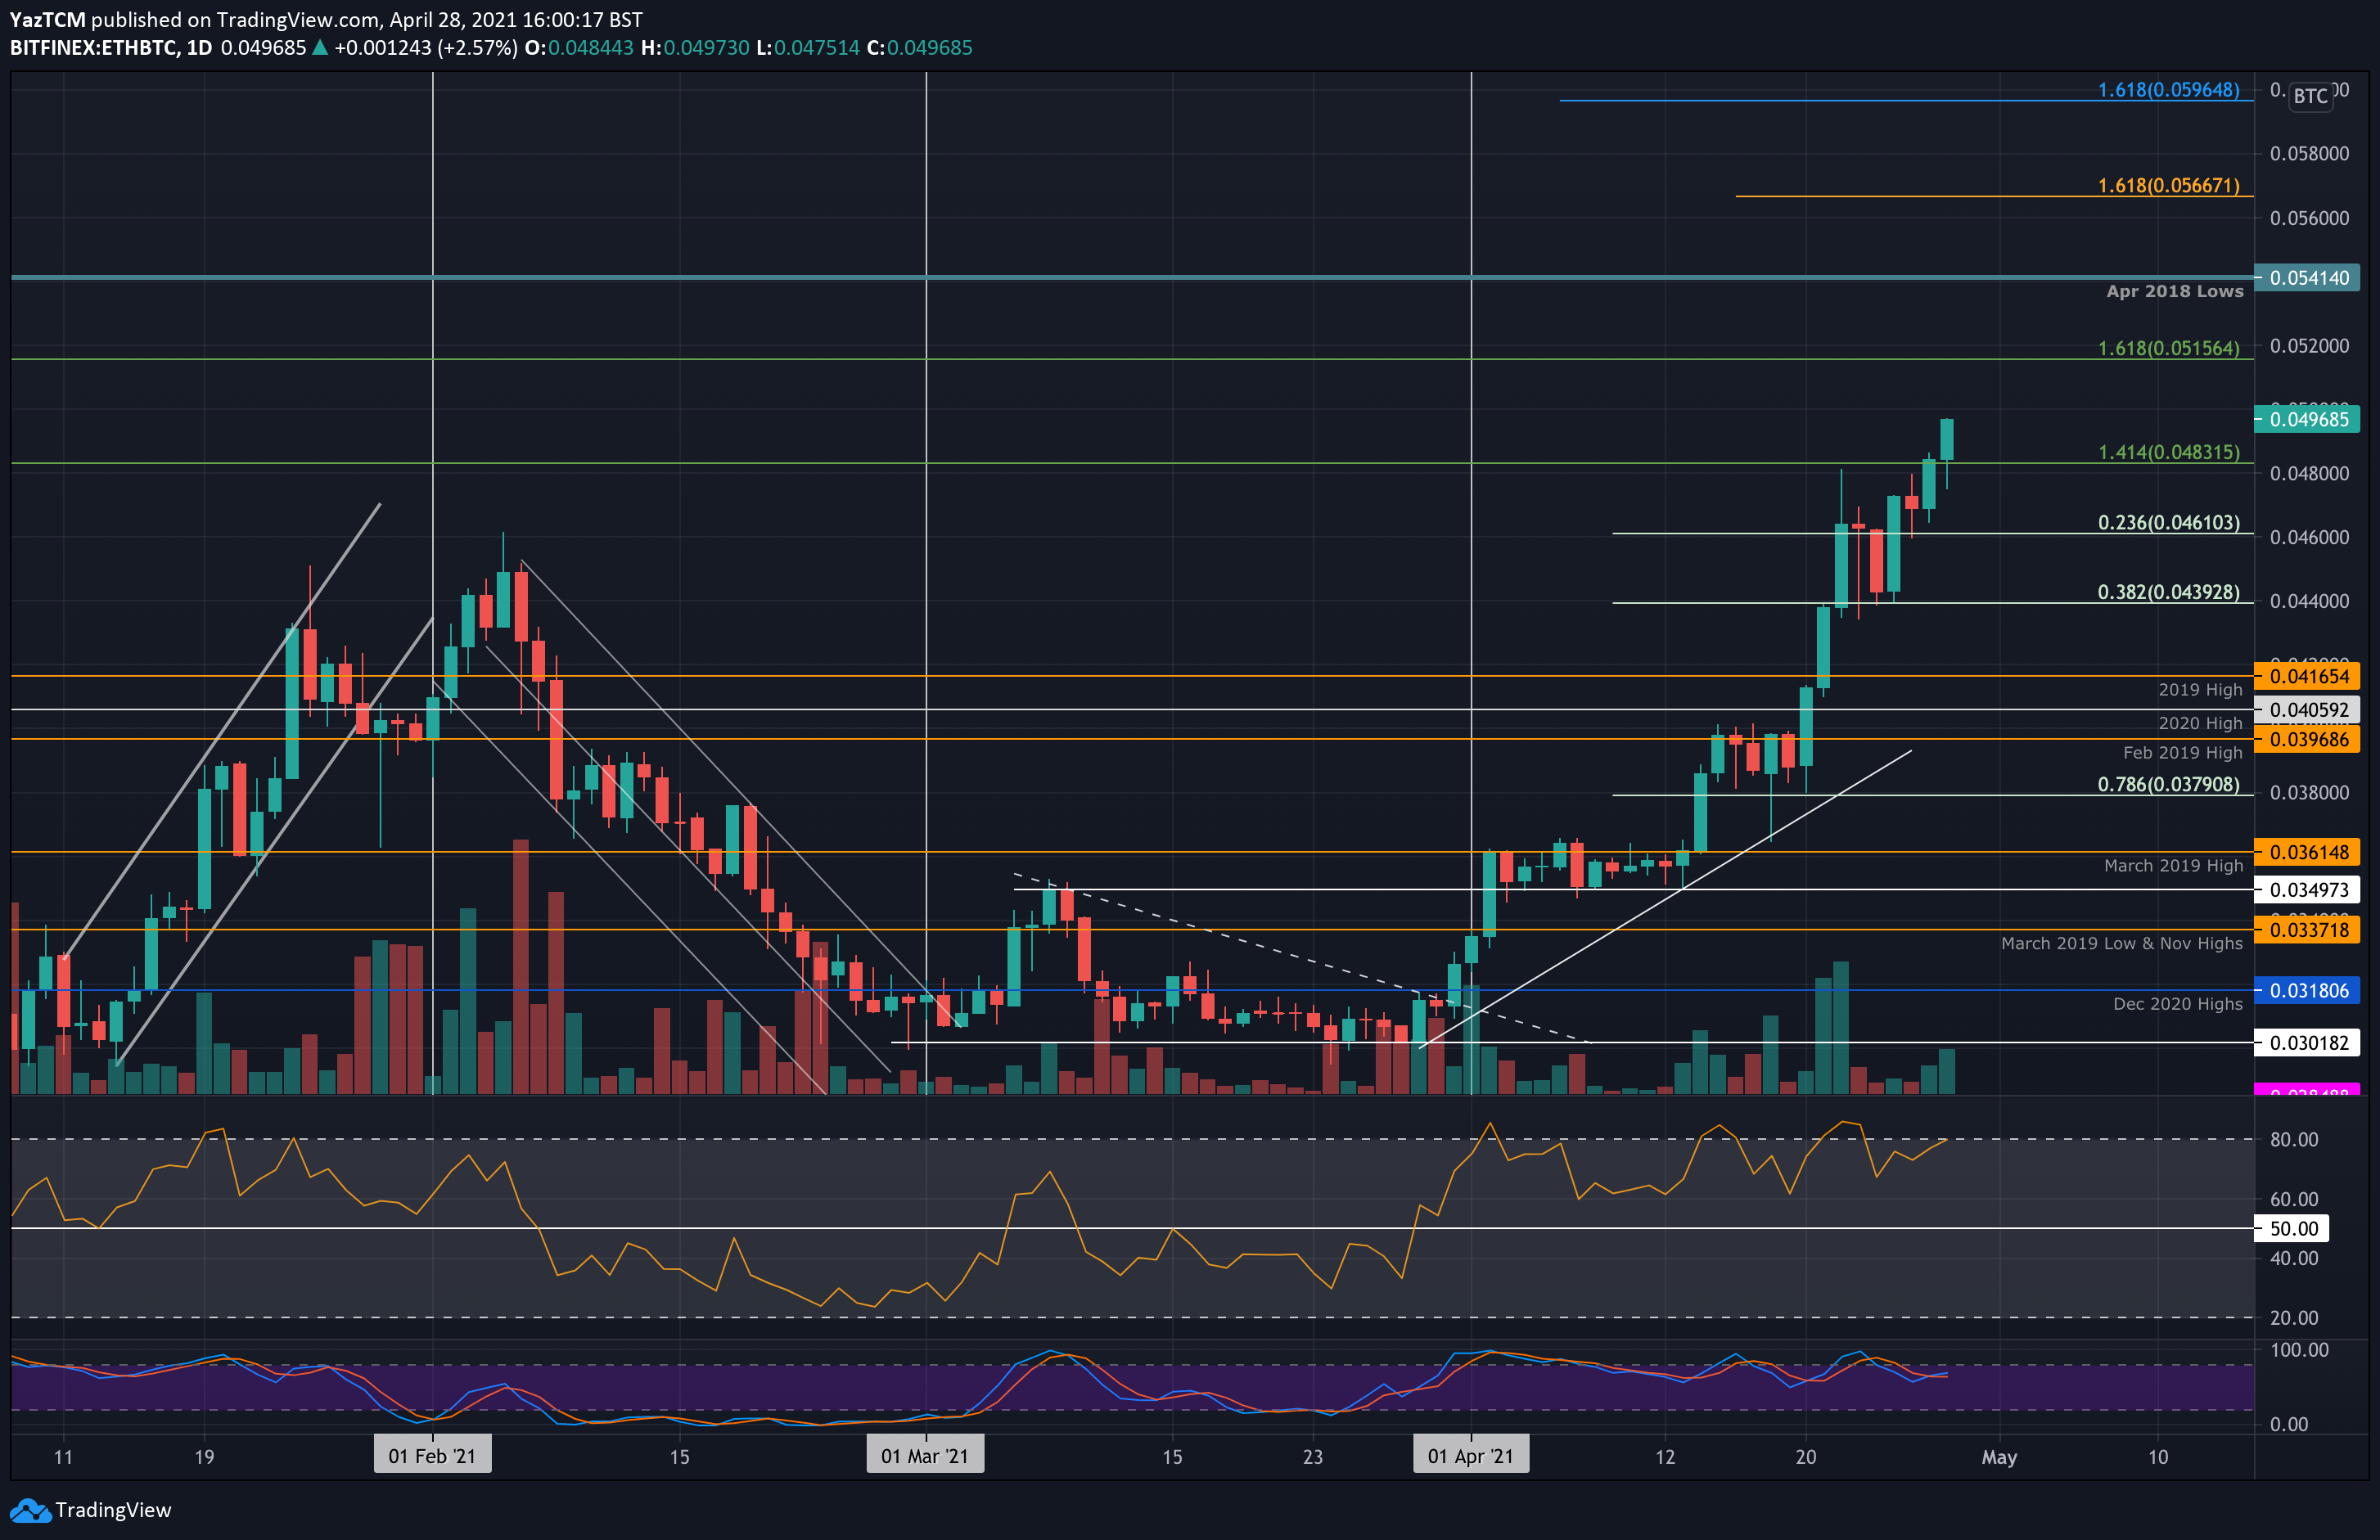
Key Support Levels: 0.0483 BTC, 0.0461 BTC, 0.0439 BTC.
Key Resistance Levels: 0.05, 0.0515 BTC, 0.055 BTC.
Ethereum is also strong against bitcoin as it hits a high of 0.0497 BTC, a level not seen since August 2018. The coin found support at 0.044 BTC over the weekend and rebounded from there at the start of the week.
Yesterday, ETH reached the resistance at 0.0483 BTC (1.414 Fib Extension). The market penetrated this resistance today as the bulls head toward 0.05 BTC.
Looking ahead, once the bulls break 0.05 BTC, the first resistance lies at 0.0515 BTC (1.618 Fib Extension). This is followed by 0.055 BTC, 0.0566 BTC (1.618 Fib Extension), and 0.058 BTC.
On the other side, the first support lies at 0.0483 BTC. This is followed by 0.0461 BTC (.236 Fib), 0.0439 BTC (.382 Fib), and 0.0416 BTC (2019 High).
The RSI is starting to show signs of bearish divergence as price action makes new highs, but the RSI fails to do so. It is also approaching extremely overbought conditions – suggesting a brief retracement might be needed.