ETH/USD Daily Chart. Source: TradingView.
Key Support Levels: $2800, $2740, $2600.
Key Resistance Levels: $2892, $3000, $3135.
ETH is looking healthy today with a 5.5% surge allowing it to break this week’s resistance at $2740. The coin had bounced from $2200 at the start of the week and began to push higher. On Monday, it managed to break $2600 and climb above a descending trend line to reach the $2740 resistance.
Today’s 5.5% price hike also allowed ETH to break back above the 20-day MA level for the first time since the May market capitulation started. Resistance at $2892 (50-day MA) still needs to be broken before ETH can hit $3000 and resume its bull run.
Looking ahead, the first resistance lies at $2892 (bearish .382 Fib & 50-day MA). This is followed by $3000, $3135 (bearish .5 Fib), and $3380 (bearish .618 Fib).
On the other side, the first support lies at $2800. This is followed by $2740, $2600, $2470 (.382 Fib), and $2333 (.5 Fib & 100-day MA).
The RSI recently poked above the midline, indicating that the bulls are trying to increase their momentum. This is the first time the RSI has turned bullish since the industry-wide capitulation seen in May.
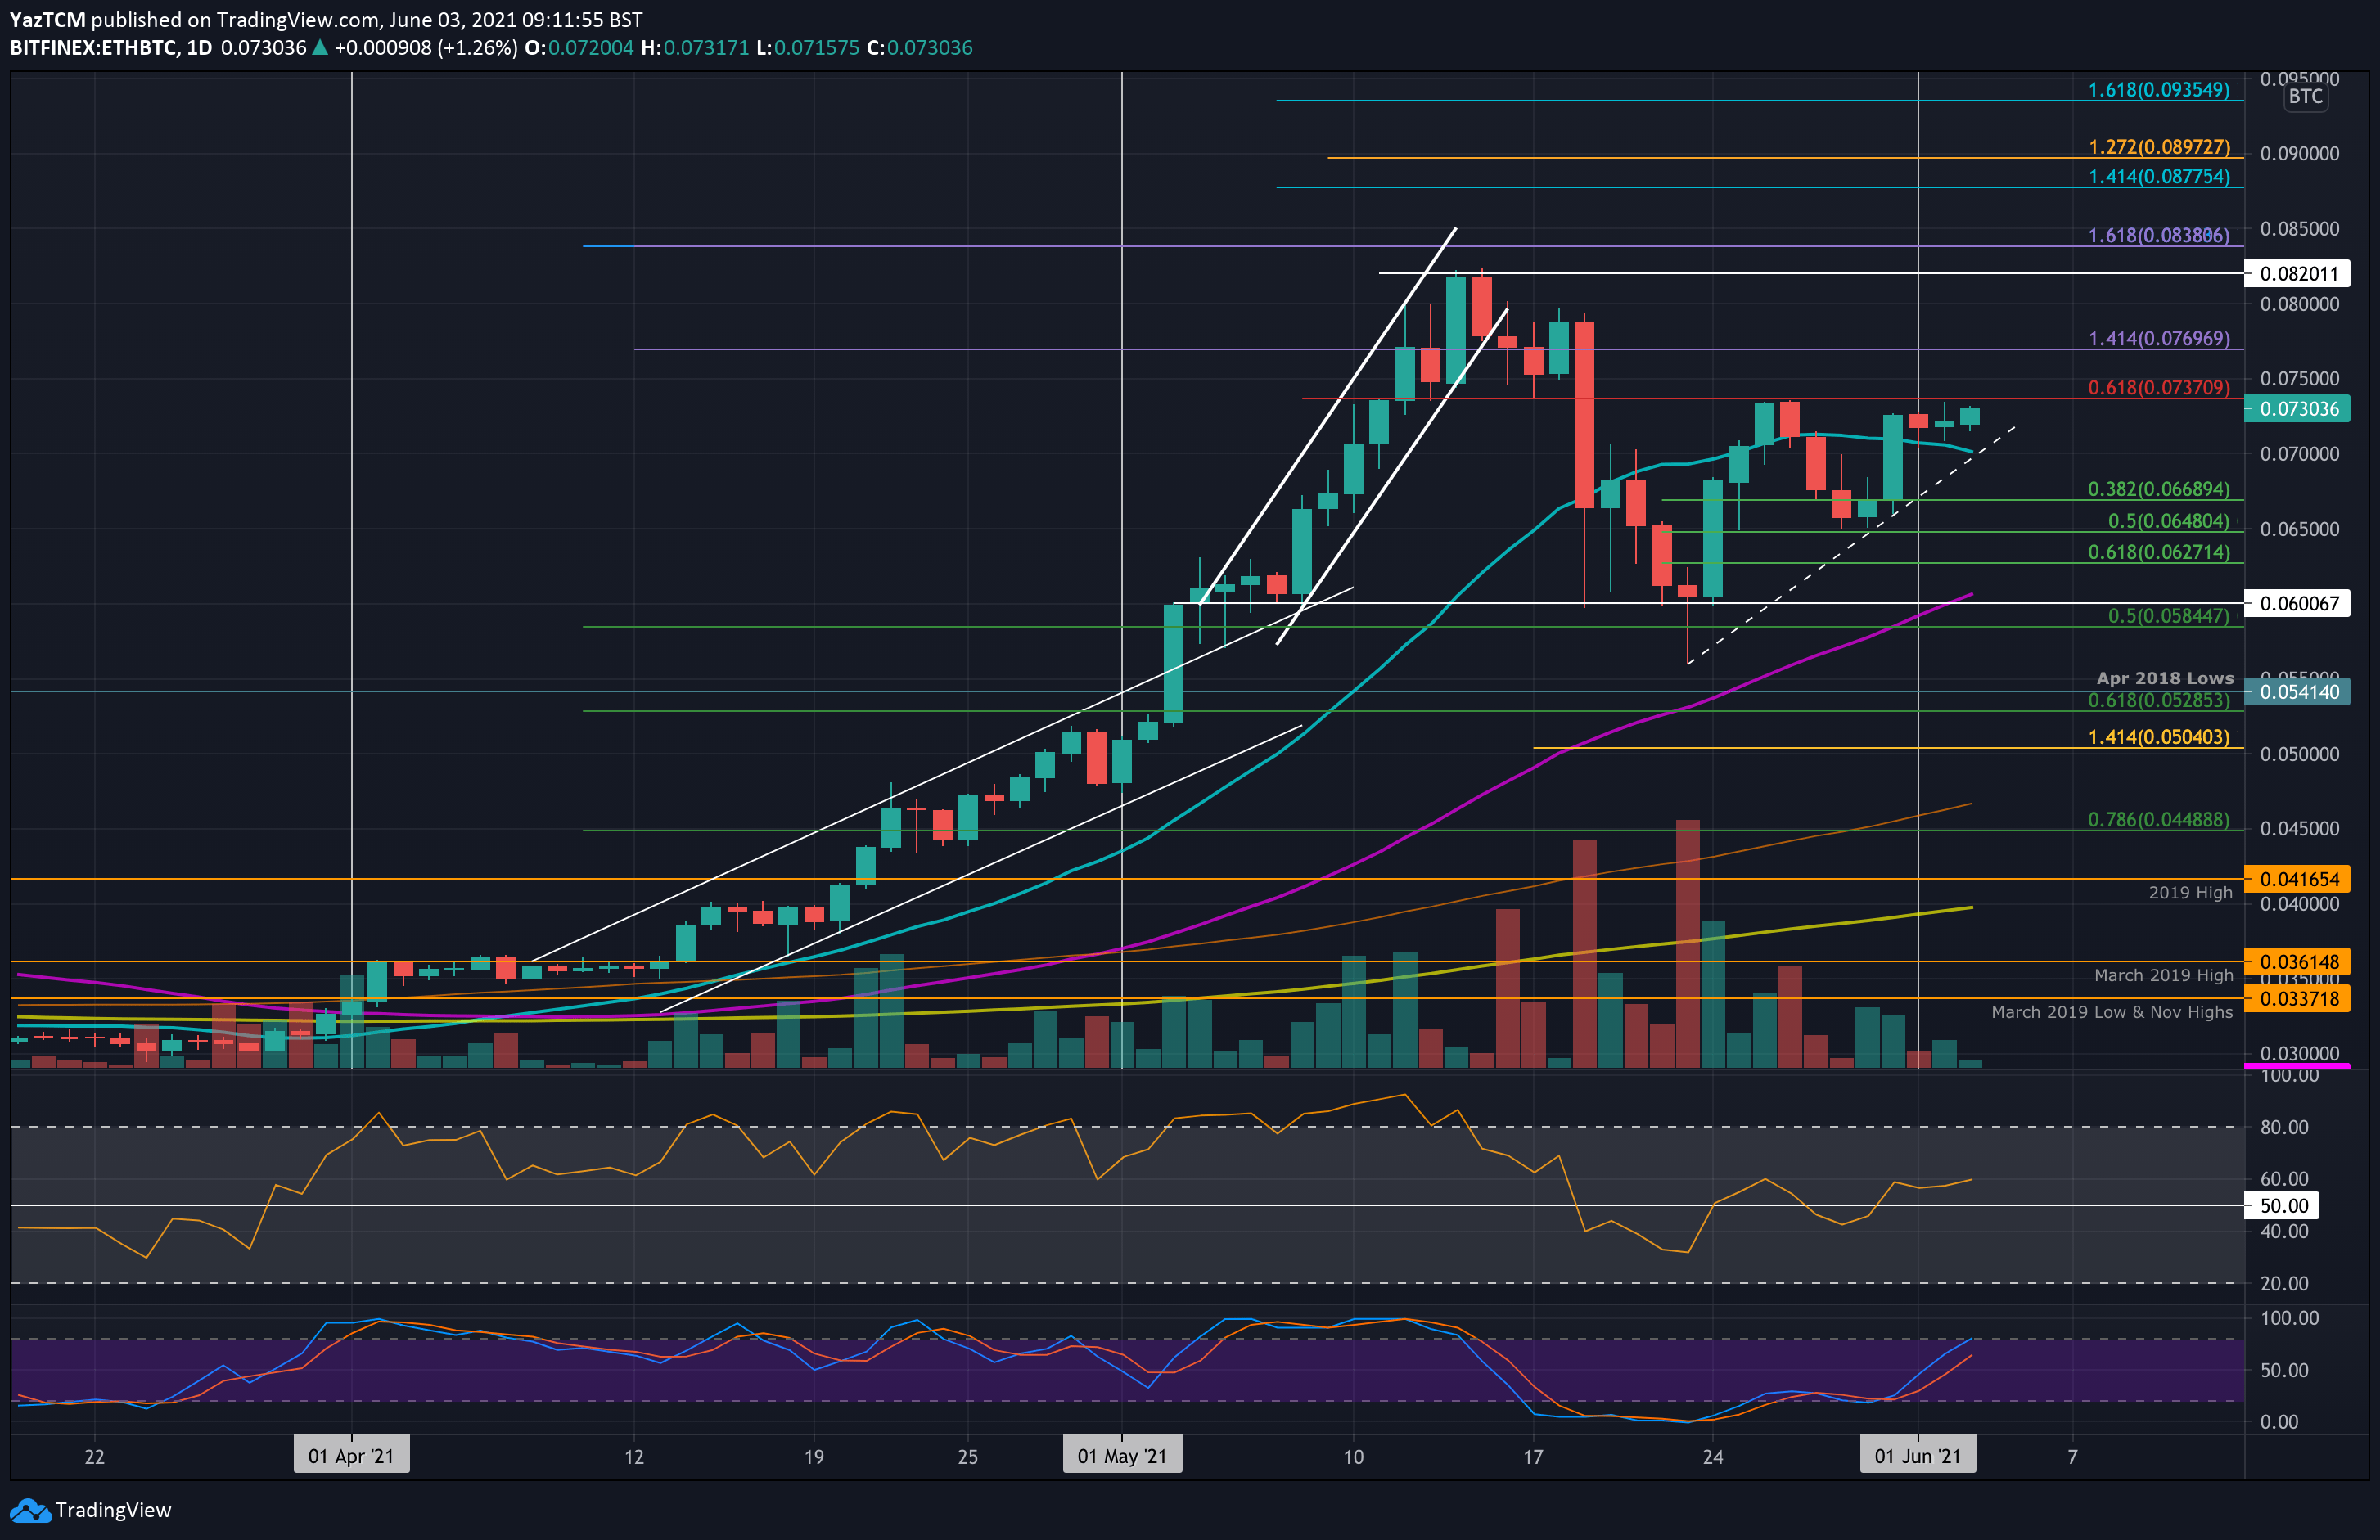
Key Support Levels: 0.07 BTC, 0.067 BTC, 0.0648 BTC.
Key Resistance Levels: 0.0737 BTC, 0.075 BTC, 0.0769 BTC.
Ethereum is also performing well against BTC but still needs to break beyond 0.0737 BTC to really take off. The resistance forms the roof of the current ascending triangle that it is trading within, and the market was rejected at this level last week.
Over the weekend, ETH found solid support at 0.065 BTC (.5 Fib Retracement) and rebounded higher to break above the 20-day MA on Monday. It is now edging to the roof of the triangle, and a breakout should allow the coin to return to the May highs at 0.082 BTC.
Looking ahead, if the first resistance lies at 0.0737 BTC (bearish .618 Fib). This is followed by 0.075 BTC, 0.0769 BTC (1.414 Fib Extension), and 0.08 BTC.
On the other side, the first support now lies at 0.07 BTC (20-day MA). This is followed by 0.067 BTC, 0.0648 BTC (.5 Fib), and 0.0627 BTC (.618 Fib).
The RSI is within bullish territory but needs to continue beyond the 60 level to create a higher high and indicate that the bullish momentum is increasing.